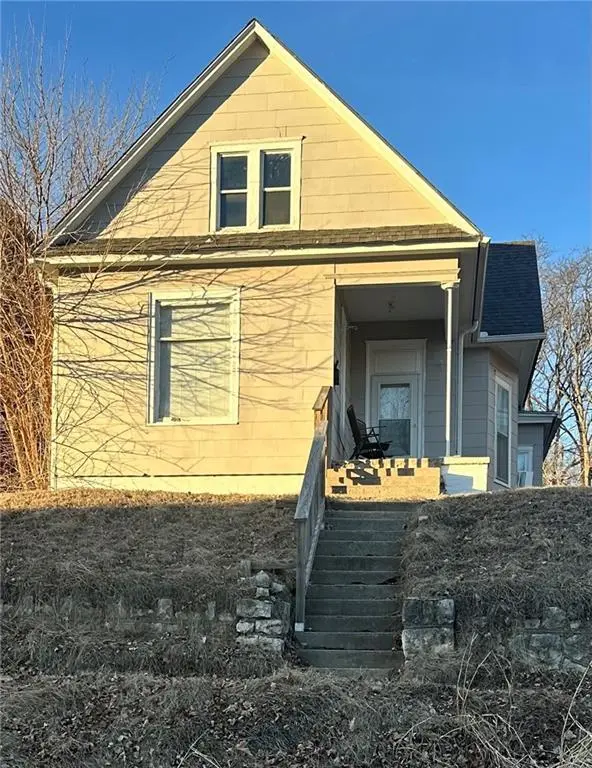
1617 Belle St · St. Joseph, MO
Flood risk 1/10 · Minimal
- FEMA flood zone
- X
- Chance of flooding over 30 yrs
- 0.0%
- Est. flood insurance / yr
- $473 – $860
Fire risk 2/10 · Minimal
- Est. fire insurance / yr
- $1,054 – $1,958
Heat risk 4/10 · Minor
- Hot days now (above 106°F)
- 7 days/yr
- Hot days in 30 yrs
- 16 days/yr
Wind risk 2/10 · Minimal
- Chance of severe wind over 30 yrs
- —
Air-quality risk 2/10 · Minimal
- Unhealthy air days now
- 1 days/yr
- Unhealthy air days in 30 yrs
- 2 days/yr
Risk factors via First Street. Map © Google.
Why this score? — see what drove the C- grade
The composite is a weighted blend of 9 inputs, each scored 0–100. Each bar is that input's sub-score; the figure is the points it added to the 100-point composite (weight × sub-score).
- Cash flow +25.9/30.0
- DSCR +8.7/10.0
- 1% rule +5.8/10.0
- Schools +2.8/10.0
- ARV discount +2.7/15.0
- Rent growth +2.5/5.0
- Livability +2.5/5.0
- Condition / age +2.5/5.0
- Appreciation +0.0/10.0
$90,000
🖨 Deal sheet 📄 Offer letter ✓ Due diligence
Listing remarks MLS
Attention investors! This two bedroom, one bathroom home features updated luxury vinyl plank, hardwood floors, and carpet. Laundry hook-ups are available in the mudroom. The home is currently occupied by long-term tenants. This turn-key property will make a great addition to any portfolio!
Key facts
- 5,000 sq ft lot
- Built 1917
- Listed 136 days
Neighborhood map
What this means for you Summary
Snapshot
- This is a 2-bed/1.0-bath single-family listed at $90k.
Deal economics
- At list price, monthly cash flow is $221 ($3k/yr) — positive.
- The deal already cash-flows at list — no discount required.
- Meets the 1% rule at list price ($974 rent vs $90k).
- Recommended offer: $79k (12.0% below list) — sets the bar for market timing.
- Cap rate 9.2% vs local median 4.7% in St. Joseph — top-decile yield for the area; either an underpriced asset or a hidden risk that comps aren't pricing in. Stress-test before assuming the spread holds.
Location & tenants
- Location reads: area grade C — affects rentability + tenant quality, not the cash-flow math above.
- St. Joseph (urban): math 28% / reading 38% proficiency, ranked #241 of 324 in MO (top 74%) — families likely to look elsewhere, expect single-tenant / working-renter base with shorter leases.
- Market conditions: 89 active listings in the ZIP; 6 comparable units currently listed for rent nearby; rentals lingering (median 44d on market — plan ~5-8 weeks vacancy on turnover, expect pricing pressure); 100% of comp listings sitting > 30 days — soft ceiling on asking rent; 70 units permitted in Buchanan County in 2024 (0 in 5+ unit buildings).
Forward outlook
- Local home prices are declining (-3.0%/yr); year-one equity from $622 of loan paydown is wiped out by about $3k of value loss. Plan a longer hold.
- Buchanan County population projected to shrink 6% by 2050 — rents likely to lag national; underwrite the cash flow, not the appreciation.
Negotiation context
- It's been on market 137 days — a 12% lower offer ($79k) is reasonable based on typical stale-listing flexibility.
- 3 sale attempts since 7y ago with the ask held roughly flat each time — persistent listings suggest the price (not the market) is what's stuck; bring a comps-based counter.
Risks & watch-outs
- Watch-outs: built in 1917 — expect roof / HVAC / electrical / plumbing capex.
Questions for the listing agent
- It's been on market 137 days. Have you received any prior offers? Is the seller open to a 12% concession, seller financing, or rate buy-down credit?
- Built in 1917 — when were the roof, HVAC, electrical panel, plumbing, and water heater last replaced?
- Why hasn't it sold? Are there any deal-killer items the seller is aware of (foundation, flood, title, zoning, code violations)?
- Is there a deadline driving the sale (1031 exchange, divorce, estate, relocation)? That informs how much negotiation room exists.
- What's the average days-on-market for RENTAL listings here right now (not sales)? A rising rental-DOM trend means longer vacancies and softer asking-rent achievability than the comps imply.
- What's the recent tenant-quality profile in this submarket — average credit score on applications, eviction rate, late-payment / NSF rate, and stable-employment percentage? A property-management company in the area should have these aggregated.
- How much new for-sale + rental construction is in the pipeline within 1–3 miles? Heavy new supply typically softens prices + rents 12–24 months out; constrained supply supports both.
Investment metrics
- 1% rule
- 1.08% ✓
- Cap rate
- 9.24%
- Cash-on-cash
- 10.52%
- DSCR
- 1.47
- GRM
- 7.7
CMA / ARV
- ARV (median comp)
- $81,278
- List price
- $90,000
- Delta
- 10.73%
- Verdict
- OVERPRICED
- Comps
- 20 within 1.0 mi
Show comp detail 12 sales within ~0.75 mi
| Address | Dist | Beds/Ba | Sqft | Sold | Price | $/sf | Match |
|---|---|---|---|---|---|---|---|
| 2819 S 22nd St | 0.34mi | 2/1.0 | 1,241 (+6%) | 5mo | $109,900 | $89 | 70 |
| 2601 Commercial St | 0.57mi | 2/1.0 | 1,212 (+3%) | 3mo | $169,000 | $139 | 66 |
| 2306 S 19th St | 0.40mi | 3/1.0 (+1) | 1,280 (+9%) | 2mo | $118,900 | $93 | 60 |
| 2423 S 17th St | 0.26mi | 2/1.0 | 1,024 (-13%) | 10mo | $119,000 | $116 | 58 |
| 2314 S 19th St | 0.39mi | 2/1.0 | 1,064 (-9%) | 11mo | $79,000 | $74 | 57 |
| 3022 S 19th St | 0.24mi | 1/1.0 (-1) | 1,036 (-12%) | 11mo | $47,500 | $46 | 55 |
| 2326 South 19th St | 0.36mi | 2/1.0 | 1,336 (+14%) | 7mo | $129,000 | $97 | 54 |
| 725 E Lake Blvd | 0.70mi | 2/1.0 | 1,162 (-1%) | 18mo | $150,000 | $129 | 51 |
| 3209 S 22nd St | 0.50mi | 2/1.0 | 999 (-15%) | 18mo | $70,000 | $70 | 37 |
| 1816 S 20th St | 0.74mi | 2/2.0 | 1,020 (-13%) | 8mo | $165,000 | $162 | 33 |
| 1821 Scott St | 0.65mi | 3/1.5 (+1) | 1,345 (+15%) | 10mo | $199,900 | $149 | 30 |
| 2404 Shirley Dr | 0.71mi | 3/2.5 (+1) | 1,300 (+11%) | 13mo | $257,000 | $198 | 28 |
Match score weights: distance 35% · size 25% · config 20% · recency 20%. Top-matched comps best support the ARV.
Projected returns pro-forma
-3.0% appreciation · 3.0% rent growth · sell at horizon
- IRR
- -0.6%
- Equity multiple
- 0.98×
- Total profit
- $-549
- Equity at exit
- $13,419
- IRR
- 9.1%
- Equity multiple
- 1.69×
- Total profit
- $17,510
- Equity at exit
- $7,782
Cash invested: $25,200 (down + closing). Projections, not guarantees.
Landlord ↔ Tenant lean methodology
- Overall (STATE)
- 81 Strongly Landlord-Friendly
- State Missouri
- 81 Strongly Landlord-Friendly · R+10
- County
- — inherits STATE
- City
- — inherits STATE
ZIP-level market 64503
- Active inventory
- 89
- Price-to-rent
- 7.7×
Monthly cashflow live
- Estimated rent
- $974 high interval (Pro) →
- Mortgage (P&I)
- −$472
- Tax from tax record
- −$39 /mo · $466/yr
- Insurance
- −$38
- HOA
- −$0
- Vacancy / Maint / Mgmt
- −$204
- Net cashflow
- $221
Break-even live
UW: 25.0% down · 7.5% · 30yr · 1.5% tax · 5.0% vac · 8.0% maint · 8.0% mgmt
Financing live
Cash to close
- Down payment
- $22,500
- Closing costs
- $2,700
- Reserves months
- —
- Total cash needed
- —
Loan-product check · same deal, 3 products live
Conventional
25% down · 7.5% · 30yr
- Down + closing
- —
- Monthly P&I
- —
- Monthly cashflow
- —
- DSCR
- —
- Eligible?
- —
Personal DTI + credit; lowest rate.
DSCR
20% down · 8.5% · 30yr
- Down + closing
- —
- Monthly P&I
- —
- Monthly cashflow
- —
- DSCR
- —
- Eligible?
- —
No personal income docs; deal must DSCR.
Hard money
10% down · 12.0% · 12mo
- Down + closing
- —
- Monthly P&I
- —
- Monthly cashflow
- —
- DSCR
- —
- Eligible?
- —
Short-term bridge; refi at stabilization.
Rent comps 6 comps
| Address | Beds | Baths | Sqft | Rent | $/sqft | DOM | Units | Dist |
|---|---|---|---|---|---|---|---|---|
| 2219 S 10th St Saint Joseph, MO | 2.0 | 1.0 | 800 | $900 | $1.12 | 44d | 1 | 0.60mi |
| 1616 S 25th St Saint Joseph, MO | 3.0 | 1.0 | 1500 | $1,300 | $0.87 | 44d | 1 | 0.96mi |
| 1300 S 11th St Apt 605 St Joseph, MO | 2.0 | 2.0 | 1141 | $940 | $0.82 | 44d | 1 | 1.10mi |
| 1300 S 11th St Apt 22 St Joseph, MO | 2.0 | 1.0 | 866 | $998 | $1.15 | 44d | 1 | 1.10mi |
| 1300 S 11th St Apt 603 St Joseph, MO | 2.0 | 2.0 | 1176 | $910 | $0.77 | 44d | 1 | 1.10mi |
| 1106 Olive St Saint Joseph, MO | 2.0 | 1.0 | 700 | $725 | $1.04 | 44d | 1 | 1.34mi |
Listing history 15 events
-
2026-06-09days on market $90,000 Active 137 DOM
-
2026-06-08days on market $90,000 Active 136 DOM
-
2026-06-07days on market $90,000 Active 135 DOM
-
2026-06-03days on market $90,000 Active 131 DOM
-
2026-06-02days on market $90,000 Active 130 DOM
-
2026-06-01days on market $90,000 Active 129 DOM
-
2026-05-31days on market $90,000 Active 128 DOM
-
2026-05-30days on market $90,000 Active 127 DOM
-
2026-01-23$90,000 Active 290-char remark
Show marketing remark (290 chars)
Attention investors! This two bedroom, one bathroom home features updated luxury vinyl plank, hardwood floors, and carpet. Laundry hook-ups are available in the mudroom. The home is currently occupied by long-term tenants. This turn-key property will make a great addition to any portfolio!
-
2025-03-29historical
-
2024-12-08$85,000 Active
-
2023-06-19historical
-
2019-02-27soldstatus
-
2019-02-04$17,900
-
2003-06-27soldstatus
ⓘ Source: listings_history table (triggers on properties + properties_extension) + one-shot
backfill from property_details.listing_events for pre-trigger history.
Tax reassessment forecast MO · Resets to sale price
- Current annual tax
- $466 · $39/mo
- Projected year-2 tax
- $873 · $73/mo
- Expected delta
- +$407/yr (+$34/mo · 87.4%)
ⓘ Screening estimate from a state-policy table — verify with the county assessor before closing.
Climate risk First Street
- Flood 1/10 Low FEMA zone X · 0% chance over 30 yrs
- Wildfire 2/10 Low
- Heat 4/10 Moderate 7 d/yr ≥106°F today · 16 d/yr by 30 yrs out
- Wind 2/10 Low
- Air quality 2/10 Low 1 unhealthy d/yr today · 2 by 30 yrs out
Nearby sold comps map
Loading sold comps map…
Walkable amenities ~0.75 mi
Loading nearby amenities…
Taxation est. · year 1
- Rental income
- $11,683
- − Mortgage interest
- −$5,041
- − Property taxes
- −$466
- − Insurance
- −$450
- − Repairs & maintenance
- −$935
- − Management
- −$935
- − Depreciation
- −$2,618
- Taxable income
- $1,238
- Est. tax owed @ 24.0%
- −$297
- After-tax cash flow
- $2,353/yr
For passive investors: Depreciation is non-cash, so a rental often shows a tax loss while cash-flowing — sheltering income. Rental losses are passive: they offset passive income freely, and up to $25,000/yr can offset ordinary (W-2) income if you actively participate and your MAGI is under $100k (phasing out to $0 by $150k); unused losses carry forward. On sale, claimed depreciation is recaptured at up to 25%, and gains may owe capital-gains tax (a 1031 exchange can defer both). Figures are a year-1 estimate at your 24.0% rate — not tax advice; consult a CPA.
Schools (NCES district)
- District
- St. Joseph
- NCES district ID
- 2927060
- Math proficiency
- 28% ▼ -6.00%
- Reading proficiency
- 38% ▼ -1.00%
- Median HH income
- $43,007
- Composite
- 27.99/100
- National rank
- #6853
- State rank
- #241 of 324 in MO
Livability — St. Joseph
No livability data for this city. (Only ~50 U.S. cities are tracked.)
Census & demographics
- Census place
- St. Joseph, MO
- City population
- 44,382
- Population (ZIP)
- 11,921
Population outlook (Buchanan County) Hauer SSP2
- Today (2025)
- 89,041 people
- By 2030
- 88,401 · -0.7%
- By 2040
- 86,220 · -3.2%
- By 2050
- 83,603 · -6.1%
- By 2075
- 76,750 · -13.8%
- By 2100
- 67,623 · -24.1%
Race, ethnicity, and origin ACS 2023
- Neighborhood character
- Predominantly White (85%)
- Race & ethnicity
- White 85% Two or more races 8% Hispanic / Latino 6% Black 3% Asian 1%
- Hispanic origin (detail)
- Mexican 4% Cuban 1%
- Common ancestry
- Romanian 2% Lithuanian 2% Slovak 1%
- Foreign-born
- 3% · Canada
- Languages at home
- 96% English-only · Spanish 2% Other Indo-European 1%
Political lean MEDSL · Buchanan
- 2024 margin
- Strong R (+28.0) · D 35.2% · R 63.3% · Other 1.5%
- 2008→2024 swing
- -28.2pp toward R · 2008: 0.1pp · 2024: -28.0pp
- All cycles
- 2024: R+28.0 2020: R+24.6 2016: R+26.2 2012: R+8.7 2008: D+0.1
Not yet ingested
- Civics
- —
Market trends
- HPI YoY
- ▼ -128.03%
- Current HPI
- 185.3921
- Rent YoY
- —
- Metro
- —
- State GDP YoY
- ▲ 1.84%
- F500 in state
- 20
Industry mix (Fortune 500 HQ in MO)
| Industry | F500 HQs | Revenue |
|---|---|---|
| Healthcare | 1 | $163B |
|
||
| Insurance | 1 | $21B |
|
||
| Industrial Technology | 1 | $17B |
|
||
| Retail | 1 | $16B |
|
||
| Industrial Distribution | 1 | $10B |
|
||
| Utilities | 1 | $9B |
|
||
Price history
+402.8% since first listed7 events — show timeline
- 2026-01-23 Listed $90,000 Heartland MLS as Distributed by MLS Grid
- 2025-03-29 Listing Removed — Heartland MLS as Distributed by MLS Grid
- 2024-12-08 Listed $85,000 Heartland MLS as Distributed by MLS Grid
- 2023-06-19 Rental Removed — APPFOLIO
- 2019-02-27 Sold (MLS) — Heartland MLS as Distributed by MLS Grid
- 2019-02-04 Listed $17,900 Heartland MLS as Distributed by MLS Grid
- 2003-06-27 Sold (Public Records) — Public Records
Property tax history
+1.4%/yrLatest (2025): $466 · +5.2% YoY. Source: county tax records.
Cash-flow waterfall
monthlySold comps — $/sqft
last 12 mo · ≤1 miLoading sold comps…