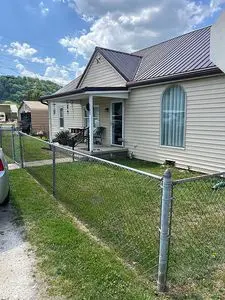
102 W 2nd Ave · South Shore, KY
Flood risk 5/10 · Moderate
- FEMA flood zone
- X (shaded)
- Chance of flooding over 30 yrs
- 0.24%
- Est. flood insurance / yr
- $507 – $1,088
Fire risk 5/10 · Moderate
- Est. fire insurance / yr
- $839 – $1,559
Heat risk 5/10 · Moderate
- Hot days now (above 102°F)
- 7 days/yr
- Hot days in 30 yrs
- 19 days/yr
Wind risk 2/10 · Minimal
- Chance of severe wind over 30 yrs
- 2.0%
Air-quality risk 2/10 · Minimal
- Unhealthy air days now
- 0 days/yr
- Unhealthy air days in 30 yrs
- 1 days/yr
Risk factors via First Street. Map © Google.
Why this score? — see what drove the C grade
The composite is a weighted blend of 9 inputs, each scored 0–100. Each bar is that input's sub-score; the figure is the points it added to the 100-point composite (weight × sub-score).
- Cash flow +21.3/30.0
- ARV discount +7.5/15.0
- DSCR +6.8/10.0
- Appreciation +5.9/10.0
- 1% rule +4.6/10.0
- Livability +3.8/5.0
- Rent growth +2.5/5.0
- Condition / age +2.5/5.0
- Schools +2.4/10.0
$99,000
🖨 Deal sheet (PDF) 📄 Offer letter ✓ Due diligence
Listing remarks
1 1/2 story single family home, 3 bedrooms, 2 full baths, living room, kitchen and laundry room on first floor. Upstairs finished with 2 rooms. 2 car detached garage, detached carport, fenced in yard. Nice front porch and small deck outback. Master bedroom has walk-in closet and vaulted ceiling. One bathroom is handicap equipped.
Key facts
- Built 2013
- Listed 31 days
Neighborhood map
What this means for you Summary
Snapshot
- This is a 3-bed/2.0-bath single-family listed at $99k.
Deal economics
- At list price, monthly cash flow is $145 ($2k/yr) — positive.
- The deal already cash-flows at list — no discount required.
- To meet the 1% rule (rent ≥ 1% of price), the offer needs to be $95k (4.4% below list).
- Recommended offer: $95k (4.4% below list) — sets the bar for 1% rule.
Location & tenants
- Location reads 76/100 on livability (#89 in KY, #3,524 nationally) — a middle-class / working-renter tenant base. Strengths: crime A+, cost of living A+, health & safety A+; Watch: commute D+, schools D, amenities F.
- Greenup County (suburban): math 23% / reading 35% proficiency, ranked #118 of 165 in KY (top 72%) — low school quality limits family demand, transient renter base, plan for 1-2y turnover.
- Market conditions: 15 active listings in the ZIP; 20 units permitted in Greenup County in 2024 (0 in 5+ unit buildings).
Forward outlook
- In year one you build about $2k of equity ($684 loan paydown + $2k appreciation (1.7% local appreciation)).
- Greenup County population projected at -19% by 2050 — secular population decline; favor cash flow + early exit over multi-decade hold.
- At projected returns (1.7% appreciation + 3.0% rent growth), your $28k cash investment doubles in ~6 years — after that, you're playing with house money.
Negotiation context
- It's been on market 31 days — a 3% lower offer ($96k) is reasonable based on typical stale-listing flexibility.
- 2 sale attempts since 3y ago with the ask held roughly flat each time — persistent listings suggest the price (not the market) is what's stuck; bring a comps-based counter.
Risks & watch-outs
- Climate carrying-cost: moderate flood risk; moderate wildfire risk; extreme-heat days projected 7→19/yr by 2055 (HVAC capex compounding) — expect insurance premiums to compound above CPI over the hold.
Questions for the listing agent
- It's been on market 31 days. Have you received any prior offers? Is the seller open to a 4% concession, seller financing, or rate buy-down credit?
- Is there a deadline driving the sale (1031 exchange, divorce, estate, relocation)? That informs how much negotiation room exists.
- Schools are D-rated, which usually means shorter tenancies and higher turnover. Who's the typical renter profile here, and what's been the actual vacancy rate?
- What's the average days-on-market for RENTAL listings here right now (not sales)? A rising rental-DOM trend means longer vacancies and softer asking-rent achievability than the comps imply.
- What's the recent tenant-quality profile in this submarket — average credit score on applications, eviction rate, late-payment / NSF rate, and stable-employment percentage? A property-management company in the area should have these aggregated.
- How much new for-sale + rental construction is in the pipeline within 1–3 miles? Heavy new supply typically softens prices + rents 12–24 months out; constrained supply supports both.
Investment metrics
- 1% rule
- 0.96% ✗
- Cap rate
- 8.05%
- Cash-on-cash
- 6.27%
- DSCR
- 1.28
- GRM
- 8.7
CMA / ARV
No comps found within radius.
Projected returns pro-forma
1.74% appreciation · 3.0% rent growth · sell at horizon
- IRR
- 10.0%
- Equity multiple
- 1.53×
- Total profit
- $14,696
- Equity at exit
- $37,690
- IRR
- 13.2%
- Equity multiple
- 2.72×
- Total profit
- $47,765
- Equity at exit
- $53,250
Cash invested: $27,720 (down + closing). Projections, not guarantees.
Landlord ↔ Tenant lean methodology
- Overall (STATE)
- 83 Strongly Landlord-Friendly
- State Kentucky
- 83 Strongly Landlord-Friendly · R+16
- County
- — inherits STATE
- City
- — inherits STATE
ZIP-level market 41175
- Home prices YoY
- 0.8%
- Active inventory
- 15
- Price-to-rent
- 8.7×
Monthly cashflow live
- Estimated rent
- $947 medium interval (Pro) →
- Mortgage (P&I)
- −$519
- Tax from tax record
- −$43 /mo · $513/yr
- Insurance
- −$41
- HOA
- −$0
- Vacancy / Maint / Mgmt
- −$199
- Net cashflow
- $145
Break-even live
Sensitivity live
| Price | -10% $201 | -5% $173 | +0% $145 | +5% $117 | +10% $89 |
|---|---|---|---|---|---|
| Rent | -10% $70 | -5% $107 | +0% $145 | +5% $182 | +10% $220 |
| Rate | -1.0pp $195 | -0.5pp $170 | base $145 | +0.5pp $119 | +1.0pp $93 |
UW: 25.0% down · 7.5% · 30yr · 1.5% tax · 5.0% vac · 8.0% maint · 8.0% mgmt
Financing live
Cash to close
- Down payment
- $24,750
- Closing costs
- $2,970
- Reserves months
- —
- Total cash needed
- —
Loan-product check · same deal, 3 products live
Conventional
25% down · 7.5% · 30yr
- Down + closing
- —
- Monthly P&I
- —
- Monthly cashflow
- —
- DSCR
- —
- Eligible?
- —
Personal DTI + credit; lowest rate.
DSCR
20% down · 8.5% · 30yr
- Down + closing
- —
- Monthly P&I
- —
- Monthly cashflow
- —
- DSCR
- —
- Eligible?
- —
No personal income docs; deal must DSCR.
Hard money
10% down · 12.0% · 12mo
- Down + closing
- —
- Monthly P&I
- —
- Monthly cashflow
- —
- DSCR
- —
- Eligible?
- —
Short-term bridge; refi at stabilization.
Listing history 21 events
-
2026-06-21days on market $99,000 Active 31 DOM
-
2026-06-18days on market $99,000 Active 29 DOM
-
2026-06-17days on market $99,000 Active 28 DOM
-
2026-06-16days on market $99,000 Active 27 DOM
-
2026-06-15days on market $99,000 Active 26 DOM
-
2026-06-13days on market $99,000 Active 24 DOM
-
2026-06-12days on market $99,000 Active 23 DOM
-
2026-06-09days on market $99,000 Active 20 DOM
-
2026-06-08days on market $99,000 Active 19 DOM
-
2026-06-07days on market $99,000 Active 18 DOM
-
2026-06-07days on market $99,000 Active 17 DOM
-
2026-06-04days on market $99,000 Active 14 DOM
-
2026-06-02days on market $99,000 Active 13 DOM
-
2026-06-01days on market $99,000 Active 12 DOM
-
2026-05-31days on market $99,000 Active 11 DOM
-
2026-05-31days on market $99,000 Active 10 DOM
-
2026-05-21$99,000 Active
-
2023-11-15price $110,000
-
2023-10-03price $125,000
-
2023-07-13price $135,000
-
2023-06-15$139,900 Active
ⓘ Source: listings_history table (triggers on properties + properties_extension) + one-shot
backfill from property_details.listing_events for pre-trigger history.
Tax reassessment forecast KY · Resets to sale price
- Current annual tax
- $513 · $43/mo
- Projected year-2 tax
- $851 · $71/mo
- Expected delta
- +$338/yr (+$28/mo · 66.0%)
ⓘ Screening estimate from a state-policy table — verify with the county assessor before closing.
Climate risk First Street
- Flood 5/10 Major FEMA zone X (shaded) · 24% chance over 30 yrs
- Wildfire 5/10 Major
- Heat 5/10 Major 7 d/yr ≥102°F today · 19 d/yr by 30 yrs out
- Wind 2/10 Low 2% chance of damaging wind over 30 yrs
- Air quality 2/10 Low 0 unhealthy d/yr today · 1 by 30 yrs out
Nearby sold comps map
Loading sold comps map…
Walkable amenities ~0.75 mi
Loading nearby amenities…
Taxation est. · year 1
- Rental income
- $11,361
- − Mortgage interest
- −$5,546
- − Property taxes
- −$513
- − Insurance
- −$495
- − Repairs & maintenance
- −$909
- − Management
- −$909
- − Depreciation
- −$2,880
- Taxable income
- $110
- Est. tax owed @ 24.0%
- −$26
- After-tax cash flow
- $1,711/yr
For passive investors: Depreciation is non-cash, so a rental often shows a tax loss while cash-flowing — sheltering income. Rental losses are passive: they offset passive income freely, and up to $25,000/yr can offset ordinary (W-2) income if you actively participate and your MAGI is under $100k (phasing out to $0 by $150k); unused losses carry forward. On sale, claimed depreciation is recaptured at up to 25%, and gains may owe capital-gains tax (a 1031 exchange can defer both). Figures are a year-1 estimate at your 24.0% rate — not tax advice; consult a CPA.
Schools (NCES district)
- District
- Greenup County
- NCES district ID
- 2102400
- Math proficiency
- 23% ▼ -19.00%
- Reading proficiency
- 35% ▼ -18.00%
- Median HH income
- $39,526
- Composite
- 24.33/100
- National rank
- #7702
- State rank
- #118 of 165 in KY
Livability — South Shore
- Score
- 76/100
- State rank
- #89
- US rank
- #3524
Category grades
Schools grade is shown separately in the Schools card above.
Census & demographics
- Census place
- South Shore, KY
- County
- Greenup · 24,497 people
- Metro
- Huntington-Ashland, WV-KY-OH
- Population (ZIP)
- 5,612
- Household income
- $48,681
- Rent vs Own
- Severe rent burden
- 10.4
Population outlook (Greenup County) Hauer SSP2
- Today (2025)
- 34,374 people
- By 2030
- 33,145 · -3.6%
- By 2040
- 30,407 · -11.5%
- By 2050
- 27,702 · -19.4%
- By 2075
- 21,970 · -36.1%
- By 2100
- 16,670 · -51.5%
Race, ethnicity, and origin ACS 2023
- Neighborhood character
- Predominantly White (97%)
- Race & ethnicity
- White 97% Two or more races 3% Hispanic / Latino 1%
- Common ancestry
- Slovak 5% Greek 1% Lithuanian 1%
- Foreign-born
- 1% · Canada
- Languages at home
- 99% English-only · Spanish 1%
Political lean MEDSL · Greenup
- 2024 margin
- Solid R (+50.5) · D 24.1% · R 74.6% · Other 1.3%
- 2008→2024 swing
- -36.4pp toward R · 2008: -14.1pp · 2024: -50.5pp
- All cycles
- 2024: R+50.5 2020: R+45.1 2016: R+45.5 2012: R+18.6 2008: R+14.1
Not yet ingested
- Civics
- —
Market trends
- HPI YoY
- ▲ 1.74%
- Current HPI
- 208.0953
- Rent YoY
- —
- Metro
- —
- State GDP YoY
- ▲ 1.81%
- F500 in state
- 4
Industry mix (Fortune 500 HQ in KY)
| Industry | F500 HQs | Revenue |
|---|---|---|
| Healthcare | 1 | $118B |
|
||
| Food / Beverage | 1 | $7B |
|
||
Price history
-29.2% since first listed5 events — show timeline
- 2026-05-21 Listed $99,000 FSBO.com
- 2023-11-15 Price Changed $110,000 AABOR
- 2023-10-03 Price Changed $125,000 AABOR
- 2023-07-13 Price Changed $135,000 AABOR
- 2023-06-15 Listed $139,900 AABOR
Cash-flow waterfall
monthlySold comps — $/sqft
last 12 mo · ≤1 miLoading sold comps…