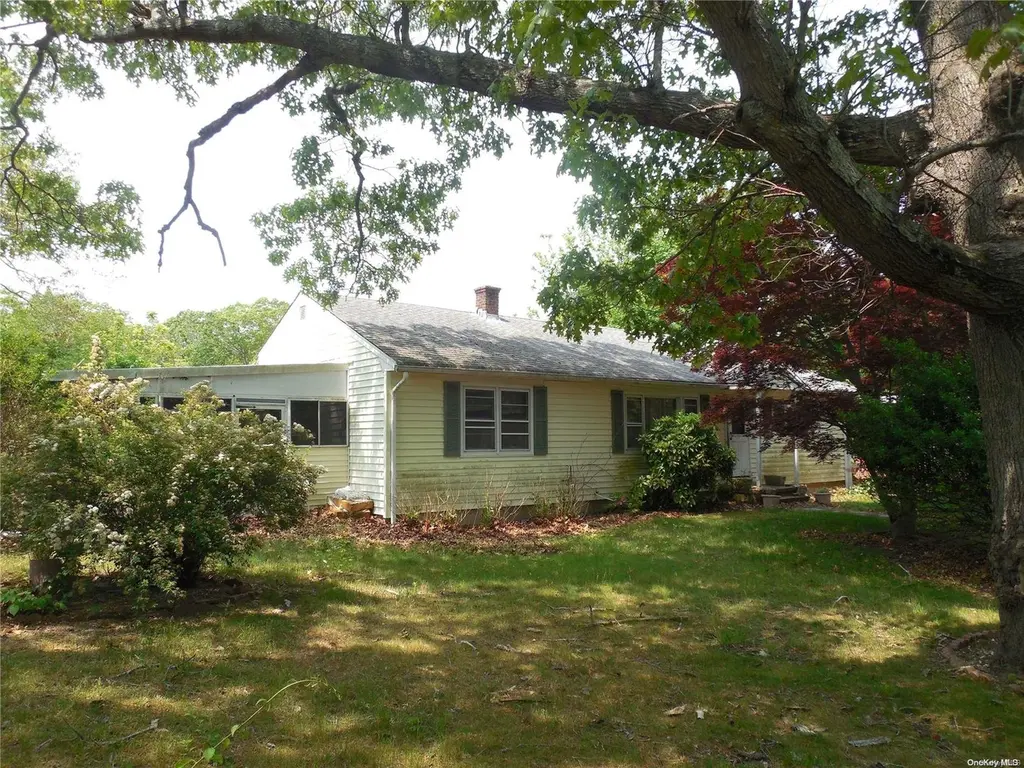
375 Factory Ave · Mattituck, NY
Flood risk 7/10 · Major
- FEMA flood zone
- X (unshaded)
- Chance of flooding over 30 yrs
- 0.77%
- Est. flood insurance / yr
- $473 – $860
Fire risk 2/10 · Minimal
- Est. fire insurance / yr
- $691 – $1,283
Heat risk 5/10 · Moderate
- Hot days now (above 91°F)
- 7 days/yr
- Hot days in 30 yrs
- 19 days/yr
Wind risk 8/10 · Major
- Chance of severe wind over 30 yrs
- 80.0%
Air-quality risk 3/10 · Minor
- Unhealthy air days now
- 2 days/yr
- Unhealthy air days in 30 yrs
- 3 days/yr
Risk factors via First Street. Map © Google.
Why this score? — see what drove the C- grade
The composite is a weighted blend of 9 inputs, each scored 0–100. Each bar is that input's sub-score; the figure is the points it added to the 100-point composite (weight × sub-score).
- ARV discount +15.0/15.0
- Cash flow +14.0/30.0
- Schools +6.1/10.0
- 1% rule +4.5/10.0
- DSCR +4.2/10.0
- Livability +3.5/5.0
- Rent growth +2.5/5.0
- Condition / age +2.5/5.0
- Appreciation +0.0/10.0
$450,000
🖨 Deal sheet (PDF) 📄 Offer letter ✓ Due diligence
Listing remarks
This is a Part 36 Property that Requires Court Approval on All Offers and Sold "AS-IS". Must fill out "Release & Hold Harmless Agreement" prior to all appointments. Cute 2 Bedroom - 1 Bath Ranch which Needs TLC, Living Room, with Oak Floors, EIK with Ding Area, Den, 3 Season Porch, Full Basement with Inside & Outside Entrances, Circular Driveway & Carport. , Additional information: Appearance:Poor, Separate Hotwater Heater:yes
Key facts
- 0.5 acre lot
- Built 1965
- Listed 77 days
Neighborhood map
What this means for you Summary
Snapshot
- This is a 2-bed/1.0-bath single-family listed at $450k.
Deal economics
- At list price, monthly cash flow is $-1 ($-8/yr) — negative.
- To cash-flow at today's rent, offer at most $450k (0.0% below list).
- To meet the 1% rule (rent ≥ 1% of price), the offer needs to be $426k (5.4% below list).
- Recommended offer: $423k (6.0% below list) — sets the bar for market timing.
- Cap rate 6.4% vs local median 4.0% in Mattituck — top-decile yield for the area; either an underpriced asset or a hidden risk that comps aren't pricing in. Stress-test before assuming the spread holds.
Location & tenants
- Location reads 70/100 on livability (#461 in NY) — a middle-class / working-renter tenant base. Strengths: crime A+, employment A+, health & safety B+; Watch: housing C-, amenities F, commute F.
- Mattituck-Cutchogue Union Free School District (suburban): math 69% / reading 68% proficiency, ranked #127 of 590 in NY (top 22%) — acceptable for families but not a draw, mixed tenant base, ~2y average lease; only 16% free/reduced lunch — higher-income household profile.
- Zoned schools: Mattituck-Cutchogue Elementary School (math 65% / reading 68%, grade B+, #575 of 2,108 statewide, top 27%, 453 students, 37% FRL); Mattituck Junior-Senior High School (math 74% / reading 72%, grade B+, #670 of 1,100 statewide, top 61%, 548 students, 0% FRL) — zoned schools at 18% FRL track the district average.
- Market conditions: 49 active listings in the ZIP; 1,366 units permitted in Suffolk County in 2024 (216 in 5+ unit buildings).
Forward outlook
- Local home prices are declining (-3.0%/yr); year-one equity from $3k of loan paydown is wiped out by about $14k of value loss. Plan a longer hold.
- Suffolk County population projected to shrink 5% by 2050 — rents likely to lag national; underwrite the cash flow, not the appreciation.
Negotiation context
- It's been on market 77 days — a 6% lower offer ($423k) is reasonable based on typical stale-listing flexibility.
Risks & watch-outs
- Watch-outs: flood insurance adds $56/mo.
- Climate carrying-cost: major flood risk; severe wind risk, 80% chance of damaging wind over 30y; extreme-heat days projected 7→19/yr by 2055 (HVAC capex compounding) — expect insurance premiums to compound above CPI over the hold.
Questions for the listing agent
- What do current leases actually rent for vs. the listed asking? Can we see a recent rent roll and the last 12 months of T-12 income?
- It's been on market 77 days. Have you received any prior offers? Is the seller open to a 6% concession, seller financing, or rate buy-down credit?
- Built in 1965 — when were the roof, HVAC, electrical panel, plumbing, and water heater last replaced?
- What's the actual annual flood-insurance premium (NFIP or private), and is the property in a SFHA with mandatory coverage?
- Why hasn't it sold? Are there any deal-killer items the seller is aware of (foundation, flood, title, zoning, code violations)?
- Is there a deadline driving the sale (1031 exchange, divorce, estate, relocation)? That informs how much negotiation room exists.
- Schools are A-rated — typically a magnet for longer-tenancy family renters. What's the average tenant stay here, and is there a school-zone premium baked into asking?
- What's the average days-on-market for RENTAL listings here right now (not sales)? A rising rental-DOM trend means longer vacancies and softer asking-rent achievability than the comps imply.
- What's the recent tenant-quality profile in this submarket — average credit score on applications, eviction rate, late-payment / NSF rate, and stable-employment percentage? A property-management company in the area should have these aggregated.
- How much new for-sale + rental construction is in the pipeline within 1–3 miles? Heavy new supply typically softens prices + rents 12–24 months out; constrained supply supports both.
Investment metrics
- 1% rule
- 0.95% ✗
- Cap rate
- 6.44%
- Cash-on-cash
- 0.52%
- DSCR
- 1.02
- GRM
- 8.8
CMA / ARV
- ARV (on-the-fly)
- $742,900
- Comps found
- 4
Show comp detail 4 sales within ~0.75 mi
| Address | Dist | Beds/Ba | Sqft | Sold | Price | $/sf | Match |
|---|---|---|---|---|---|---|---|
| 1295 Sigsbee Rd | 0.33mi | 2/2.0 | 1,100 (-4%) | 7mo | $830,000 | $755 | 67 |
| 10890 Old Sound Ave | 0.24mi | 3/3.0 (+1) | 1,200 (+4%) | 7mo | $550,000 | $458 | 63 |
| 160 Oak St | 0.46mi | 2/2.0 | 1,050 (-9%) | 3mo | $678,375 | $646 | 57 |
| 9450 Old Sound Ave | 0.34mi | 3/1.0 (+1) | 1,298 (+13%) | 1mo | $670,000 | $516 | 56 |
Match score weights: distance 35% · size 25% · config 20% · recency 20%. Top-matched comps best support the ARV.
Projected returns pro-forma
-3.0% appreciation · 3.0% rent growth · sell at horizon
- IRR
- -16.3%
- Equity multiple
- 0.42×
- Total profit
- $-72,739
- Equity at exit
- $67,096
- IRR
- -7.9%
- Equity multiple
- 0.50×
- Total profit
- $-62,499
- Equity at exit
- $38,908
Cash invested: $126,000 (down + closing). Projections, not guarantees.
Landlord ↔ Tenant lean methodology
- Overall (STATE)
- 15 Strongly Tenant-Friendly
- State New York
- 15 Strongly Tenant-Friendly · D+10
- County
- — inherits STATE
- City
- — inherits STATE
ZIP-level market 11952
- Home prices YoY
- -17.2%
- Active inventory
- 49
- Price-to-rent
- 8.8×
Monthly cashflow live
- Estimated rent
- $4,256 medium interval (Pro) →
- Mortgage (P&I)
- −$2,360
- Tax from tax record
- −$760 /mo · $9,120/yr
- Insurance
- −$188
- Flood insurance flood zone
- −$56 /mo · $666/yr
- HOA
- −$0
- Lot rent
- −$0
- Vacancy / Maint / Mgmt
- −$894
- Net cashflow
- $-1
Break-even live
Sensitivity live
| Price | -10% $254 | -5% $127 | +0% $-1 | +5% $-128 | +10% $-255 |
|---|---|---|---|---|---|
| Rent | -10% $-337 | -5% $-169 | +0% $-1 | +5% $167 | +10% $336 |
| Rate | -1.0pp $226 | -0.5pp $114 | base $-1 | +0.5pp $-117 | +1.0pp $-236 |
UW: 25.0% down · 7.5% · 30yr · 1.5% tax · 5.0% vac · 8.0% maint · 8.0% mgmt
Financing live
Cash to close
- Down payment
- $112,500
- Closing costs
- $13,500
- Reserves months
- —
- Total cash needed
- —
Loan-product check · same deal, 3 products live
Conventional
25% down · 7.5% · 30yr
- Down + closing
- —
- Monthly P&I
- —
- Monthly cashflow
- —
- DSCR
- —
- Eligible?
- —
Personal DTI + credit; lowest rate.
DSCR
20% down · 8.5% · 30yr
- Down + closing
- —
- Monthly P&I
- —
- Monthly cashflow
- —
- DSCR
- —
- Eligible?
- —
No personal income docs; deal must DSCR.
Hard money
10% down · 12.0% · 12mo
- Down + closing
- —
- Monthly P&I
- —
- Monthly cashflow
- —
- DSCR
- —
- Eligible?
- —
Short-term bridge; refi at stabilization.
Listing history 2 events
-
2023-08-09status Pending
-
2023-05-24$450,000 Active
ⓘ Source: listings_history table (triggers on properties + properties_extension) + one-shot
backfill from property_details.listing_events for pre-trigger history.
Tax reassessment forecast NY · Partial reset (capped growth)
- Current annual tax
- $9,120 · $760/mo
- Projected year-2 tax
- $9,120 · $760/mo
- Expected delta
- $0/yr ($0/mo · 0.0%)
ⓘ Screening estimate from a state-policy table — verify with the county assessor before closing.
Climate risk First Street
- Flood 7/10 Severe FEMA zone X (unshaded) · 77% chance over 30 yrs
- Wildfire 2/10 Low
- Heat 5/10 Major 7 d/yr ≥91°F today · 19 d/yr by 30 yrs out
- Wind 8/10 Severe 80% chance of damaging wind over 30 yrs
- Air quality 3/10 Moderate 2 unhealthy d/yr today · 3 by 30 yrs out
Nearby sold comps map
Loading sold comps map…
Walkable amenities ~0.75 mi
Loading nearby amenities…
Taxation est. · year 1
- Rental income
- $51,072
- − Mortgage interest
- −$25,207
- − Property taxes
- −$9,120
- − Insurance
- −$2,916
- − Repairs & maintenance
- −$4,086
- − Management
- −$4,086
- − Depreciation
- −$13,091
- Taxable loss
- −$7,434
- Est. tax savings @ 24.0%
- +$1,784
- After-tax cash flow
- $1,777/yr
For passive investors: Depreciation is non-cash, so a rental often shows a tax loss while cash-flowing — sheltering income. Rental losses are passive: they offset passive income freely, and up to $25,000/yr can offset ordinary (W-2) income if you actively participate and your MAGI is under $100k (phasing out to $0 by $150k); unused losses carry forward. On sale, claimed depreciation is recaptured at up to 25%, and gains may owe capital-gains tax (a 1031 exchange can defer both). Figures are a year-1 estimate at your 24.0% rate — not tax advice; consult a CPA.
Schools (NCES district)
- District
- Mattituck-Cutchogue Union Free School District
- NCES district ID
- 3600021
- Math proficiency
- 69% ▼ -3.00%
- Reading proficiency
- 68% ▲ 4.00%
- Median HH income
- $84,164
- Composite
- 61.4/100
- National rank
- #765
- State rank
- #127 of 590 in NY
Livability — Mattituck
- Score
- 70/100
- State rank
- #461
- US rank
- #8015
Category grades
Schools grade is shown separately in the Schools card above.
Census & demographics
- Census place
- Mattituck, NY
- City population
- 4,749
- Population (ZIP)
- 4,749
Population outlook (Suffolk County) Hauer SSP2
- Today (2025)
- 1,505,262 people
- By 2030
- 1,498,318 · -0.5%
- By 2040
- 1,471,101 · -2.3%
- By 2050
- 1,424,848 · -5.3%
- By 2075
- 1,337,157 · -11.2%
- By 2100
- 1,217,720 · -19.1%
Race, ethnicity, and origin ACS 2023
- Neighborhood character
- Predominantly White (92%)
- Race & ethnicity
- White 92% Hispanic / Latino 7% Two or more races 2%
- Hispanic origin (detail)
- Mexican 2%
- Common ancestry
- Romanian 16% Subsaharan African 5% Scotch-Irish 3%
- Foreign-born
- 12% · Canada
- Languages at home
- 84% English-only · Russian/Polish/Slavic 6% Spanish 5% French/Haitian/Cajun 2%
Political lean MEDSL · Suffolk
- 2024 margin
- Lean R (+10.0) · D 45.0% · R 55.0%
- 2008→2024 swing
- -16.0pp toward R · 2008: 6.0pp · 2024: -10.0pp
- All cycles
- 2024: R+10.0 2020: R+0.0 2016: R+8.2 2012: D+2.9 2008: D+6.0
Not yet ingested
- Civics
- —
Market trends
- HPI YoY
- ▼ -94.04%
- Current HPI
- 453.8895
- Rent YoY
- —
- Metro
- —
- State GDP YoY
- ▲ 2.60%
- F500 in state
- 92
Industry mix (Fortune 500 HQ in NY)
| Industry | F500 HQs | Revenue |
|---|---|---|
| Financial Services | 10 | $950B |
|
||
| Consumer Goods | 9 | $162B |
|
||
| Insurance | 4 | $225B |
|
||
| Telecommunications | 2 | $144B |
|
||
| Pharmaceuticals | 2 | $112B |
|
||
| Media / Entertainment | 2 | $69B |
|
||
Price history
2 events — show timeline
- 2023-08-09 Pending — OneKey® MLS as Distributed by MLS Grid
- 2023-05-24 Listed $450,000 OneKey® MLS as Distributed by MLS Grid
Property tax history
+8.2%/yrLatest (2025): $9,120 · +0.0% YoY. Source: county tax records.
Cash-flow waterfall
monthlySold comps — $/sqft
last 12 mo · ≤1 miLoading sold comps…