1164 Bartosh Ln #1 · River Falls, WI
Flood risk 1/10 · Minimal
- FEMA flood zone
- X (unshaded)
- Chance of flooding over 30 yrs
- 0.0%
- Est. flood insurance / yr
- $473 – $860
Fire risk 3/10 · Minor
- Est. fire insurance / yr
- $636 – $1,182
Heat risk 2/10 · Minimal
- Hot days now (above 99°F)
- 7 days/yr
- Hot days in 30 yrs
- 14 days/yr
Wind risk 2/10 · Minimal
- Chance of severe wind over 30 yrs
- —
Air-quality risk 1/10 · Minimal
- Unhealthy air days now
- 0 days/yr
- Unhealthy air days in 30 yrs
- 0 days/yr
Risk factors via First Street. Map © Google.
Why this score? — see what drove the C- grade
The composite is a weighted blend of 9 inputs, each scored 0–100. Each bar is that input's sub-score; the figure is the points it added to the 100-point composite (weight × sub-score).
- Cash flow +18.3/30.0
- ARV discount +7.5/15.0
- 1% rule +5.9/10.0
- DSCR +5.8/10.0
- Livability +4.4/5.0
- Schools +4.1/10.0
- Rent growth +2.8/5.0
- Condition / age +2.5/5.0
- Appreciation +0.0/10.0
$118,900
🖨 Deal sheet 📄 Offer letter ✓ Due diligence
Listing remarks MLS
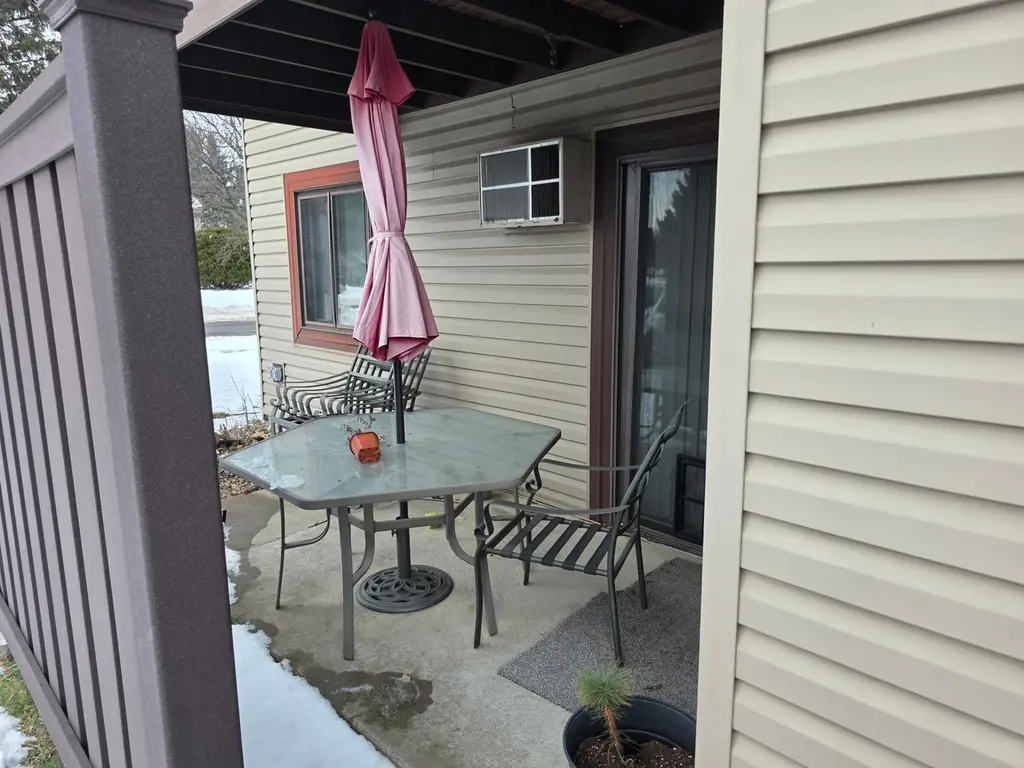
A convenient River Falls location where grocery stores and restaurants are just a short walk away. Close to College campus and rentals are allowed. Tenant has been there 5+ years and willing to stay. Walk out unit. On site parking.
Key facts
- $125 HOA
- Built 1990
- Listed 148 days
Neighborhood map
What this means for you Summary
Snapshot
- This is a 1-bed/1.0-bath condo listed at $119k.
Deal economics
- At list price, monthly cash flow is $110 ($1k/yr) — positive.
- The deal already cash-flows at list — no discount required.
- Meets the 1% rule at list price ($1k rent vs $119k).
- Recommended offer: $105k (12.0% below list) — sets the bar for market timing.
Location & tenants
- Location reads 87/100 on livability (#20 in WI, #322 nationally) — a professional / high-income tenant draw. Strengths: crime A+, amenities A+, housing A+; Watch: commute F.
- River Falls School District (town): math 44% / reading 49% proficiency, ranked #69 of 342 in WI (top 20%) — families likely to look elsewhere, expect single-tenant / working-renter base with shorter leases; only 18% free/reduced lunch — higher-income household profile.
- Market conditions: Rents rising (+1.1%/yr); 138 active listings in the ZIP; solid renter incomes; 191 units permitted in Pierce County in 2024 (0 in 5+ unit buildings).
- This rent is only 16% of the median local income ($97k/yr) — well below the 30% rent-burden line; pricing power to push rent on renewal without tenant pushback.
Forward outlook
- Local home prices are declining (-3.0%/yr); year-one equity from $822 of loan paydown is wiped out by about $4k of value loss. Plan a longer hold.
- Pierce County population projected at -16% by 2050 — secular population decline; favor cash flow + early exit over multi-decade hold.
Negotiation context
- It's been on market 148 days — a 12% lower offer ($105k) is reasonable based on typical stale-listing flexibility.
- 8 sale attempts since 21y ago with the ask held roughly flat each time — persistent listings suggest the price (not the market) is what's stuck; bring a comps-based counter.
Questions for the listing agent
- It's been on market 148 days. Have you received any prior offers? Is the seller open to a 12% concession, seller financing, or rate buy-down credit?
- What does the HOA fee cover, when was the last increase, and are there any pending special assessments or reserve-fund shortfalls?
- Any open or pending special assessments — roof, HVAC, plumbing, elevator, façade? What's the per-unit balance and payoff schedule, and is the seller paying it off at close or rolling it to the buyer?
- Why hasn't it sold? Are there any deal-killer items the seller is aware of (foundation, flood, title, zoning, code violations)?
- Is there a deadline driving the sale (1031 exchange, divorce, estate, relocation)? That informs how much negotiation room exists.
- Schools are A-rated — typically a magnet for longer-tenancy family renters. What's the average tenant stay here, and is there a school-zone premium baked into asking?
- What's the average days-on-market for RENTAL listings here right now (not sales)? A rising rental-DOM trend means longer vacancies and softer asking-rent achievability than the comps imply.
- What's the recent tenant-quality profile in this submarket — average credit score on applications, eviction rate, late-payment / NSF rate, and stable-employment percentage? A property-management company in the area should have these aggregated.
- How much new apartment / multifamily construction is in the pipeline within 1–3 miles? Heavy new supply (>2% of stock underway) typically softens rents 12–24 months out; light construction supports rent growth.
Investment metrics
- 1% rule
- 1.09% ✓
- Cap rate
- 7.40%
- Cash-on-cash
- 3.95%
- DSCR
- 1.18
- GRM
- 7.7
CMA / ARV
No comps found within radius.
Projected returns pro-forma
-3.0% appreciation · 1.13% rent growth · sell at horizon
- IRR
- -12.4%
- Equity multiple
- 0.56×
- Total profit
- $-14,607
- Equity at exit
- $17,728
- IRR
- -6.6%
- Equity multiple
- 0.61×
- Total profit
- $-12,878
- Equity at exit
- $10,280
Cash invested: $33,292 (down + closing). Projections, not guarantees.
Landlord ↔ Tenant lean methodology
- Overall (STATE)
- 73 Landlord-Friendly
- State Wisconsin
- 73 Landlord-Friendly · R+2
- County
- — inherits STATE
- City
- — inherits STATE
ZIP-level market 54022
- Home prices YoY
- -28.3%
- Rents YoY
- 1.1%
- Active inventory
- 138
- Price-to-rent
- 7.7×
Monthly cashflow live
- Estimated rent
- $1,294 medium interval (Pro) →
- Mortgage (P&I)
- −$624
- Tax from tax record
- −$115 /mo · $1,376/yr
- Insurance
- −$50
- HOA
- −$125
- Vacancy / Maint / Mgmt
- −$272
- Net cashflow
- $110
Break-even live
UW: 25.0% down · 7.5% · 30yr · 1.5% tax · 5.0% vac · 8.0% maint · 8.0% mgmt
Financing live
Cash to close
- Down payment
- $29,725
- Closing costs
- $3,567
- Reserves months
- —
- Total cash needed
- —
Loan-product check · same deal, 3 products live
Conventional
25% down · 7.5% · 30yr
- Down + closing
- —
- Monthly P&I
- —
- Monthly cashflow
- —
- DSCR
- —
- Eligible?
- —
Personal DTI + credit; lowest rate.
DSCR
20% down · 8.5% · 30yr
- Down + closing
- —
- Monthly P&I
- —
- Monthly cashflow
- —
- DSCR
- —
- Eligible?
- —
No personal income docs; deal must DSCR.
Hard money
10% down · 12.0% · 12mo
- Down + closing
- —
- Monthly P&I
- —
- Monthly cashflow
- —
- DSCR
- —
- Eligible?
- —
Short-term bridge; refi at stabilization.
HOA detail condo
- Monthly dues
- $125 · $1,500/yr
- Assessments
- None detected in remarks — confirm with the listing agent.
Listing history 29 events
-
2026-06-18days on market $118,900 Active 148 DOM
-
2026-06-17days on market $118,900 Active 147 DOM
-
2026-06-16days on market $118,900 Active 146 DOM
-
2026-06-15days on market $118,900 Active 145 DOM
-
2026-06-13days on market $118,900 Active 143 DOM
-
2026-06-13days on market $118,900 Active 142 DOM
-
2026-06-09days on market $118,900 Active 139 DOM
-
2026-06-08days on market $118,900 Active 138 DOM
-
2026-06-07days on market $118,900 Active 137 DOM
-
2026-06-04days on market $118,900 Active 134 DOM
-
2026-06-03days on market $118,900 Active 133 DOM
-
2026-06-02days on market $118,900 Active 132 DOM
-
2026-06-01days on market $118,900 Active 131 DOM
-
2026-05-31days on market $118,900 Active 130 DOM
-
2026-05-01status Active 233-char remark
Show marketing remark (233 chars)
A convenient River Falls location where grocery stores and restaurants are just a short walk away. Close to College campus and rentals are allowed. Tenant has been there 5+ years and willing to stay. Walk out unit. On site parking.
-
2026-04-19historical Contingent - Other 233-char remark
Show marketing remark (233 chars)
A convenient River Falls location where grocery stores and restaurants are just a short walk away. Close to College campus and rentals are allowed. Tenant has been there 5+ years and willing to stay. Walk out unit. On site parking.
-
2026-01-30status Active 233-char remark
Show marketing remark (233 chars)
A convenient River Falls location where grocery stores and restaurants are just a short walk away. Close to College campus and rentals are allowed. Tenant has been there 5+ years and willing to stay. Walk out unit. On site parking.
-
2025-12-21status Pending 233-char remark
Show marketing remark (233 chars)
A convenient River Falls location where grocery stores and restaurants are just a short walk away. Close to College campus and rentals are allowed. Tenant has been there 5+ years and willing to stay. Walk out unit. On site parking.
-
2025-12-11$118,900 Active 233-char remark
Show marketing remark (233 chars)
A convenient River Falls location where grocery stores and restaurants are just a short walk away. Close to College campus and rentals are allowed. Tenant has been there 5+ years and willing to stay. Walk out unit. On site parking.
-
2011-10-06historical
-
2010-02-05$56,900
-
2010-02-04historical
-
2009-04-19$52,900
-
2009-04-15historical
-
2008-05-21$64,900
-
2008-05-09historical
-
2007-11-20$64,900
-
2007-09-30historical
-
2005-03-15$64,900
ⓘ Source: listings_history table (triggers on properties + properties_extension) + one-shot
backfill from property_details.listing_events for pre-trigger history.
Tax reassessment forecast WI · Partial reset (capped growth)
- Current annual tax
- $1,376 · $115/mo
- Projected year-2 tax
- $1,788 · $149/mo
- Expected delta
- +$412/yr (+$34/mo · 29.9%)
ⓘ Screening estimate from a state-policy table — verify with the county assessor before closing.
Climate risk First Street
- Flood 1/10 Low FEMA zone X (unshaded) · 0% chance over 30 yrs
- Wildfire 3/10 Moderate
- Heat 2/10 Low 7 d/yr ≥99°F today · 14 d/yr by 30 yrs out
- Wind 2/10 Low
- Air quality 1/10 Low 0 unhealthy d/yr today · 0 by 30 yrs out
Nearby sold comps map
Loading sold comps map…
Walkable amenities ~0.75 mi
Loading nearby amenities…
Taxation est. · year 1
- Rental income
- $15,528
- − Mortgage interest
- −$6,660
- − Property taxes
- −$1,376
- − Insurance
- −$594
- − Repairs & maintenance
- −$1,242
- − Management
- −$1,242
- − HOA
- −$1,500
- − Depreciation
- −$3,459
- Taxable loss
- −$546
- Est. tax savings @ 24.0%
- +$131
- After-tax cash flow
- $1,445/yr
For passive investors: Depreciation is non-cash, so a rental often shows a tax loss while cash-flowing — sheltering income. Rental losses are passive: they offset passive income freely, and up to $25,000/yr can offset ordinary (W-2) income if you actively participate and your MAGI is under $100k (phasing out to $0 by $150k); unused losses carry forward. On sale, claimed depreciation is recaptured at up to 25%, and gains may owe capital-gains tax (a 1031 exchange can defer both). Figures are a year-1 estimate at your 24.0% rate — not tax advice; consult a CPA.
Schools (NCES district)
- District
- River Falls School District
- NCES district ID
- 5513050
- Math proficiency
- 44% ▼ -7.00%
- Reading proficiency
- 49% ▼ -2.00%
- Median HH income
- $63,238
- Composite
- 41.14/100
- National rank
- #3558
- State rank
- #69 of 342 in WI
Livability — River Falls
- Score
- 87/100
- State rank
- #20
- US rank
- #322
Category grades
Schools grade is shown separately in the Schools card above.
Census & demographics
- Census place
- River Falls, WI
- County
- Pierce County · 24,789 people
- City population
- 24,789
- Metro
- Minneapolis-St. Paul-Bloomington, MN-WI
- Population (ZIP)
- 24,789
- Household income
- $96,642
- Rent vs Own
- Severe rent burden
- 422.0
Population outlook (Pierce County) Hauer SSP2
- Today (2025)
- 41,245 people
- By 2030
- 40,340 · -2.2%
- By 2040
- 37,649 · -8.7%
- By 2050
- 34,595 · -16.1%
- By 2075
- 29,067 · -29.5%
- By 2100
- 25,183 · -38.9%
Race, ethnicity, and origin ACS 2023
- Neighborhood character
- Predominantly White (93%)
- Race & ethnicity
- White 93% Two or more races 4% Hispanic / Latino 2% Asian 1%
- Common ancestry
- Portuguese 14% Romanian 4% Lithuanian 3%
- Foreign-born
- 2%
- Languages at home
- 97% English-only · Spanish 1% Other Asian/Pacific 1%
Political lean MEDSL · Pierce
- 2024 margin
- R (+16.8) · D 40.2% · R 56.9% · Other 2.9%
- 2008→2024 swing
- -25.8pp toward R · 2008: 9.0pp · 2024: -16.8pp
- All cycles
- 2024: R+16.8 2020: R+12.9 2016: R+13.7 2012: R+0.8 2008: D+9.0
Not yet ingested
- Civics
- —
Market trends
- HPI YoY
- ▼ -107.31%
- Current HPI
- 272.0987
- Rent YoY
- ▲ 1.13%
- Metro
- Minneapolis-St. Paul-Bloomington, MN-WI
- State GDP YoY
- ▲ 2.10%
- F500 in state
- 20
Industry mix (Fortune 500 HQ in WI)
| Industry | F500 HQs | Revenue |
|---|---|---|
| Industrial Machinery | 4 | $23B |
|
||
| Industrial Technology | 2 | $36B |
|
||
| Insurance | 1 | $36B |
|
||
| Professional Services | 1 | $19B |
|
||
| Utilities | 1 | $9B |
|
||
| Consumer Goods | 1 | $3B |
|
||
Price history
+83.2% since first listed15 events — show timeline
- 2026-05-01 Relisted — NORTHSTARMLS as Distributed by MLS Grid
- 2026-04-19 Contingent — NORTHSTARMLS as Distributed by MLS Grid
- 2026-01-30 Relisted — NORTHSTARMLS as Distributed by MLS Grid
- 2025-12-21 Pending — NORTHSTARMLS as Distributed by MLS Grid
- 2025-12-11 Listed $118,900 NORTHSTARMLS as Distributed by MLS Grid
- 2011-10-06 Listing Removed — NORTHSTARMLS as Distributed by MLS Grid
- 2010-02-05 Listed $56,900 NORTHSTARMLS as Distributed by MLS Grid
- 2010-02-04 Listing Removed — NORTHSTARMLS as Distributed by MLS Grid
- 2009-04-19 Listed $52,900 NORTHSTARMLS as Distributed by MLS Grid
- 2009-04-15 Listing Removed — NORTHSTARMLS as Distributed by MLS Grid
- 2008-05-21 Listed $64,900 NORTHSTARMLS as Distributed by MLS Grid
- 2008-05-09 Listing Removed — NORTHSTARMLS as Distributed by MLS Grid
- 2007-11-20 Listed $64,900 NORTHSTARMLS as Distributed by MLS Grid
- 2007-09-30 Listing Removed — NORTHSTARMLS as Distributed by MLS Grid
- 2005-03-15 Listed $64,900 NORTHSTARMLS as Distributed by MLS Grid
Property tax history
+2.5%/yrLatest (2025): $1,376 · +1.5% YoY. Source: county tax records.
Cash-flow waterfall
monthlySold comps — $/sqft
last 12 mo · ≤1 miLoading sold comps…