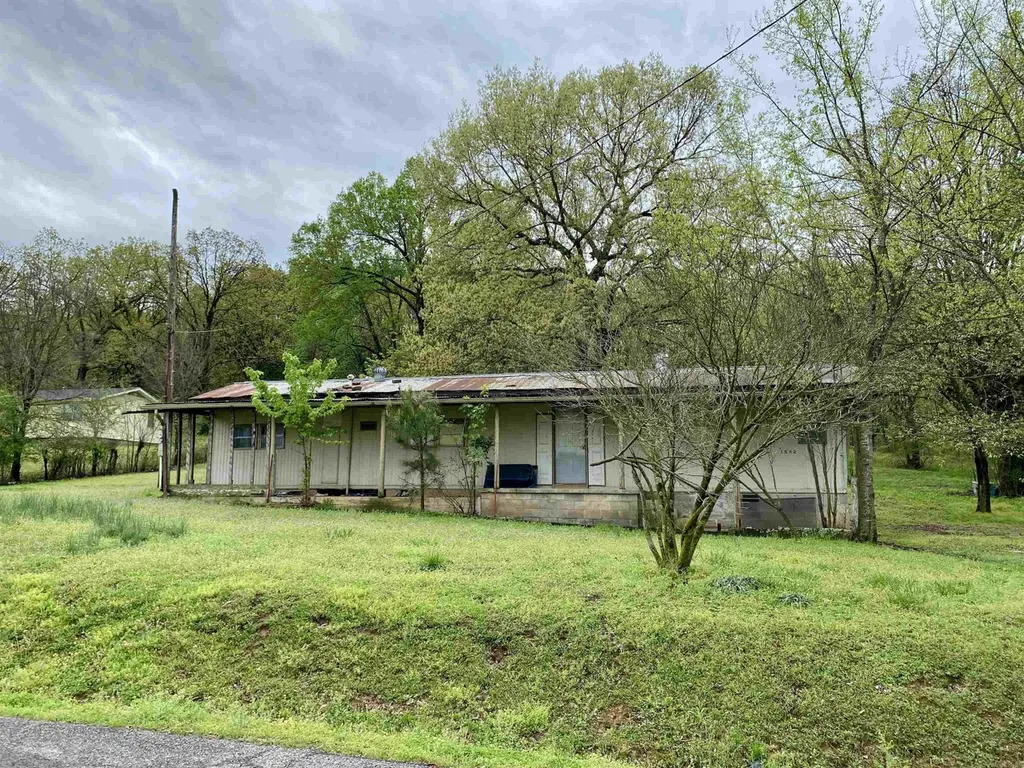
1582 County Road 2305 · Clarksville, AR
Flood risk 1/10 · Minimal
- FEMA flood zone
- X (unshaded)
- Chance of flooding over 30 yrs
- 0.0%
- Est. flood insurance / yr
- $507 – $1,088
Fire risk 5/10 · Moderate
- Est. fire insurance / yr
- $1,499 – $2,785
Heat risk 6/10 · Moderate
- Hot days now (above 111°F)
- 7 days/yr
- Hot days in 30 yrs
- 20 days/yr
Wind risk 2/10 · Minimal
- Chance of severe wind over 30 yrs
- 2.0%
Air-quality risk 1/10 · Minimal
- Unhealthy air days now
- 0 days/yr
- Unhealthy air days in 30 yrs
- 0 days/yr
Risk factors via First Street. Map © Google.
Why this score? — see what drove the B+ grade
The composite is a weighted blend of 9 inputs, each scored 0–100. Each bar is that input's sub-score; the figure is the points it added to the 100-point composite (weight × sub-score).
- Cash flow +30.0/30.0
- 1% rule +10.0/10.0
- DSCR +10.0/10.0
- Appreciation +8.6/10.0
- ARV discount +7.5/15.0
- Livability +3.2/5.0
- Rent growth +2.5/5.0
- Condition / age +2.5/5.0
- Schools +1.6/10.0
$32,900
🖨 Deal sheet 📄 Offer letter ✓ Due diligence
Listing remarks MLS
Located in Fernwood near the Arkansas River and Horsehead Public Use Boat Dock, this affordable fixer-upper mobile home is a great project for a handyman ready to put in the work. With an add-on providing multiple rooms, it offers up to 5 bedrooms or the flexibility to use one as a cozy den. New PEX plumbing is roughed in, and a new water heater and bathtub convey, but significant repairs and renovations are needed throughout. The property sits in a beautiful setting with established shade trees and offers distant mountain views from the back. If you're up for a challenge, this budget-friendly opportunity is perfect for restoring and customizing a home to your liking!
Key facts
- New pex plumbing
- New water heater
- New bathtub
Tags
Neighborhood map
What this means for you Summary
Snapshot
- This is a 4-bed/1.0-bath manufactured listed at $33k.
Deal economics
- At list price, monthly cash flow is $725 ($9k/yr) — positive.
- The deal already cash-flows at list — no discount required.
- Meets the 1% rule at list price ($1k rent vs $33k).
- Recommended offer: $29k (12.0% below list) — sets the bar for market timing.
- Cap rate 32.7% vs local median 4.6% in Clarksville — top-decile yield for the area; either an underpriced asset or a hidden risk that comps aren't pricing in. Stress-test before assuming the spread holds.
Location & tenants
- Location reads 65/100 on livability (#141 in AR) — a middle-class / working-renter tenant base. Strengths: cost of living A+, housing A+; Watch: schools D, crime D-, amenities F.
- Westside School District (rural): math 20% / reading 19% proficiency, ranked #216 of 238 in AR (top 91%) — low school quality limits family demand, transient renter base, plan for 1-2y turnover; 99% free/reduced lunch — lower-income household profile, screen leases tightly.
- Market conditions: 24 active listings in the ZIP; 12 units permitted in Johnson County in 2024 (0 in 5+ unit buildings).
Forward outlook
- In year one you build about $3k of equity ($227 loan paydown + $2k appreciation (7.2% local appreciation)).
- Johnson County population projected at +8% by 2050 — modest demand growth; plan on rents tracking national, not racing it.
- At projected returns (7.2% appreciation + 3.0% rent growth), your $9k cash investment doubles in ~1 year — after that, you're playing with house money.
Negotiation context
- It's been on market 440 days — a 12% lower offer ($29k) is reasonable based on typical stale-listing flexibility.
- Current owner paid $12k; list at $33k implies a 174% gain — meaningful room to come down on a strong offer.
Risks & watch-outs
- Climate carrying-cost: moderate wildfire risk; extreme-heat days projected 7→20/yr by 2055 (HVAC capex compounding) — expect insurance premiums to compound above CPI over the hold.
Questions for the listing agent
- It's been on market 440 days. Have you received any prior offers? Is the seller open to a 12% concession, seller financing, or rate buy-down credit?
- Built in 1970 — when were the roof, HVAC, electrical panel, plumbing, and water heater last replaced?
- Why hasn't it sold? Are there any deal-killer items the seller is aware of (foundation, flood, title, zoning, code violations)?
- Is there a deadline driving the sale (1031 exchange, divorce, estate, relocation)? That informs how much negotiation room exists.
- Schools are D-rated, which usually means shorter tenancies and higher turnover. Who's the typical renter profile here, and what's been the actual vacancy rate?
- Crime grade is D in this area — have there been break-ins, vandalism, or insurance claims at this property in the last 3 years? What carrier currently insures it and at what premium?
- What's the average days-on-market for RENTAL listings here right now (not sales)? A rising rental-DOM trend means longer vacancies and softer asking-rent achievability than the comps imply.
- What's the recent tenant-quality profile in this submarket — average credit score on applications, eviction rate, late-payment / NSF rate, and stable-employment percentage? A property-management company in the area should have these aggregated.
- How much new for-sale + rental construction is in the pipeline within 1–3 miles? Heavy new supply typically softens prices + rents 12–24 months out; constrained supply supports both.
Investment metrics
- 1% rule
- 3.58% ✓
- Cap rate
- 32.73%
- Cash-on-cash
- 94.41%
- DSCR
- 5.20
- GRM
- 2.3
CMA / ARV
No comps found within radius.
Projected returns pro-forma
7.22% appreciation · 3.0% rent growth · sell at horizon
- IRR
- —
- Equity multiple
- 7.31×
- Total profit
- $58,101
- Equity at exit
- $23,275
- IRR
- 98.4%
- Equity multiple
- 15.58×
- Total profit
- $134,313
- Equity at exit
- $44,649
Cash invested: $9,212 (down + closing). Projections, not guarantees.
Landlord ↔ Tenant lean methodology
- Overall (STATE)
- 92 Strongly Landlord-Friendly
- State Arkansas
- 92 Strongly Landlord-Friendly · R+14
- County
- — inherits STATE
- City
- — inherits STATE
ZIP-level market 72840
- Home prices YoY
- 4.2%
- Active inventory
- 24
- Price-to-rent
- 2.3×
Monthly cashflow live
- Estimated rent
- $1,179 medium interval (Pro) →
- Mortgage (P&I)
- −$173
- Tax from tax record
- −$20 /mo · $240/yr
- Insurance
- −$14
- HOA
- −$0
- Vacancy / Maint / Mgmt
- −$247
- Net cashflow
- $725
Break-even live
UW: 25.0% down · 7.5% · 30yr · 1.5% tax · 5.0% vac · 8.0% maint · 8.0% mgmt
Financing live
Cash to close
- Down payment
- $8,225
- Closing costs
- $987
- Reserves months
- —
- Total cash needed
- —
Loan-product check · same deal, 3 products live
Conventional
25% down · 7.5% · 30yr
- Down + closing
- —
- Monthly P&I
- —
- Monthly cashflow
- —
- DSCR
- —
- Eligible?
- —
Personal DTI + credit; lowest rate.
DSCR
20% down · 8.5% · 30yr
- Down + closing
- —
- Monthly P&I
- —
- Monthly cashflow
- —
- DSCR
- —
- Eligible?
- —
No personal income docs; deal must DSCR.
Hard money
10% down · 12.0% · 12mo
- Down + closing
- —
- Monthly P&I
- —
- Monthly cashflow
- —
- DSCR
- —
- Eligible?
- —
Short-term bridge; refi at stabilization.
Listing history 18 events
-
2026-06-19days on market $32,900 Active 440 DOM
-
2026-06-18days on market $32,900 Active 439 DOM
-
2026-06-17days on market $32,900 Active 438 DOM
-
2026-06-16days on market $32,900 Active 437 DOM
-
2026-06-15days on market $32,900 Active 436 DOM
-
2026-06-14days on market $32,900 Active 434 DOM
-
2026-06-12days on market $32,900 Active 433 DOM
-
2026-06-09days on market $32,900 Active 430 DOM
-
2026-06-08days on market $32,900 Active 429 DOM
-
2026-06-07days on market $32,900 Active 428 DOM
-
2026-06-07days on market $32,900 Active 427 DOM
-
2026-06-04days on market $32,900 Active 424 DOM
-
2026-06-02days on market $32,900 Active 423 DOM
-
2026-06-01days on market $32,900 Active 422 DOM
-
2026-05-31days on market $32,900 Active 421 DOM
-
2026-05-31days on market $32,900 Active 420 DOM
-
2025-04-05$32,900 New Listing 676-char remark
Show marketing remark (676 chars)
Located in Fernwood near the Arkansas River and Horsehead Public Use Boat Dock, this affordable fixer-upper mobile home is a great project for a handyman ready to put in the work. With an add-on providing multiple rooms, it offers up to 5 bedrooms or the flexibility to use one as a cozy den. New PEX plumbing is roughed in, and a new water heater and bathtub convey, but significant repairs and renovations are needed throughout. The property sits in a beautiful setting with established shade trees and offers distant mountain views from the back. If you're up for a challenge, this budget-friendly opportunity is perfect for restoring and customizing a home to your liking!
-
2022-10-20soldstatus $12,000
ⓘ Source: listings_history table (triggers on properties + properties_extension) + one-shot
backfill from property_details.listing_events for pre-trigger history.
Tax reassessment forecast AR · Resets to sale price
- Current annual tax
- $240 · $20/mo
- Projected year-2 tax
- $240 · $20/mo
- Expected delta
- $0/yr ($0/mo · 0.0%)
ⓘ Screening estimate from a state-policy table — verify with the county assessor before closing.
Climate risk First Street
- Flood 1/10 Low FEMA zone X (unshaded) · 0% chance over 30 yrs
- Wildfire 5/10 Major
- Heat 6/10 Major 7 d/yr ≥111°F today · 20 d/yr by 30 yrs out
- Wind 2/10 Low 2% chance of damaging wind over 30 yrs
- Air quality 1/10 Low 0 unhealthy d/yr today · 0 by 30 yrs out
Nearby sold comps map
Loading sold comps map…
Walkable amenities ~0.75 mi
Loading nearby amenities…
Taxation est. · year 1
- Rental income
- $14,142
- − Mortgage interest
- −$1,843
- − Property taxes
- −$240
- − Insurance
- −$164
- − Repairs & maintenance
- −$1,131
- − Management
- −$1,131
- − Depreciation
- −$957
- Taxable income
- $8,675
- Est. tax owed @ 24.0%
- −$2,082
- After-tax cash flow
- $6,615/yr
For passive investors: Depreciation is non-cash, so a rental often shows a tax loss while cash-flowing — sheltering income. Rental losses are passive: they offset passive income freely, and up to $25,000/yr can offset ordinary (W-2) income if you actively participate and your MAGI is under $100k (phasing out to $0 by $150k); unused losses carry forward. On sale, claimed depreciation is recaptured at up to 25%, and gains may owe capital-gains tax (a 1031 exchange can defer both). Figures are a year-1 estimate at your 24.0% rate — not tax advice; consult a CPA.
Schools (NCES district)
- District
- Westside School District
- NCES district ID
- 0514020
- Math proficiency
- 20% ▼ -7.00%
- Reading proficiency
- 19% ▼ -8.00%
- Median HH income
- $32,160
- Composite
- 15.81/100
- National rank
- #9265
- State rank
- #216 of 238 in AR
Livability — Clarksville
- Score
- 65/100
- State rank
- #141
- US rank
- #12572
Category grades
Schools grade is shown separately in the Schools card above.
Census & demographics
- Population (ZIP)
- 2,399
Population outlook (Johnson County) Hauer SSP2
- Today (2025)
- 27,452 people
- By 2030
- 28,003 · +2.0%
- By 2040
- 28,960 · +5.5%
- By 2050
- 29,627 · +7.9%
- By 2075
- 31,000 · +12.9%
- By 2100
- 31,173 · +13.6%
Race, ethnicity, and origin ACS 2023
- Neighborhood character
- Predominantly White (80%)
- Race & ethnicity
- White 80% Hispanic / Latino 12% Two or more races 8% Asian 4%
- Hispanic origin (detail)
- Mexican 8% Puerto Rican 3%
- Common ancestry
- Lithuanian 3% Serbian 2% Portuguese 1%
- Foreign-born
- 8% · Canada
- Languages at home
- 87% English-only · Spanish 13%
Political lean MEDSL · Johnson
- 2024 margin
- Solid R (+51.4) · D 23.3% · R 74.7% · Other 2.0%
- 2008→2024 swing
- -28.4pp toward R · 2008: -23.1pp · 2024: -51.4pp
- All cycles
- 2024: R+51.4 2020: R+49.0 2016: R+40.6 2012: R+28.0 2008: R+23.1
Not yet ingested
- Civics
- —
Market trends
- HPI YoY
- ▲ 7.22%
- Current HPI
- 178.524
- Rent YoY
- —
- Metro
- —
- State GDP YoY
- ▲ 3.80%
- F500 in state
- 10
Industry mix (Fortune 500 HQ in AR)
| Industry | F500 HQs | Revenue |
|---|---|---|
| Retail | 1 | $681B |
|
||
| Food / Agriculture | 1 | $53B |
|
||
| Retail / Energy | 1 | $22B |
|
||
| Transportation / Logistics | 1 | $12B |
|
||
| Energy | 1 | $4B |
|
||
Price history
+174.2% since first listed2 events — show timeline
- 2025-04-05 Listed $32,900 CARMLS
- 2022-10-20 Sold (Public Records) $12,000 Public Records
Property tax history
+10.9%/yrLatest (2025): $240 · -17.1% YoY. Source: county tax records.
Cash-flow waterfall
monthlySold comps — $/sqft
last 12 mo · ≤1 miLoading sold comps…