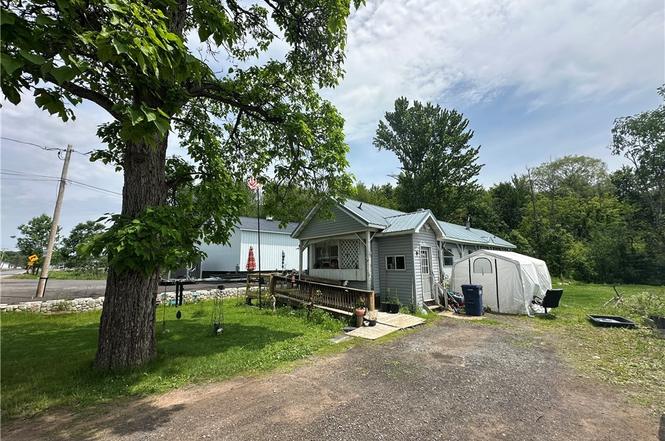
2262 County Route 12 · Central Square, NY
Flood risk 4/10 · Minor
- FEMA flood zone
- X (unshaded)
- Chance of flooding over 30 yrs
- 0.22%
- Est. flood insurance / yr
- $507 – $1,088
Fire risk 3/10 · Minor
- Est. fire insurance / yr
- $691 – $1,283
Heat risk 2/10 · Minimal
- Hot days now (above 94°F)
- 7 days/yr
- Hot days in 30 yrs
- 16 days/yr
Wind risk 1/10 · Minimal
- Chance of severe wind over 30 yrs
- 0.0%
Air-quality risk 2/10 · Minimal
- Unhealthy air days now
- 1 days/yr
- Unhealthy air days in 30 yrs
- 1 days/yr
Risk factors via First Street. Map © Google.
Why this score? — see what drove the B+ grade
The composite is a weighted blend of 9 inputs, each scored 0–100. Each bar is that input's sub-score; the figure is the points it added to the 100-point composite (weight × sub-score).
- Cash flow +30.0/30.0
- 1% rule +10.0/10.0
- DSCR +10.0/10.0
- Appreciation +10.0/10.0
- ARV discount +7.5/15.0
- Schools +3.5/10.0
- Livability +3.2/5.0
- Rent growth +2.5/5.0
- Condition / age +2.5/5.0
$69,900
🖨 Deal sheet (PDF) 📄 Offer letter ✓ Due diligence
Listing remarks
Affordable, move in ready, and full of potential! This well-kept 2 bedroom, 1 bath manufactured home sits on its own spacious lot in a convenient Central Square location. Offering approximately 840 square feet of comfortable living space, the home features a bright and functional layout with an updated kitchen and updated living room and comfortable bedrooms. Outside, the property offers a generous yard with plenty of room for outdoor enjoyment, gardening, pets, or future improvements. Whether you're looking for an affordable primary residence, a low-maintenance downsizing opportunity, or an addition to your investment portfolio, this property checks all the boxes. With manageable upkeep, l
Key facts
- Generous yard
- Updated kitchen
- Convenient location
Tags
Property features AI
Exterior
- Parking: No garage
- Utilities: Public water (connected); Sewer connected
- Home design: Single-wide mobile home; Single-story; Existing (resale) property
- Construction: Vinyl siding
- Exterior features: Gravel driveway; Rectangular residential lot; Road frontage on a city street; Lot dimensions approximately 75 x 150
Interior
- Kitchen: Dishwasher; Gas oven; Gas range; Refrigerator
- Bedrooms: 2 main-level bedrooms
- Flooring: Hardwood; Laminate; Vinyl; Varies
- Bathrooms: 1 full bathroom (main level)
- Heating & cooling: Oil-fired forced air heating
- Interior features: Eat-in kitchen; Other interior features (see remarks)
- Laundry & utility: Oil water heater
Neighborhood map
What this means for you Summary
Snapshot
- This is a 2-bed/1.0-bath manufactured listed at $70k.
Deal economics
- At list price, monthly cash flow is $861 ($10k/yr) — positive.
- The deal already cash-flows at list — no discount required.
- Meets the 1% rule at list price ($2k rent vs $70k).
- Cap rate 21.1% vs local median 3.9% in Central Square — top-decile yield for the area; either an underpriced asset or a hidden risk that comps aren't pricing in. Stress-test before assuming the spread holds.
Location & tenants
- Location reads 64/100 on livability (#723 in NY) — a middle-class / working-renter tenant base. Strengths: housing A+, crime A, cost of living A; Watch: amenities F, commute F, health & safety D-.
- Central Square Central School District (suburban): math 40% / reading 40% proficiency, ranked #507 of 590 in NY (top 86%) — families likely to look elsewhere, expect single-tenant / working-renter base with shorter leases.
- Market conditions: 35 active listings in the ZIP; 172 units permitted in Oswego County in 2024 (27 in 5+ unit buildings).
Forward outlook
- In year one you build about $7k of equity ($483 loan paydown + $7k appreciation (10.0% local appreciation)).
- Oswego County population projected at -23% by 2050 — secular population decline; favor cash flow + early exit over multi-decade hold.
- At projected returns (10.0% appreciation + 3.0% rent growth), your $20k cash investment doubles in ~2 years — after that, you're playing with house money.
- By year 5, paydown + projected appreciation supports a ~$35k cash-out refi (75% LTV) — recoverable capital for the next deal without selling this one.
Negotiation context
- Only 4 days on market — expect competitive offers; lowballing is unlikely to land.
Questions for the listing agent
- Built in 1979 — when were the roof, HVAC, electrical panel, plumbing, and water heater last replaced?
- Is there a deadline driving the sale (1031 exchange, divorce, estate, relocation)? That informs how much negotiation room exists.
- What's the average days-on-market for RENTAL listings here right now (not sales)? A rising rental-DOM trend means longer vacancies and softer asking-rent achievability than the comps imply.
- What's the recent tenant-quality profile in this submarket — average credit score on applications, eviction rate, late-payment / NSF rate, and stable-employment percentage? A property-management company in the area should have these aggregated.
- How much new for-sale + rental construction is in the pipeline within 1–3 miles? Heavy new supply typically softens prices + rents 12–24 months out; constrained supply supports both.
Investment metrics
- 1% rule
- 2.45% ✓
- Cap rate
- 21.08%
- Cash-on-cash
- 52.82%
- DSCR
- 3.35
- GRM
- 3.4
CMA / ARV
No comps found within radius.
Projected returns pro-forma
10.0% appreciation · 3.0% rent growth · sell at horizon
- IRR
- 66.0%
- Equity multiple
- 5.75×
- Total profit
- $92,966
- Equity at exit
- $62,971
- IRR
- 59.6%
- Equity multiple
- 12.79×
- Total profit
- $230,682
- Equity at exit
- $135,800
Cash invested: $19,572 (down + closing). Projections, not guarantees.
Landlord ↔ Tenant lean methodology
- Overall (STATE)
- 15 Strongly Tenant-Friendly
- State New York
- 15 Strongly Tenant-Friendly · D+10
- County
- — inherits STATE
- City
- — inherits STATE
ZIP-level market 13036
- Home prices YoY
- 7.9%
- Active inventory
- 35
- Price-to-rent
- 3.4×
Monthly cashflow live
- Estimated rent
- $1,710 medium interval (Pro) →
- Mortgage (P&I)
- −$367
- Tax from tax record
- −$94 /mo · $1,130/yr
- Insurance
- −$29
- HOA
- −$0
- Vacancy / Maint / Mgmt
- −$359
- Net cashflow
- $861
Break-even live
Sensitivity live
| Price | -10% $901 | -5% $881 | +0% $861 | +5% $842 | +10% $822 |
|---|---|---|---|---|---|
| Rent | -10% $726 | -5% $794 | +0% $861 | +5% $929 | +10% $997 |
| Rate | -1.0pp $897 | -0.5pp $879 | base $861 | +0.5pp $843 | +1.0pp $825 |
UW: 25.0% down · 7.5% · 30yr · 1.5% tax · 5.0% vac · 8.0% maint · 8.0% mgmt
Financing live
Cash to close
- Down payment
- $17,475
- Closing costs
- $2,097
- Reserves months
- —
- Total cash needed
- —
Loan-product check · same deal, 3 products live
Conventional
25% down · 7.5% · 30yr
- Down + closing
- —
- Monthly P&I
- —
- Monthly cashflow
- —
- DSCR
- —
- Eligible?
- —
Personal DTI + credit; lowest rate.
DSCR
20% down · 8.5% · 30yr
- Down + closing
- —
- Monthly P&I
- —
- Monthly cashflow
- —
- DSCR
- —
- Eligible?
- —
No personal income docs; deal must DSCR.
Hard money
10% down · 12.0% · 12mo
- Down + closing
- —
- Monthly P&I
- —
- Monthly cashflow
- —
- DSCR
- —
- Eligible?
- —
Short-term bridge; refi at stabilization.
Listing history 4 events
-
2026-06-21days on market $69,900 Active 4 DOM
-
2026-06-21days on market $69,900 Active 3 DOM
-
2026-06-18remarks 699-char remark
-
2026-06-18$69,900 Active 1 DOM
ⓘ Source: listings_history table (triggers on properties + properties_extension) + one-shot
backfill from property_details.listing_events for pre-trigger history.
Tax reassessment forecast NY · Partial reset (capped growth)
- Current annual tax
- $1,130 · $94/mo
- Projected year-2 tax
- $1,156 · $96/mo
- Expected delta
- +$26/yr (+$2/mo · 2.3%)
ⓘ Screening estimate from a state-policy table — verify with the county assessor before closing.
Climate risk First Street
- Flood 4/10 Moderate FEMA zone X (unshaded) · 22% chance over 30 yrs
- Wildfire 3/10 Moderate
- Heat 2/10 Low 7 d/yr ≥94°F today · 16 d/yr by 30 yrs out
- Wind 1/10 Low 0% chance of damaging wind over 30 yrs
- Air quality 2/10 Low 1 unhealthy d/yr today · 1 by 30 yrs out
Nearby sold comps map
Loading sold comps map…
Walkable amenities ~0.75 mi
Loading nearby amenities…
Taxation est. · year 1
- Rental income
- $20,526
- − Mortgage interest
- −$3,915
- − Property taxes
- −$1,130
- − Insurance
- −$350
- − Repairs & maintenance
- −$1,642
- − Management
- −$1,642
- − Depreciation
- −$2,033
- Taxable income
- $9,814
- Est. tax owed @ 24.0%
- −$2,355
- After-tax cash flow
- $7,982/yr
For passive investors: Depreciation is non-cash, so a rental often shows a tax loss while cash-flowing — sheltering income. Rental losses are passive: they offset passive income freely, and up to $25,000/yr can offset ordinary (W-2) income if you actively participate and your MAGI is under $100k (phasing out to $0 by $150k); unused losses carry forward. On sale, claimed depreciation is recaptured at up to 25%, and gains may owe capital-gains tax (a 1031 exchange can defer both). Figures are a year-1 estimate at your 24.0% rate — not tax advice; consult a CPA.
Schools (NCES district)
- District
- Central Square Central School District
- NCES district ID
- 3606900
- Math proficiency
- 40% ▼ -18.00%
- Reading proficiency
- 40% ▼ -12.00%
- Median HH income
- $55,807
- Composite
- 35.05/100
- National rank
- #5035
- State rank
- #507 of 590 in NY
Livability — Central Square
- Score
- 64/100
- State rank
- #723
- US rank
- #13714
Category grades
Schools grade is shown separately in the Schools card above.
Census & demographics
- Census place
- Central Square, NY
- Population (ZIP)
- 9,079
Population outlook (Oswego County) Hauer SSP2
- Today (2025)
- 114,465 people
- By 2030
- 109,968 · -3.9%
- By 2040
- 99,205 · -13.3%
- By 2050
- 87,979 · -23.1%
- By 2075
- 65,100 · -43.1%
- By 2100
- 47,117 · -58.8%
Race, ethnicity, and origin ACS 2023
- Neighborhood character
- Predominantly White (97%)
- Race & ethnicity
- White 97% Two or more races 3%
- Common ancestry
- Romanian 8% Lithuanian 6% Iranian 3%
- Foreign-born
- 1% · Canada
- Languages at home
- 97% English-only · Other Indo-European 2% Spanish 1%
Political lean MEDSL · Oswego
- 2024 margin
- Strong R (+24.2) · D 37.9% · R 62.1%
- 2008→2024 swing
- -26.6pp toward R · 2008: 2.5pp · 2024: -24.2pp
- All cycles
- 2024: R+24.2 2020: R+20.2 2016: R+23.2 2012: D+7.9 2008: D+2.5
Not yet ingested
- Civics
- —
Market trends
- HPI YoY
- ▲ 23.27%
- Current HPI
- 318.5068
- Rent YoY
- —
- Metro
- —
- State GDP YoY
- ▲ 2.60%
- F500 in state
- 92
Industry mix (Fortune 500 HQ in NY)
| Industry | F500 HQs | Revenue |
|---|---|---|
| Financial Services | 10 | $950B |
|
||
| Consumer Goods | 9 | $162B |
|
||
| Insurance | 4 | $225B |
|
||
| Telecommunications | 2 | $144B |
|
||
| Pharmaceuticals | 2 | $112B |
|
||
| Media / Entertainment | 2 | $69B |
|
||
Price history
1 event — show timeline
- 2026-06-17 Listed $69,900 CNYIS
Property tax history
+6.7%/yrLatest (2025): $1,130 · +1.6% YoY. Source: county tax records.
Cash-flow waterfall
monthlySold comps — $/sqft
last 12 mo · ≤1 miLoading sold comps…