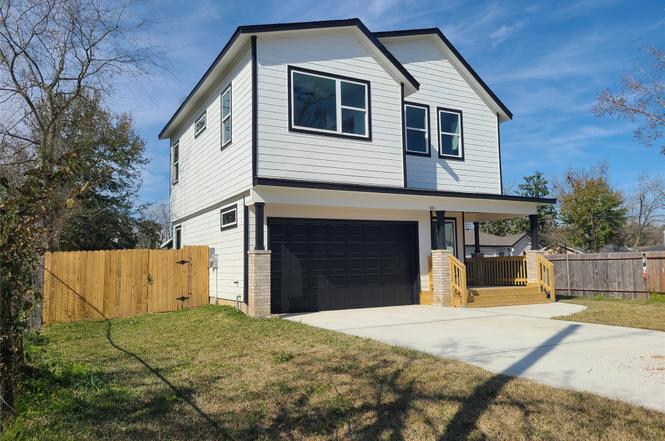
 🏗️ New Construction
8811 Knox St · Houston, TX
Flood risk 1/10 · Minimal
- FEMA flood zone
- X (unshaded)
- Chance of flooding over 30 yrs
- 0.0%
- Est. flood insurance / yr
- $507 – $1,088
Fire risk 1/10 · Minimal
- Est. fire insurance / yr
- $1,222 – $2,270
Heat risk 9/10 · Severe
- Hot days now (above 109°F)
- 6 days/yr
- Hot days in 30 yrs
- 20 days/yr
Wind risk 9/10 · Severe
- Chance of severe wind over 30 yrs
- 99.0%
Air-quality risk 3/10 · Minor
- Unhealthy air days now
- 3 days/yr
- Unhealthy air days in 30 yrs
- 4 days/yr
Risk factors via First Street. Map © Google.
Why this score? — see what drove the D grade
The composite is a weighted blend of 9 inputs, each scored 0–100. Each bar is that input's sub-score; the figure is the points it added to the 100-point composite (weight × sub-score).
- Cash flow +15.7/30.0
- ARV discount +7.5/15.0
- DSCR +4.8/10.0
- 1% rule +4.3/10.0
- Livability +3.7/5.0
- Schools +2.7/10.0
- Condition / age +2.5/5.0
- Rent growth +2.2/5.0
- Appreciation +0.0/10.0
$225,000
🖨 Deal sheet (PDF) 📄 Offer letter ✓ Due diligence
Listing remarks
Brand New Home with large open are
Key facts
- 7,200 sq ft lot
- 2 garage spots
- Built 2026
Neighborhood map
What this means for you Summary
Snapshot
- This is a 4-bed/2.5-bath single-family listed at $225k.
Deal economics
- At list price, monthly cash flow is $94 ($1k/yr) — positive.
- The deal already cash-flows at list — no discount required.
- To meet the 1% rule (rent ≥ 1% of price), the offer needs to be $204k (9.4% below list).
- Recommended offer: $204k (9.4% below list) — sets the bar for 1% rule.
- Cap rate 6.8% vs local median 3.2% in Houston — top-decile yield for the area; either an underpriced asset or a hidden risk that comps aren't pricing in. Stress-test before assuming the spread holds.
Location & tenants
- Location reads 74/100 on livability (#184 in TX, #4,771 nationally) — a middle-class / working-renter tenant base. Strengths: amenities A+, cost of living A+, housing A+; Watch: crime F.
- Houston ISD (urban): math 27% / reading 35% proficiency, ranked #593 of 826 in TX (top 72%) — families likely to look elsewhere, expect single-tenant / working-renter base with shorter leases; 71% free/reduced lunch — lower-income household profile, screen leases tightly.
- Zoned schools: Osborne El (math 12% / reading 12%, grade F, #4,207 of 4,322 statewide, top 98%, 315 students, 99% FRL); Williams Middle (math 9% / reading 15%, grade F, #1,623 of 1,662 statewide, top 98%, 411 students, 98% FRL); Washington B T H S (math 27% / reading 25%, grade F, #1,234 of 1,632 statewide, top 76%, 878 students, 96% FRL) — zoned schools average 98% FRL vs 71% district-wide (27 pts higher); higher-poverty schools than district average — tighter screening recommended.
- Zoned-school proficiency averages 17% at this address vs 31% district-wide (-14 pts) — the specific schools serving this property underperform the Houston ISD average; the district grade overstates school quality for this exact location.
- Market conditions: Rents soft (-1.0%/yr); 471 active listings in the ZIP; 33 comparable units currently listed for rent nearby; rentals lingering (median 46d on market — plan ~5-8 weeks vacancy on turnover, expect pricing pressure); 52% of comp listings sitting > 30 days — soft ceiling on asking rent; 29,883 units permitted in Harris County in 2024 (8,621 in 5+ unit buildings).
- This rent runs 45% of the median local income ($54k/yr) — at the standard rent-burdened threshold; future hikes will face affordability resistance.
Forward outlook
- Local home prices are declining (-3.0%/yr); year-one equity from $2k of loan paydown is wiped out by about $7k of value loss. Plan a longer hold.
- Harris County population projected at +47% by 2050 — long-run rental-demand tailwind backs the buy-and-hold thesis.
Negotiation context
- It's been on market 37 days — a 3% lower offer ($218k) is reasonable based on typical stale-listing flexibility.
Risks & watch-outs
- Climate carrying-cost: severe wind risk, 99% chance of damaging wind over 30y; extreme-heat days projected 6→20/yr by 2055 (HVAC capex compounding) — expect insurance premiums to compound above CPI over the hold.
Questions for the listing agent
- It's been on market 37 days. Have you received any prior offers? Is the seller open to a 9% concession, seller financing, or rate buy-down credit?
- Is there a deadline driving the sale (1031 exchange, divorce, estate, relocation)? That informs how much negotiation room exists.
- Schools are D-rated, which usually means shorter tenancies and higher turnover. Who's the typical renter profile here, and what's been the actual vacancy rate?
- Crime grade is F in this area — have there been break-ins, vandalism, or insurance claims at this property in the last 3 years? What carrier currently insures it and at what premium?
- The area grade is low — what's the realistic commute time and amenity access for the typical tenant pool here? Any planned neighborhood developments (good or bad) we should know about?
- What's the average days-on-market for RENTAL listings here right now (not sales)? A rising rental-DOM trend means longer vacancies and softer asking-rent achievability than the comps imply.
- What's the recent tenant-quality profile in this submarket — average credit score on applications, eviction rate, late-payment / NSF rate, and stable-employment percentage? A property-management company in the area should have these aggregated.
- How much new for-sale + rental construction is in the pipeline within 1–3 miles? Heavy new supply typically softens prices + rents 12–24 months out; constrained supply supports both.
Investment metrics
- 1% rule
- 0.93% ✗
- Cap rate
- 6.81%
- Cash-on-cash
- 1.85%
- DSCR
- 1.08
- GRM
- 8.9
CMA / ARV
- ARV (on-the-fly)
- $218,746
- Comps found
- 12
Show comp detail 12 sales within ~0.75 mi
| Address | Dist | Beds/Ba | Sqft | Sold | Price | $/sf | Match |
|---|---|---|---|---|---|---|---|
| 1042 Marcolin St | 0.06mi | 3/2.0 (-1) | 1,460 (+9%) | 1mo | $155,000 | $106 | 75 |
| 8401 Hanfro Ln | 0.47mi | 3/2.0 (-1) | 1,360 (+1%) | 1mo | $208,000 | $153 | 68 |
| 8414 Williamsdell St | 0.42mi | 3/2.0 (-1) | 1,410 (+5%) | 1mo | $210,000 | $149 | 64 |
| 882 Fortune St St | 0.62mi | 3/2.5 (-1) | 1,379 (+3%) | 0mo | $265,000 | $192 | 61 |
| 1001 Reverend B J Lewis Dr | 0.36mi | 3/2.0 (-1) | 1,272 (-5%) | 9mo | $264,999 | $208 | 60 |
| 938 Ellington St | 0.25mi | 3/2.0 (-1) | 1,224 (-9%) | 9mo | $225,000 | $184 | 60 |
| 1559 Diplomat Way | 0.20mi | 4/1.5 | 1,158 (-14%) | 5mo | $159,990 | $138 | 59 |
| 1093 Junell St | 0.61mi | 3/1.5 (-1) | 1,410 (+5%) | 3mo | $185,000 | $131 | 52 |
| 1479 Ferguson Way | 0.57mi | 3/2.5 (-1) | 1,469 (+10%) | 6mo | $275,000 | $187 | 47 |
| 1806 Saddle Rock Dr | 0.66mi | 3/1.5 (-1) | 1,466 (+9%) | 7mo | $156,900 | $107 | 40 |
| 7921 Virgil St | 0.72mi | 3/2.0 (-1) | 1,197 (-11%) | 6mo | $225,000 | $188 | 36 |
| 940 Lucky St | 0.75mi | 3/2.0 (-1) | 1,536 (+14%) | 8mo | $249,900 | $163 | 27 |
Match score weights: distance 35% · size 25% · config 20% · recency 20%. Top-matched comps best support the ARV.
Projected returns pro-forma
-3.0% appreciation · 0.0% rent growth · sell at horizon
- IRR
- -16.8%
- Equity multiple
- 0.42×
- Total profit
- $-35,386
- Equity at exit
- $32,616
- IRR
- -15.4%
- Equity multiple
- 0.25×
- Total profit
- $-46,039
- Equity at exit
- $18,913
Cash invested: $61,249 (down + closing). Projections, not guarantees.
Landlord ↔ Tenant lean methodology
- Overall (STATE)
- 87 Strongly Landlord-Friendly
- State Texas
- 87 Strongly Landlord-Friendly · R+5
- County
- — inherits STATE
- City
- — inherits STATE
ZIP-level market 77088
- Home prices YoY
- -23.2%
- Rents YoY
- -1.0%
- Active inventory
- 471
- Price-to-rent
- 9.2×
Monthly cashflow live
- Estimated rent
- $2,039 high interval (Pro) →
- Mortgage (P&I)
- −$1,147
- Tax from tax record
- −$278 /mo · $3,339/yr
- Insurance
- −$91
- HOA
- −$0
- Vacancy / Maint / Mgmt
- −$428
- Net cashflow
- $94
Break-even live
Sensitivity live
| Price | -10% $218 | -5% $156 | +0% $94 | +5% $32 | +10% $-30 |
|---|---|---|---|---|---|
| Rent | -10% $-67 | -5% $14 | +0% $94 | +5% $175 | +10% $255 |
| Rate | -1.0pp $204 | -0.5pp $150 | base $94 | +0.5pp $38 | +1.0pp $-20 |
UW: 25.0% down · 7.5% · 30yr · 1.5% tax · 5.0% vac · 8.0% maint · 8.0% mgmt
Financing live
Cash to close
- Down payment
- $54,686
- Closing costs
- $6,562
- Reserves months
- —
- Total cash needed
- —
Loan-product check · same deal, 3 products live
Conventional
25% down · 7.5% · 30yr
- Down + closing
- —
- Monthly P&I
- —
- Monthly cashflow
- —
- DSCR
- —
- Eligible?
- —
Personal DTI + credit; lowest rate.
DSCR
20% down · 8.5% · 30yr
- Down + closing
- —
- Monthly P&I
- —
- Monthly cashflow
- —
- DSCR
- —
- Eligible?
- —
No personal income docs; deal must DSCR.
Hard money
10% down · 12.0% · 12mo
- Down + closing
- —
- Monthly P&I
- —
- Monthly cashflow
- —
- DSCR
- —
- Eligible?
- —
Short-term bridge; refi at stabilization.
Rent comps 33 comps
| Address | Beds | Baths | Sqft | Rent | $/sqft | DOM | Units | Dist |
|---|---|---|---|---|---|---|---|---|
| 1495 W Gulf Bank Rd Houston, TX | 5.0 | 2.5 | 1713 | $1,750 | $1.02 | 46d | 1 | 0.35mi |
| 929 Marjorie St Unit 1060806P Houston, TX | 3.0 | 2.0 | 1076 | $3,091 | $2.87 | 9d | 1 | 0.42mi |
| 8406 De Priest St Unit A Houston, TX | 3.0 | 2.5 | 1600 | $1,695 | $1.06 | 45d | 1 | 0.46mi |
| 8404 De Priest St Unit A Houston, TX | 3.0 | 2.5 | 1600 | $1,900 | $1.19 | 45d | 1 | 0.47mi |
| 8312 De Priest St Unit B Houston, TX | 3.0 | 3.5 | 1500 | $1,900 | $1.27 | 22d | 1 | 0.48mi |
| 8312 De Priest St Unit A Houston, TX | 3.0 | 2.5 | 1500 | $1,900 | $1.27 | 22d | 1 | 0.48mi |
| 8310 De Priest St Unit B Houston, TX | 3.0 | 2.5 | 1500 | $1,900 | $1.27 | 22d | 1 | 0.49mi |
| 8306 De Priest St Unit A Houston, TX | 3.0 | 2.5 | 1500 | $1,900 | $1.27 | 22d | 1 | 0.49mi |
| 8304 De Priest St Unit B Houston, TX | 3.0 | 2.5 | 1600 | $1,900 | $1.19 | 23d | 1 | 0.50mi |
| 1010 Junell St Unit A Houston, TX | 3.0 | 2.0 | 1040 | $1,550 | $1.49 | 26d | 1 | 0.51mi |
| 8122 De Priest St Unit A Houston, TX | 3.0 | 3.5 | 1500 | $1,900 | $1.27 | 45d | 1 | 0.51mi |
| 8120 De Priest St Unit B Houston, TX | 3.0 | 2.5 | 1500 | $1,900 | $1.27 | 45d | 1 | 0.51mi |
| 8120 De Priest St Unit A Houston, TX | 3.0 | 2.5 | 1500 | $1,750 | $1.17 | 45d | 1 | 0.51mi |
| 8118 De Priest St Unit B Houston, TX | 3.0 | 2.5 | 1500 | $1,900 | $1.27 | 45d | 1 | 0.51mi |
| 1450 Dewalt St Houston, TX | 3.0 | 2.5 | 1371 | $2,500 | $1.82 | 45d | 1 | 0.52mi |
| 8112 De Priest St Unit B Houston, TX | 3.0 | 2.5 | 1500 | $1,750 | $1.17 | 1d | 1 | 0.53mi |
| 8110 De Priest St Unit A Houston, TX | 3.0 | 2.5 | 1500 | $1,900 | $1.27 | 45d | 1 | 0.54mi |
| 8108 De Priest St Unit B Houston, TX | 3.0 | 2.5 | 1500 | $1,900 | $1.27 | 45d | 1 | 0.54mi |
| 1438 Peach Spring Dr Houston, TX | 4.0 | 1.5 | 1288 | $1,599 | $1.24 | 3d | 1 | 0.59mi |
| 9002 Bunny Run Dr Houston, TX | 3.0 | 2.0 | 1544 | $1,950 | $1.26 | 26d | 1 | 0.82mi |
| 783 Fortune St Unit A Houston, TX | 3.0 | 2.5 | 1328 | $1,795 | $1.35 | 18d | 1 | 0.83mi |
| 7514 Sandle St Houston, TX | 3.0 | 2.5 | 1523 | $1,999 | $1.31 | 45d | 1 | 0.97mi |
| 1032 Glen Ln Houston, TX | 3.0 | 3.0 | 1667 | $2,400 | $1.44 | 45d | 1 | 1.01mi |
| 855 S Victory Dr Unit C Houston, TX | 3.0 | 2.5 | 1546 | $2,300 | $1.49 | 45d | 1 | 1.06mi |
| 7486 N Shepherd Dr Houston, TX | 3.0 | 2.0 | 1177 | $1,290 | $1.10 | 45d | 1 | 1.19mi |
| 2320 Wavell St Unit A Houston, TX | 3.0 | 2.5 | 1150 | $1,900 | $1.65 | 45d | 1 | 1.20mi |
| 2320 Wavell St Unit B Houston, TX | 3.0 | 2.5 | 1150 | $1,683 | $1.46 | 45d | 1 | 1.20mi |
| 2407 Ferguson Way Houston, TX | 3.0 | 2.5 | 1195 | $1,650 | $1.38 | 45d | 1 | 1.22mi |
| 7903 Moon Beam St Houston, TX | 3.0 | 2.5 | 1217 | $1,700 | $1.40 | 18d | 1 | 1.39mi |
| 7504 Carver Rd Unit B Houston, TX | 3.0 | 2.5 | 1694 | $2,500 | $1.48 | 1d | 1 | 1.40mi |
| 7504 Carver Rd Houston, TX | 3.0 | 2.5 | 1694 | $2,500 | $1.48 | 7d | 1 | 1.40mi |
| 8101 Venus St Unit B Houston, TX | 3.0 | 2.0 | 1375 | $1,595 | $1.16 | 26d | 1 | 1.49mi |
| 8101 Venus St Unit A Houston, TX | 3.0 | 2.0 | 1375 | $1,699 | $1.24 | 26d | 1 | 1.49mi |
Listing history 4 events
-
2026-04-02status Pending
-
2026-03-26status Pending
-
2026-02-23$225,000 Active
-
1988-01-02soldstatus
ⓘ Source: listings_history table (triggers on properties + properties_extension) + one-shot
backfill from property_details.listing_events for pre-trigger history.
Tax reassessment forecast TX · Resets to sale price
- Current annual tax
- $3,339 · $278/mo
- Projected year-2 tax
- $4,118 · $343/mo
- Expected delta
- +$779/yr (+$65/mo · 23.3%)
ⓘ Screening estimate from a state-policy table — verify with the county assessor before closing.
Climate risk First Street
- Flood 1/10 Low FEMA zone X (unshaded) · 0% chance over 30 yrs
- Wildfire 1/10 Low
- Heat 9/10 Extreme 6 d/yr ≥109°F today · 20 d/yr by 30 yrs out
- Wind 9/10 Extreme 99% chance of damaging wind over 30 yrs
- Air quality 3/10 Moderate 3 unhealthy d/yr today · 4 by 30 yrs out
Nearby sold comps map
Loading sold comps map…
Walkable amenities ~0.75 mi
Loading nearby amenities…
Taxation est. · year 1
- Rental income
- $24,467
- − Mortgage interest
- −$12,253
- − Property taxes
- −$3,339
- − Insurance
- −$1,094
- − Repairs & maintenance
- −$1,957
- − Management
- −$1,957
- − Depreciation
- −$6,364
- Taxable loss
- −$2,497
- Est. tax savings @ 24.0%
- +$599
- After-tax cash flow
- $1,730/yr
For passive investors: Depreciation is non-cash, so a rental often shows a tax loss while cash-flowing — sheltering income. Rental losses are passive: they offset passive income freely, and up to $25,000/yr can offset ordinary (W-2) income if you actively participate and your MAGI is under $100k (phasing out to $0 by $150k); unused losses carry forward. On sale, claimed depreciation is recaptured at up to 25%, and gains may owe capital-gains tax (a 1031 exchange can defer both). Figures are a year-1 estimate at your 24.0% rate — not tax advice; consult a CPA.
Schools (NCES district)
- District
- Houston ISD
- NCES district ID
- 4823640
- Math proficiency
- 27% ▼ -18.00%
- Reading proficiency
- 35% ▼ -6.00%
- Median HH income
- $46,054
- Composite
- 26.63/100
- National rank
- #7173
- State rank
- #593 of 826 in TX
Livability — Houston
- Score
- 74/100
- State rank
- #184
- US rank
- #4771
Category grades
Schools grade is shown separately in the Schools card above.
Census & demographics
- Census place
- Houston, TX
- County
- Harris County · 4,702,590 people
- City population
- 3,226,434
- Metro
- Houston-The Woodlands-Sugar Land, TX
- Population (ZIP)
- 57,047
- Household income
- $54,411
- Rent vs Own
- Severe rent burden
- 2294.0
Population outlook (Harris County) Hauer SSP2
- Today (2025)
- 5,571,493 people
- By 2030
- 6,089,821 · +9.3%
- By 2040
- 7,142,806 · +28.2%
- By 2050
- 8,185,864 · +46.9%
- By 2075
- 10,574,329 · +89.8%
- By 2100
- 12,109,958 · +117.4%
Race, ethnicity, and origin ACS 2023
- Neighborhood character
- Diverse neighborhood (Simpson 0.59)
- Race & ethnicity
- Hispanic / Latino 52% Black 37% Two or more races 18% White 6% Asian 4%
- Hispanic origin (detail)
- Mexican 36%
- Common ancestry
- Lithuanian 1%
- Foreign-born
- 25% · Canada, Vietnam, China
- Languages at home
- 49% English-only · Spanish 47% Vietnamese 3%
Political lean MEDSL · Harris
- 2024 margin
- Lean D (+5.5) · D 52.0% · R 46.4% · Other 1.6%
- 2008→2024 swing
- +3.9pp toward D · 2008: 1.6pp · 2024: 5.5pp
- All cycles
- 2024: D+5.5 2020: D+13.3 2016: D+12.4 2012: D+0.1 2008: D+1.6
Not yet ingested
- Civics
- —
Market trends
- HPI YoY
- ▼ -98.37%
- Current HPI
- 325.0499
- Rent YoY
- ▼ -1.01%
- Metro
- Houston-The Woodlands-Sugar Land, TX
- State GDP YoY
- ▲ 3.95%
- F500 in state
- 110
Industry mix (Fortune 500 HQ in TX)
| Industry | F500 HQs | Revenue |
|---|---|---|
| Energy | 16 | $1,198B |
|
||
| Technology | 5 | $198B |
|
||
| Engineering / Construction | 4 | $72B |
|
||
| Energy Services | 3 | $60B |
|
||
| Utilities | 3 | $41B |
|
||
| Healthcare | 2 | $330B |
|
||
Price history
4 events — show timeline
- 2026-04-02 Pending — HARMLS
- 2026-03-26 Pending — HARMLS
- 2026-02-23 Listed $225,000 HARMLS
- 1988-01-02 Sold (Public Records) — Public Records
Property tax history
+38.5%/yrLatest (2025): $3,339 · +84.7% YoY. Source: county tax records.
Cash-flow waterfall
monthlySold comps — $/sqft
last 12 mo · ≤1 miLoading sold comps…