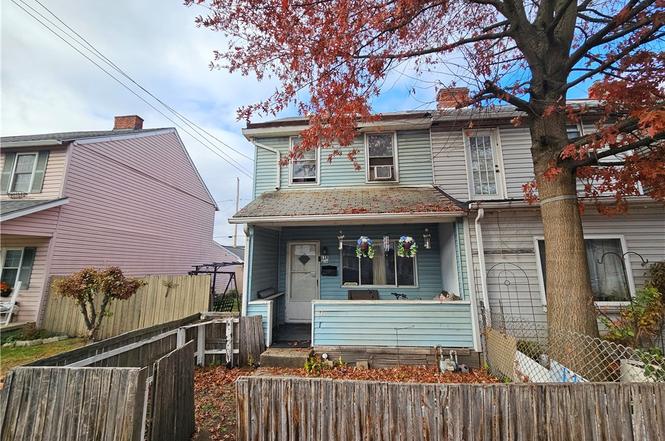
116 Orchard St · Bellevue, PA
Flood risk 9/10 · Severe
- FEMA flood zone
- X (unshaded)
- Chance of flooding over 30 yrs
- 0.99%
- Est. flood insurance / yr
- $507 – $1,088
Fire risk 1/10 · Minimal
- Est. fire insurance / yr
- $511 – $949
Heat risk 5/10 · Moderate
- Hot days now (above 98°F)
- 7 days/yr
- Hot days in 30 yrs
- 19 days/yr
Wind risk 2/10 · Minimal
- Chance of severe wind over 30 yrs
- —
Air-quality risk 3/10 · Minor
- Unhealthy air days now
- 3 days/yr
- Unhealthy air days in 30 yrs
- 3 days/yr
Risk factors via First Street. Map © Google.
Why this score? — see what drove the B grade
The composite is a weighted blend of 9 inputs, each scored 0–100. Each bar is that input's sub-score; the figure is the points it added to the 100-point composite (weight × sub-score).
- Cash flow +30.0/30.0
- 1% rule +10.0/10.0
- DSCR +10.0/10.0
- ARV discount +7.5/15.0
- Rent growth +5.0/5.0
- Livability +4.6/5.0
- Condition / age +2.5/5.0
- Schools +0.9/10.0
- Appreciation +0.0/10.0
$30,000
🖨 Deal sheet 📄 Offer letter ✓ Due diligence
Listing remarks
116 Orchard St offers solid potential in Stowe Twp’s Preston area—perfect as a starter home or strong rental option with some fixes and updates. This 2-story, 2BR/1BA home features a lg eat-in kitchen w/ pantry, a nicely sized living room, & main-level laundry hookups for convenience. Upstairs hosts 2 BRs w/ good space for personal touches. Enjoy both a fenced front & rear yard—ideal for pets or play—plus a large detached garage providing added storage or covered parking during winter months. Close to the neighborhood park, minutes to Downtown PGH, RT 65, & quick access to I-79, making commuting a breeze. Great opportunity to update & add value
Key facts
- Eat-in kitchen
- Fenced front yard
- Fenced rear yard
Tags
Neighborhood map
What this means for you Summary
Snapshot
- This is a 2-bed/1.0-bath condo listed at $30k.
Deal economics
- At list price, monthly cash flow is $623 ($7k/yr) — positive.
- The deal already cash-flows at list — no discount required.
- Meets the 1% rule at list price ($1k rent vs $30k).
- Recommended offer: $27k (9.0% below list) — sets the bar for market timing.
- Cap rate 33.9% vs local median 4.0% in Bellevue — top-decile yield for the area; either an underpriced asset or a hidden risk that comps aren't pricing in. Stress-test before assuming the spread holds.
Location & tenants
- Location reads 92/100 on livability (#9 in PA, #35 nationally) — a professional / high-income tenant draw. Strengths: amenities A+, commute A+, cost of living A+.
- Sto-Rox SD (suburban): math 4% / reading 18% proficiency, ranked #532 of 539 in PA (top 99%) — low school quality limits family demand, transient renter base, plan for 1-2y turnover; 77% free/reduced lunch — lower-income household profile, screen leases tightly.
- Market conditions: Rents rising fast (+13.1%/yr); 125 active listings in the ZIP; 39 comparable units currently listed for rent nearby; rentals at typical pace (median 24d on market — plan ~3-4 weeks tenant-placement turnaround); 46% of comp listings sitting > 30 days — soft ceiling on asking rent; 2,996 units permitted in Allegheny County in 2024 (1,588 in 5+ unit buildings).
Forward outlook
- Local home prices are declining (-3.0%/yr); year-one equity from $207 of loan paydown is wiped out by about $900 of value loss. Plan a longer hold.
- At projected returns (-3.0% appreciation + 8.0% rent growth), your $8k cash investment doubles in ~2 years — after that, you're playing with house money.
Negotiation context
- It's been on market 111 days — a 9% lower offer ($27k) is reasonable based on typical stale-listing flexibility.
- 2 sale attempts with the ask held roughly flat each time — persistent listings suggest the price (not the market) is what's stuck; bring a comps-based counter.
- Current owner paid $21k; 42% above their basis — modest negotiation headroom, anchor on the comps not their cost.
Risks & watch-outs
- Watch-outs: property tax is 2.6% of price; flood insurance adds $66/mo; built in 1900 — expect roof / HVAC / electrical / plumbing capex.
- Climate carrying-cost: severe flood risk; extreme-heat days projected 7→19/yr by 2055 (HVAC capex compounding) — expect insurance premiums to compound above CPI over the hold.
Questions for the listing agent
- It's been on market 111 days. Have you received any prior offers? Is the seller open to a 9% concession, seller financing, or rate buy-down credit?
- Built in 1900 — when were the roof, HVAC, electrical panel, plumbing, and water heater last replaced?
- Property tax is high relative to price — has the assessment been appealed recently, and will the sale trigger a re-assessment?
- What's the actual annual flood-insurance premium (NFIP or private), and is the property in a SFHA with mandatory coverage?
- Any open or pending special assessments — roof, HVAC, plumbing, elevator, façade? What's the per-unit balance and payoff schedule, and is the seller paying it off at close or rolling it to the buyer?
- Why hasn't it sold? Are there any deal-killer items the seller is aware of (foundation, flood, title, zoning, code violations)?
- Is there a deadline driving the sale (1031 exchange, divorce, estate, relocation)? That informs how much negotiation room exists.
- Schools are B-rated — typically a magnet for longer-tenancy family renters. What's the average tenant stay here, and is there a school-zone premium baked into asking?
- What's the average days-on-market for RENTAL listings here right now (not sales)? A rising rental-DOM trend means longer vacancies and softer asking-rent achievability than the comps imply.
- What's the recent tenant-quality profile in this submarket — average credit score on applications, eviction rate, late-payment / NSF rate, and stable-employment percentage? A property-management company in the area should have these aggregated.
- How much new apartment / multifamily construction is in the pipeline within 1–3 miles? Heavy new supply (>2% of stock underway) typically softens rents 12–24 months out; light construction supports rent growth.
Investment metrics
- 1% rule
- 3.90% ✓
- Cap rate
- 33.85%
- Cash-on-cash
- 98.43%
- DSCR
- 5.38
- GRM
- 2.1
CMA / ARV
No comps found within radius.
Projected returns pro-forma
-3.0% appreciation · 8.0% rent growth · sell at horizon
- IRR
- 95.8%
- Equity multiple
- 5.89×
- Total profit
- $41,051
- Equity at exit
- $4,473
- IRR
- 99.7%
- Equity multiple
- 14.72×
- Total profit
- $115,263
- Equity at exit
- $2,594
Cash invested: $8,400 (down + closing). Projections, not guarantees.
Landlord ↔ Tenant lean methodology
- Overall (STATE)
- 62 Landlord-Friendly
- State Pennsylvania
- 62 Landlord-Friendly · EVEN
- County
- — inherits STATE
- City
- — inherits STATE
ZIP-level market 15136
- Home prices YoY
- -30.4%
- Rents YoY
- 13.1%
- Active inventory
- 125
- Price-to-rent
- 2.1×
Monthly cashflow live
- Estimated rent
- $1,170 high interval (Pro) →
- Mortgage (P&I)
- −$157
- Tax from tax record
- −$66 /mo · $789/yr
- Insurance
- −$12
- Flood insurance flood zone
- −$66 /mo · $798/yr
- HOA
- −$0
- Vacancy / Maint / Mgmt
- −$246
- Net cashflow
- $623
Break-even live
UW: 25.0% down · 7.5% · 30yr · 1.5% tax · 5.0% vac · 8.0% maint · 8.0% mgmt
Financing live
Cash to close
- Down payment
- $7,500
- Closing costs
- $900
- Reserves months
- —
- Total cash needed
- —
Loan-product check · same deal, 3 products live
Conventional
25% down · 7.5% · 30yr
- Down + closing
- —
- Monthly P&I
- —
- Monthly cashflow
- —
- DSCR
- —
- Eligible?
- —
Personal DTI + credit; lowest rate.
DSCR
20% down · 8.5% · 30yr
- Down + closing
- —
- Monthly P&I
- —
- Monthly cashflow
- —
- DSCR
- —
- Eligible?
- —
No personal income docs; deal must DSCR.
Hard money
10% down · 12.0% · 12mo
- Down + closing
- —
- Monthly P&I
- —
- Monthly cashflow
- —
- DSCR
- —
- Eligible?
- —
Short-term bridge; refi at stabilization.
Rent comps 39 comps
| Address | Beds | Baths | Sqft | Rent | $/sqft | DOM | Units | Dist |
|---|---|---|---|---|---|---|---|---|
| 33 Greenough Ave Pittsburgh, PA | 2.0 | 1.0 | 900 | $1,300 | $1.44 | 44d | 1 | 0.64mi |
| 149 S Euclid Ave Unit 1 Pittsburgh, PA | 1.0 | 1.0 | 800 | $1,200 | $1.50 | 17d | 1 | 0.71mi |
| 219 Woodlawn Ave Pittsburgh, PA | 2.0 | 1.0 | 925 | $1,075 | $1.16 | 44d | 1 | 0.73mi |
| 136 Sheridan Ave Pittsburgh, PA | 1.0 | 1.0 | 625 | $890 | $1.42 | 24d | 1 | 0.73mi |
| 117 Crawford Ave Unit 2 Pittsburgh, PA | 1.0 | 1.0 | 700 | $900 | $1.29 | 44d | 1 | 0.80mi |
| 71-73 Sheridan Ave Unit 73 Pittsburgh, PA | 2.0 | 1.0 | 900 | $1,100 | $1.22 | 44d | 1 | 0.83mi |
| 614 Woodward Ave McKees Rocks, PA | 2.0 | 1.0 | 1000 | $950 | $0.95 | 8d | 1 | 0.85mi |
| 214 Erwin Pl Mc Kees Rocks, PA | 3.0 | 1.0 | 1026 | $1,685 | $1.64 | 44d | 1 | 0.86mi |
| 220 S Home Ave Pittsburgh, PA | 1.0 | 1.0 | 840 | $1,299 | $1.55 | 44d | 1 | 0.88mi |
| 145 Washington Ave Pittsburgh, PA | 1.0 | 1.0 | 650 | $950 | $1.46 | 44d | 1 | 0.91mi |
| 933 Woodward Ave Unit MC McKees Rocks, PA | 2.0 | 1.0 | 1100 | $1,400 | $1.27 | 24d | 1 | 0.92mi |
| 933 Woodward Ave Unit NA McKees Rocks, PA | 2.0 | 1.0 | 1100 | $1,400 | $1.27 | 20d | 1 | 0.92mi |
| 802 13th St Unit 2 McKees Rocks, PA | 2.0 | 1.0 | 1100 | $920 | $0.84 | 44d | 1 | 0.93mi |
| 705 Russellwood Ave Apt 1 McKees Rocks, PA | 2.0 | 1.0 | 800 | $1,549 | $1.94 | 24d | 1 | 0.94mi |
| 25 S Starr Ave Unit 14 Bellevue, PA | 1.0 | 1.0 | 600 | $899 | $1.50 | 11d | 1 | 0.97mi |
| 25 Grant Ave #1 Bellevue, PA | 1.0 | 1.0 | 950 | $1,095 | $1.15 | 2d | 1 | 0.99mi |
| 16 N Fremont Ave Pittsburgh, PA | 2.0 | 1.0 | 1000 | $1,100 | $1.10 | 44d | 1 | 1.03mi |
| 27 Rudolph St Mc Kees Rocks, PA | 3.0 | 1.0 | 1084 | $1,100 | $1.01 | 2d | 1 | 1.09mi |
| 60 Sumner Ave Bellevue, PA | 1.0 | 1.0 | 600 | $1,004 | $1.67 | 16d | 2 | 1.09mi |
| 214 Wright St Unit Na McKees Rocks, PA | 2.0 | 1.0 | 954 | $1,175 | $1.23 | 15d | 1 | 1.12mi |
| 464 Teece Ave Unit 4 Pittsburgh, PA | 1.0 | 1.0 | 950 | $1,200 | $1.26 | 17d | 1 | 1.12mi |
| 478 Teece Ave Pittsburgh, PA | 2.0 | 2.0 | 950 | $1,325 | $1.39 | 44d | 1 | 1.12mi |
| 118 Arch Ave Pittsburgh, PA | 2.0 | 1.0 | 850 | $1,100 | $1.29 | 24d | 1 | 1.14mi |
| 481 Dawson Ave Pittsburgh, PA | 1.0 | 1.0 | 560 | $850 | $1.52 | 44d | 1 | 1.16mi |
| 115 S Birmingham Ave Pittsburgh, PA | 3.0 | 1.0 | 850 | $1,175 | $1.38 | 4d | 1 | 1.21mi |
| 115 S Birmingham Ave Pittsburgh, PA | 3.0 | 1.0 | 850 | $1,145 | $1.35 | 44d | 1 | 1.21mi |
| 907 Chartiers Ave Unit 2 McKees Rocks, PA | 2.0 | 1.0 | 900 | $1,100 | $1.22 | 24d | 1 | 1.21mi |
| 110 N Fremont Ave #4 Pittsburgh, PA | 2.0 | 1.0 | 825 | $1,100 | $1.33 | 44d | 1 | 1.22mi |
| 521 Orchard Ave Bellevue, PA | 1.0 | 1.0 | 600 | $975 | $1.62 | 44d | 1 | 1.24mi |
| 504 Orchard Ave Bellevue, PA | 1.0 | 1.0 | 595 | $975 | $1.64 | 44d | 1 | 1.27mi |
| 626 California Ave Pittsburgh, PA | 2.0 | 1.0 | 850 | $970 | $1.14 | 21d | 1 | 1.28mi |
| 509 Forest Ave #2 Pittsburgh, PA | 2.0 | 1.0 | 1000 | $1,195 | $1.20 | 24d | 1 | 1.31mi |
| 114 Singer Ave McKees Rocks, PA | 1.0 | 1.0 | 650 | $800 | $1.23 | 44d | 1 | 1.33mi |
| 1 Balsam St Pittsburgh, PA | 2.0 | 2.0 | 900 | $1,300 | $1.44 | 44d | 1 | 1.37mi |
| 419 Florence Ave #2 Pittsburgh, PA | 3.0 | 1.0 | 1116 | $1,250 | $1.12 | 12d | 1 | 1.39mi |
| 902 Erdner Ave Unit 1 Pittsburgh, PA | 2.0 | 1.0 | 900 | $1,300 | $1.44 | 44d | 1 | 1.44mi |
| 516 Carolyn Ave Pittsburgh, PA | 3.0 | 2.0 | 840 | $1,850 | $2.20 | 24d | 1 | 1.44mi |
| 908 Erdner Ave Unit 3 Avalon, PA | 2.0 | 1.0 | 850 | $1,300 | $1.53 | 2d | 1 | 1.45mi |
| 908 Erdner Ave Avalon, PA | 2.0 | 1.0 | 850 | $1,350 | $1.59 | 4d | 1 | 1.45mi |
HOA detail condo
- Monthly dues
- $0 · $0/yr
- Assessments
- None detected in remarks — confirm with the listing agent.
Listing history 5 events
-
2026-03-31status Pending
-
2026-01-19status Active
-
2026-01-10status Pending
-
2025-12-01$30,000 Active
-
2014-07-02soldstatus $21,200
ⓘ Source: listings_history table (triggers on properties + properties_extension) + one-shot
backfill from property_details.listing_events for pre-trigger history.
Tax reassessment forecast PA · Partial reset (capped growth)
- Current annual tax
- $789 · $66/mo
- Projected year-2 tax
- $789 · $66/mo
- Expected delta
- $0/yr ($0/mo · 0.0%)
ⓘ Screening estimate from a state-policy table — verify with the county assessor before closing.
Climate risk First Street
- Flood 9/10 Extreme FEMA zone X (unshaded) · 99% chance over 30 yrs
- Wildfire 1/10 Low
- Heat 5/10 Major 7 d/yr ≥98°F today · 19 d/yr by 30 yrs out
- Wind 2/10 Low
- Air quality 3/10 Moderate 3 unhealthy d/yr today · 3 by 30 yrs out
Nearby sold comps map
Loading sold comps map…
Walkable amenities ~0.75 mi
Loading nearby amenities…
Taxation est. · year 1
- Rental income
- $14,044
- − Mortgage interest
- −$1,680
- − Property taxes
- −$789
- − Insurance
- −$948
- − Repairs & maintenance
- −$1,124
- − Management
- −$1,124
- − Depreciation
- −$873
- Taxable income
- $7,508
- Est. tax owed @ 24.0%
- −$1,802
- After-tax cash flow
- $5,669/yr
For passive investors: Depreciation is non-cash, so a rental often shows a tax loss while cash-flowing — sheltering income. Rental losses are passive: they offset passive income freely, and up to $25,000/yr can offset ordinary (W-2) income if you actively participate and your MAGI is under $100k (phasing out to $0 by $150k); unused losses carry forward. On sale, claimed depreciation is recaptured at up to 25%, and gains may owe capital-gains tax (a 1031 exchange can defer both). Figures are a year-1 estimate at your 24.0% rate — not tax advice; consult a CPA.
Schools (NCES district)
- District
- Sto-Rox SD
- NCES district ID
- 4222830
- Math proficiency
- 4% ▼ -5.00%
- Reading proficiency
- 18% ▼ -4.00%
- Median HH income
- $30,268
- Composite
- 8.51/100
- National rank
- #9904
- State rank
- #532 of 539 in PA
Livability — Bellevue
- Score
- 92/100
- State rank
- #9
- US rank
- #35
Category grades
Schools grade is shown separately in the Schools card above.
Census & demographics
- County
- Allegheny County · 1,022,028 people
- Metro
- Pittsburgh, PA
- Population (ZIP)
- 22,623
- Household income
- $69,099
- Rent vs Own
- Severe rent burden
- 768.0
Population outlook (Allegheny County) Hauer SSP2
- Today (2025)
- 1,250,282 people
- By 2030
- 1,256,482 · +0.5%
- By 2040
- 1,256,318 · +0.5%
- By 2050
- 1,244,169 · -0.5%
- By 2075
- 1,197,693 · -4.2%
- By 2100
- 1,093,187 · -12.6%
Race, ethnicity, and origin ACS 2023
- Neighborhood character
- Predominantly White (75%)
- Race & ethnicity
- White 75% Black 18% Two or more races 4% Hispanic / Latino 2%
- Common ancestry
- Romanian 10% Subsaharan African 3% Scotch-Irish 2%
- Foreign-born
- 3% · Canada
- Languages at home
- 96% English-only · Spanish 1% Other Indo-European 1%
Political lean MEDSL · Allegheny
- 2024 margin
- Strong D (+20.3) · D 59.7% · R 39.4%
- 2008→2024 swing
- +4.8pp toward D · 2008: 15.5pp · 2024: 20.3pp
- All cycles
- 2024: D+20.3 2020: D+20.4 2016: D+16.4 2012: D+14.4 2008: D+15.5
Not yet ingested
- Civics
- —
Market trends
- HPI YoY
- ▼ -107.07%
- Current HPI
- 244.6934
- Rent YoY
- ▲ 13.12%
- Metro
- Pittsburgh, PA
- State GDP YoY
- ▲ 1.68%
- F500 in state
- 34
Industry mix (Fortune 500 HQ in PA)
| Industry | F500 HQs | Revenue |
|---|---|---|
| Healthcare | 2 | $309B |
|
||
| Insurance | 2 | $27B |
|
||
| Telecommunications / Media | 1 | $124B |
|
||
| Industrial Distribution | 1 | $22B |
|
||
| Financial Services | 1 | $20B |
|
||
| Chemicals / Materials | 1 | $18B |
|
||
Price history
+41.5% since first listed5 events — show timeline
- 2026-03-31 Pending — West Penn MLS
- 2026-01-19 Relisted — West Penn MLS
- 2026-01-10 Pending — West Penn MLS
- 2025-12-01 Listed $30,000 West Penn MLS
- 2014-07-02 Sold (Public Records) $21,200 Public Records
Property tax history
+2.2%/yrLatest (2026): $789 · +4.0% YoY. Source: county tax records.
Cash-flow waterfall
monthlySold comps — $/sqft
last 12 mo · ≤1 miLoading sold comps…