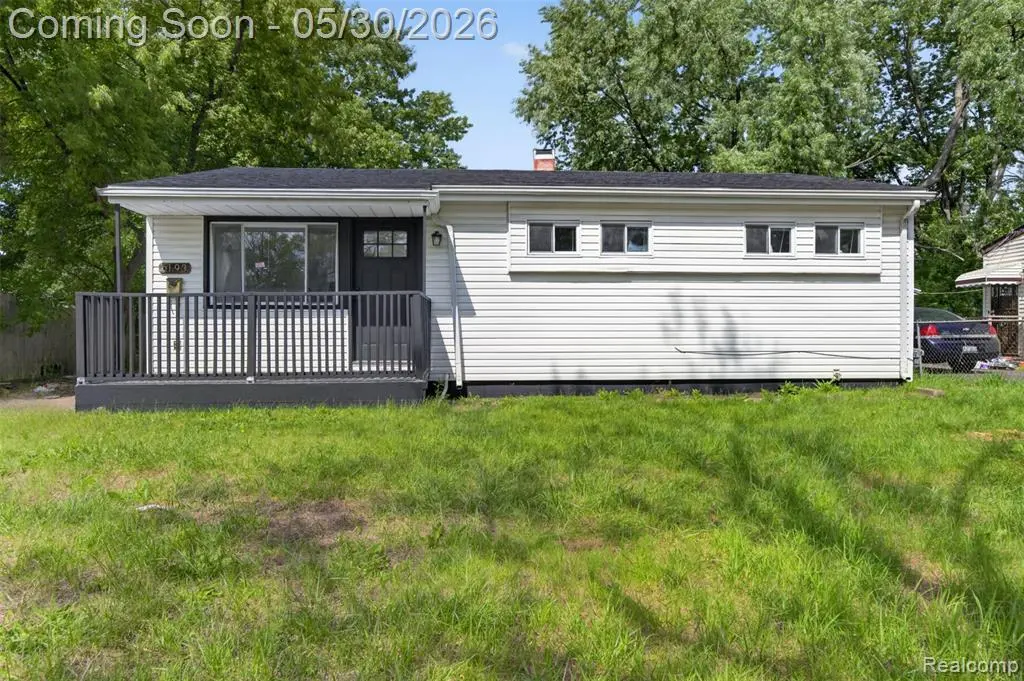
6193 Natchez Dr · Beecher, MI
Flood risk 1/10 · Minimal
- FEMA flood zone
- X (unshaded)
- Chance of flooding over 30 yrs
- 0.0%
- Est. flood insurance / yr
- $473 – $860
Fire risk 1/10 · Minimal
- Est. fire insurance / yr
- $784 – $1,456
Heat risk 2/10 · Minimal
- Hot days now (above 97°F)
- 7 days/yr
- Hot days in 30 yrs
- 14 days/yr
Wind risk 2/10 · Minimal
- Chance of severe wind over 30 yrs
- —
Air-quality risk 2/10 · Minimal
- Unhealthy air days now
- 1 days/yr
- Unhealthy air days in 30 yrs
- 3 days/yr
Risk factors via First Street. Map © Google.
Why this score? — see what drove the F grade
The composite is a weighted blend of 9 inputs, each scored 0–100. Each bar is that input's sub-score; the figure is the points it added to the 100-point composite (weight × sub-score).
- Cash flow +15.9/30.0
- DSCR +4.9/10.0
- 1% rule +3.6/10.0
- Livability +3.0/5.0
- Rent growth +2.5/5.0
- Condition / age +2.5/5.0
- Schools +1.0/10.0
- ARV discount +0.0/15.0
- Appreciation +0.0/10.0
$129,999
🖨 Deal sheet (PDF) 📄 Offer letter ✓ Due diligence
Listing remarks
Completely remodeled in 2026, this move-in ready home in Mount Morris offers modern updates and plenty of living space throughout! Featuring new luxury vinyl flooring, fresh paint, updated lighting fixtures, and a beautifully renovated kitchen with new cabinets, sink, tile, and stylish backsplash. New Roof, Furnace, Water Heater all installed in 2026. The main level offers 3 bedrooms, 1 full bath, a spacious living room, and an additional family room providing plenty of room for entertaining or relaxing. The basement adds even more functional living space with a 4th bedroom complete with a closet. A laundry area, and a large recreation/second family room and great storage area. Convenientl
Key facts
- 6,098 sq ft lot
- Garage
- Built 1959
Property features AI
Exterior
- Parking: Detached garage with electricity (1.5 parking spaces)
- Utilities: Natural gas for heat and water heater; Central A/C; No water utility specified
- Home design: Residential property; 1-story structure; Built in 1959
- Construction: Vinyl siding; Basement foundation
- Exterior features: Exterior balcony; Paved street access; Frontage approximately 60 feet
Interior
- Bedrooms: Three bedrooms on the entry level (approx. 12 x 12, 12 x 12, 12 wide)
- Flooring: Concrete flooring in great room and laundry; Ceramic flooring in bathroom
- Bathrooms: One full bathroom with ceramic flooring (entry level, approx. 12 x 6)
- Heating & cooling: Forced air heating; Central air conditioning; Natural gas fuel
- Interior features: Total of 10 rooms; Partially finished basement; Basement great room (concrete flooring)
- Laundry & utility: Laundry room in the basement (concrete flooring, approx. 14 x 14); Gas water heater
Neighborhood map
What this means for you Summary
Snapshot
- This is a 3-bed/1.0-bath single-family listed at $130k.
Deal economics
- At list price, monthly cash flow is $61 ($737/yr) — positive.
- The deal already cash-flows at list — no discount required.
- To meet the 1% rule (rent ≥ 1% of price), the offer needs to be $112k (14.0% below list).
- Recommended offer: $112k (14.0% below list) — sets the bar for 1% rule.
- Cap rate 6.9% vs local median 11.4% in Beecher — below-typical yield; the buyer is paying a premium for something (appreciation thesis, condition, location) that the cap rate doesn't capture.
Location & tenants
- Location reads 59/100 on livability (#603 in MI) — a working-class tenant base; expect higher turnover. Strengths: cost of living A+, housing A-; Watch: crime F, amenities F, commute F.
- Beecher Community School District (suburban): math 7% / reading 10% proficiency, ranked #722 of 760 in MI (top 95%) — low school quality limits family demand, transient renter base, plan for 1-2y turnover; 90% free/reduced lunch — lower-income household profile, screen leases tightly.
- Zoned schools: Dailey Elementary School (math 2% / reading 8%, grade F, #1,325 of 1,397 statewide, top 99%, 312 students, 96% FRL); Beecher High School (math 5% / reading 15%, grade F, #659 of 713 statewide, top 97%, 262 students, 94% FRL).
- Market conditions: 144 active listings in the ZIP; 6 comparable units currently listed for rent nearby; rentals lingering (median 45d on market — plan ~5-8 weeks vacancy on turnover, expect pricing pressure); 50% of comp listings sitting > 30 days — soft ceiling on asking rent; 419 units permitted in Genesee County in 2024 (68 in 5+ unit buildings).
Forward outlook
- Local home prices are declining (-3.0%/yr); year-one equity from $899 of loan paydown is wiped out by about $4k of value loss. Plan a longer hold.
- Genesee County population projected at -27% by 2050 — secular population decline; favor cash flow + early exit over multi-decade hold.
Negotiation context
- It's been on market 23 days — a 2% lower offer ($128k) is reasonable based on typical stale-listing flexibility.
- 2 sale attempts since 23y ago; this cycle's ask is 797% above the opening price — seller raised mid-cycle; expect resistance to lowballs.
- Current owner paid $68k; list at $130k implies a 93% gain — meaningful room to come down on a strong offer.
Risks & watch-outs
- Watch-outs: built in 1959 — expect roof / HVAC / electrical / plumbing capex.
Questions for the listing agent
- Built in 1959 — when were the roof, HVAC, electrical panel, plumbing, and water heater last replaced?
- Is there a deadline driving the sale (1031 exchange, divorce, estate, relocation)? That informs how much negotiation room exists.
- Crime grade is F in this area — have there been break-ins, vandalism, or insurance claims at this property in the last 3 years? What carrier currently insures it and at what premium?
- The area grade is low — what's the realistic commute time and amenity access for the typical tenant pool here? Any planned neighborhood developments (good or bad) we should know about?
- What's the average days-on-market for RENTAL listings here right now (not sales)? A rising rental-DOM trend means longer vacancies and softer asking-rent achievability than the comps imply.
- What's the recent tenant-quality profile in this submarket — average credit score on applications, eviction rate, late-payment / NSF rate, and stable-employment percentage? A property-management company in the area should have these aggregated.
- How much new for-sale + rental construction is in the pipeline within 1–3 miles? Heavy new supply typically softens prices + rents 12–24 months out; constrained supply supports both.
Investment metrics
- 1% rule
- 0.86% ✗
- Cap rate
- 6.86%
- Cash-on-cash
- 2.02%
- DSCR
- 1.09
- GRM
- 9.7
CMA / ARV
- ARV (on-the-fly)
- $102,700
- Comps found
- 12
Show comp detail 12 sales within ~0.75 mi
| Address | Dist | Beds/Ba | Sqft | Sold | Price | $/sf | Match |
|---|---|---|---|---|---|---|---|
| 1207 Orange Blossom Dr | 0.34mi | 3/1.0 | 1,600 (+1%) | 6mo | $77,000 | $48 | 77 |
| 6164 Natchez Dr | 0.06mi | 3/1.0 | 1,416 (-10%) | 6mo | $90,000 | $64 | 75 |
| 6094 Penwood Rd | 0.26mi | 4/1.0 (+1) | 1,480 (-6%) | 3mo | $122,000 | $82 | 70 |
| 6149 Flowerday Dr | 0.28mi | 3/1.5 | 1,468 (-7%) | 8mo | $5,000 | $3 | 67 |
| 1278 W Klein St | 0.42mi | 3/1.0 | 1,744 (+10%) | 1mo | $132,000 | $76 | 62 |
| 1169 Oleander Dr | 0.42mi | 4/1.5 (+1) | 1,450 (-8%) | 5mo | $105,000 | $72 | 55 |
| 1627 Mcalpine Dr | 0.56mi | 3/2.5 | 1,425 (-10%) | 0mo | $230,000 | $161 | 51 |
| 1617 Mcalpine Dr | 0.53mi | 3/1.5 | 1,739 (+10%) | 7mo | $243,000 | $140 | 51 |
| 1163 Peachtree Dr | 0.50mi | 3/1.5 | 1,350 (-15%) | 4mo | $34,500 | $26 | 47 |
| 2210 O'brien Rd | 0.72mi | 3/2.0 | 1,450 (-8%) | 4mo | $94,900 | $65 | 45 |
| 1432 Charwood Rd | 0.31mi | 2/1.5 (-1) | 1,353 (-14%) | 12mo | $45,000 | $33 | 45 |
| 5482 Harvard St | 0.57mi | 3/1.0 | 1,808 (+14%) | 12mo | $73,500 | $41 | 39 |
Match score weights: distance 35% · size 25% · config 20% · recency 20%. Top-matched comps best support the ARV.
Projected returns pro-forma
-3.0% appreciation · 3.0% rent growth · sell at horizon
- IRR
- -13.1%
- Equity multiple
- 0.53×
- Total profit
- $-17,185
- Equity at exit
- $19,383
- IRR
- -4.2%
- Equity multiple
- 0.72×
- Total profit
- $-10,050
- Equity at exit
- $11,240
Cash invested: $36,400 (down + closing). Projections, not guarantees.
Landlord ↔ Tenant lean methodology
- Overall (STATE)
- 62 Landlord-Friendly
- State Michigan
- 62 Landlord-Friendly · EVEN
- County
- — inherits STATE
- City
- — inherits STATE
ZIP-level market 48458
- Home prices YoY
- -16.0%
- Active inventory
- 144
- Price-to-rent
- 9.7×
Monthly cashflow live
- Estimated rent
- $1,119 high interval (Pro) →
- Mortgage (P&I)
- −$682
- Tax from tax record
- −$86 /mo · $1,037/yr
- Insurance
- −$54
- HOA
- −$0
- Vacancy / Maint / Mgmt
- −$235
- Net cashflow
- $61
Break-even live
Sensitivity live
| Price | -10% $135 | -5% $98 | +0% $61 | +5% $25 | +10% $-12 |
|---|---|---|---|---|---|
| Rent | -10% $-27 | -5% $17 | +0% $61 | +5% $106 | +10% $150 |
| Rate | -1.0pp $127 | -0.5pp $94 | base $61 | +0.5pp $28 | +1.0pp $-7 |
UW: 25.0% down · 7.5% · 30yr · 1.5% tax · 5.0% vac · 8.0% maint · 8.0% mgmt
Financing live
Cash to close
- Down payment
- $32,500
- Closing costs
- $3,900
- Reserves months
- —
- Total cash needed
- —
Loan-product check · same deal, 3 products live
Conventional
25% down · 7.5% · 30yr
- Down + closing
- —
- Monthly P&I
- —
- Monthly cashflow
- —
- DSCR
- —
- Eligible?
- —
Personal DTI + credit; lowest rate.
DSCR
20% down · 8.5% · 30yr
- Down + closing
- —
- Monthly P&I
- —
- Monthly cashflow
- —
- DSCR
- —
- Eligible?
- —
No personal income docs; deal must DSCR.
Hard money
10% down · 12.0% · 12mo
- Down + closing
- —
- Monthly P&I
- —
- Monthly cashflow
- —
- DSCR
- —
- Eligible?
- —
Short-term bridge; refi at stabilization.
Rent comps 6 comps
| Address | Beds | Baths | Sqft | Rent | $/sqft | DOM | Units | Dist |
|---|---|---|---|---|---|---|---|---|
| 6230 Natchez Dr Mount Morris, MI | 3.0 | 1.0 | 1060 | $1,000 | $0.94 | 15d | 1 | 0.05mi |
| 6113 Natchez Dr Mount Morris, MI | 3.0 | 1.0 | 1100 | $990 | $0.90 | 45d | 1 | 0.18mi |
| 48 Sunny Ln Mount Morris, MI | 3.0 | 2.0 | 1900 | $1,100 | $0.58 | 45d | 1 | 0.53mi |
| 1 Sunny Ln Mount Morris, MI | 3.0 | 2.0 | 1100 | $1,100 | $1.00 | 45d | 1 | 0.54mi |
| 2216 Obrien Rd Mount Morris, MI | 3.0 | 2.0 | 1080 | $1,000 | $0.93 | 15d | 1 | 0.74mi |
| 5280 Cedar Shores Ct Flint, MI | 2.0–3.0 | 2.0 | 1150 | $1,148 | $1.00 | 15d | 6 | 1.46mi |
Listing history 24 events
-
2026-06-21days on market $129,999 Active 23 DOM
-
2026-06-18days on market $129,999 Active 20 DOM
-
2026-06-17days on market $129,999 Active 19 DOM
-
2026-06-16days on market $129,999 Active 18 DOM
-
2026-06-15days on market $129,999 Active 17 DOM
-
2026-06-14days on market $129,999 Active 15 DOM
-
2026-06-13days on market $129,999 Active 14 DOM
-
2026-06-10days on market $129,999 Active 12 DOM
-
2026-06-09days on market $129,999 Active 11 DOM
-
2026-06-08days on market $129,999 Active 10 DOM
-
2026-06-07days on market $129,999 Active 9 DOM
-
2026-06-03days on market $129,999 Active 5 DOM
-
2026-06-02days on market $129,999 Active 4 DOM
-
2026-06-01days on market $129,999 Active 3 DOM
-
2026-05-31days on market $129,999 Active 2 DOM
-
2026-05-30statusdays on market $129,999 Active 1 DOM
-
2026-05-24historical $129,999
-
2004-07-14soldstatus $67,500
-
2004-02-06soldstatus $14,000
-
2003-12-17soldstatus $14,000
-
2003-12-17soldstatus $14,000
-
2003-11-19historical
-
2003-10-27$14,500
-
2003-10-27$14,500
ⓘ Source: listings_history table (triggers on properties + properties_extension) + one-shot
backfill from property_details.listing_events for pre-trigger history.
Tax reassessment forecast MI · Partial reset (capped growth)
- Current annual tax
- $1,037 · $86/mo
- Projected year-2 tax
- $1,519 · $127/mo
- Expected delta
- +$483/yr (+$40/mo · 46.5%)
ⓘ Screening estimate from a state-policy table — verify with the county assessor before closing.
Climate risk First Street
- Flood 1/10 Low FEMA zone X (unshaded) · 0% chance over 30 yrs
- Wildfire 1/10 Low
- Heat 2/10 Low 7 d/yr ≥97°F today · 14 d/yr by 30 yrs out
- Wind 2/10 Low
- Air quality 2/10 Low 1 unhealthy d/yr today · 3 by 30 yrs out
Nearby sold comps map
Loading sold comps map…
Walkable amenities ~0.75 mi
Loading nearby amenities…
Taxation est. · year 1
- Rental income
- $13,423
- − Mortgage interest
- −$7,282
- − Property taxes
- −$1,037
- − Insurance
- −$650
- − Repairs & maintenance
- −$1,074
- − Management
- −$1,074
- − Depreciation
- −$3,782
- Taxable loss
- −$1,475
- Est. tax savings @ 24.0%
- +$354
- After-tax cash flow
- $1,091/yr
For passive investors: Depreciation is non-cash, so a rental often shows a tax loss while cash-flowing — sheltering income. Rental losses are passive: they offset passive income freely, and up to $25,000/yr can offset ordinary (W-2) income if you actively participate and your MAGI is under $100k (phasing out to $0 by $150k); unused losses carry forward. On sale, claimed depreciation is recaptured at up to 25%, and gains may owe capital-gains tax (a 1031 exchange can defer both). Figures are a year-1 estimate at your 24.0% rate — not tax advice; consult a CPA.
Schools (NCES district)
- District
- Beecher Community School District
- NCES district ID
- 2604500
- Math proficiency
- 7% ▲ 3.00%
- Reading proficiency
- 10% ▼ -2.00%
- Median HH income
- $27,719
- Composite
- 9.96/100
- National rank
- #14685
- State rank
- #722 of 760 in MI
Livability — Beecher
- Score
- 59/100
- State rank
- #603
- US rank
- #19782
Category grades
Schools grade is shown separately in the Schools card above.
Census & demographics
- Census place
- Beecher, MI
- County
- Genesee County · 221,329 people
- Metro
- Flint, MI
- Population (ZIP)
- 19,519
- Household income
- $46,797
- Rent vs Own
- Severe rent burden
- 724.0
Population outlook (Genesee County) Hauer SSP2
- Today (2025)
- 381,312 people
- By 2030
- 362,731 · -4.9%
- By 2040
- 321,550 · -15.7%
- By 2050
- 279,212 · -26.8%
- By 2075
- 193,336 · -49.3%
- By 2100
- 128,118 · -66.4%
Race, ethnicity, and origin ACS 2023
- Neighborhood character
- Predominantly White (66%)
- Race & ethnicity
- White 66% Black 22% Two or more races 7% Hispanic / Latino 7%
- Hispanic origin (detail)
- Mexican 5%
- Common ancestry
- Lithuanian 5% Romanian 3% Slovak 1%
- Foreign-born
- 2% · Canada
- Languages at home
- 97% English-only · Spanish 2%
Political lean MEDSL · Genesee
- 2024 margin
- Toss-up / Even · D 51.4% · R 47.2% · Other 1.4%
- 2008→2024 swing
- -28.3pp toward R · 2008: 32.5pp · 2024: 4.2pp
- All cycles
- 2024: D+4.2 2020: D+9.3 2016: D+9.5 2012: D+28.2 2008: D+32.5
Not yet ingested
- Civics
- —
Market trends
- HPI YoY
- ▼ -46.45%
- Current HPI
- 244.2061
- Rent YoY
- —
- Metro
- Flint, MI
- State GDP YoY
- ▲ 1.37%
- F500 in state
- 28
Industry mix (Fortune 500 HQ in MI)
| Industry | F500 HQs | Revenue |
|---|---|---|
| Automotive Parts | 3 | $48B |
|
||
| Automotive | 2 | $372B |
|
||
| Chemicals | 1 | $45B |
|
||
| Automotive Retail | 1 | $29B |
|
||
| Healthcare / Medical Devices | 1 | $23B |
|
||
| Automotive Technology | 1 | $20B |
|
||
Price history
+796.5% since first listed8 events — show timeline
- 2026-05-24 Coming Soon $129,999 MiRealSource-MiMLS
- 2004-07-14 Sold (Public Records) $67,500 Public Records
- 2004-02-06 Sold (Public Records) $14,000 Public Records
- 2003-12-17 Sold (MLS) $14,000 REALCOMP
- 2003-12-17 Sold (MLS) $14,000 MiRealSource-MiMLS
- 2003-11-19 Listing Removed — MiRealSource-MiMLS
- 2003-10-27 Listed $14,500 REALCOMP
- 2003-10-27 Listed $14,500 MiRealSource-MiMLS
Property tax history
+3.0%/yrLatest (2025): $1,037 · +1.3% YoY. Source: county tax records.
Cash-flow waterfall
monthlySold comps — $/sqft
last 12 mo · ≤1 miLoading sold comps…