3 Memory Ln #8 · Branson, MO
Flood risk 1/10 · Minimal
- FEMA flood zone
- X (unshaded)
- Chance of flooding over 30 yrs
- 0.0%
- Est. flood insurance / yr
- $473 – $860
Fire risk 3/10 · Minor
- Est. fire insurance / yr
- $1,054 – $1,958
Heat risk 6/10 · Moderate
- Hot days now (above 105°F)
- 7 days/yr
- Hot days in 30 yrs
- 22 days/yr
Wind risk 2/10 · Minimal
- Chance of severe wind over 30 yrs
- 1.0%
Air-quality risk 2/10 · Minimal
- Unhealthy air days now
- 0 days/yr
- Unhealthy air days in 30 yrs
- 1 days/yr
Risk factors via First Street. Map © Google.
Why this score? — see what drove the D grade
The composite is a weighted blend of 9 inputs, each scored 0–100. Each bar is that input's sub-score; the figure is the points it added to the 100-point composite (weight × sub-score).
- Cash flow +12.2/30.0
- ARV discount +7.5/15.0
- Schools +4.2/10.0
- Livability +3.9/5.0
- DSCR +3.6/10.0
- 1% rule +3.5/10.0
- Rent growth +3.2/5.0
- Condition / age +2.5/5.0
- Appreciation +0.0/10.0
$179,900
🖨 Deal sheet 📄 Offer letter ✓ Due diligence
Listing remarks MLS
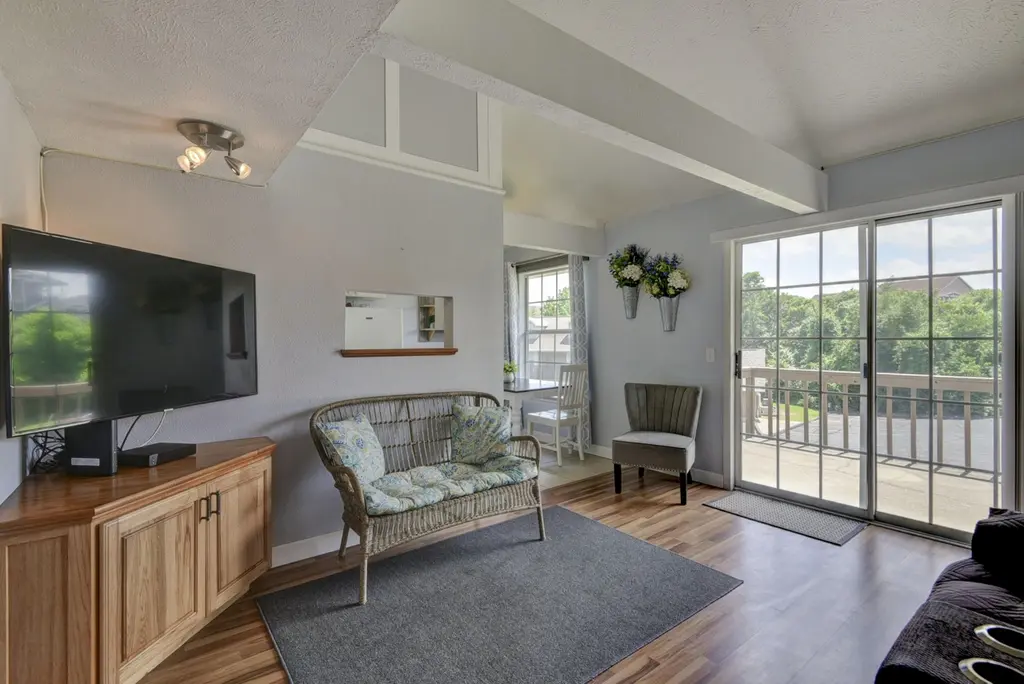
Here it is, the unicorn you've been looking for! This fully furnished, turn-key unit has everything you need in a neat and clean package. On the main level you'll find one bedroom with queen bed, full bathroom with washer and dryer, living room with sofa sleeper, and a rare find; a full kitchen! Upstairs you'll find the loft area with queen bed (considered bedroom #2), bathroom, and a bonus bedroom with queen bed (considered bedroom #3, accessed through loft bedroom #2). You read that right, there are three queen beds, plus a sofa sleeper, meaning there's room for the whole crew! Looking for an investment property? This unit had a solid 2023 and an even better 2024! Whether you're in the market for a full-time home, vacation home, or income property, this unit covers it all!
Key facts
- Full sized kitchen
- Private balcony
- Finished bonus space
Tags
Property features AI
Finance
- HOA & community: Monthly association fee (includes insurance and trash)
Exterior
- Utilities: Public water; Public sewer; Cable available
- Home design: Residential condominium
- Exterior features: Asphalt road surface
Interior
- Kitchen: Electric oven; Free-standing electric oven; Dishwasher; Microwave; Electric water heater
- Flooring: Carpet; Linoleum; Tile
- Bathrooms: 2 full bathrooms
- Heating & cooling: Central heating (electric); Ceiling fan(s); Has cooling
- Interior features: High ceilings; Walk-in closet(s)
- Laundry & utility: Washer; Dryer; Laundry on main level
Neighborhood map
What this means for you Summary
Snapshot
- This is a 3-bed/2.0-bath condo listed at $180k.
Deal economics
- At list price, monthly cash flow is $-38 ($-453/yr) — negative.
- To cash-flow at today's rent, offer at most $173k (3.7% below list).
- To meet the 1% rule (rent ≥ 1% of price), the offer needs to be $153k (14.9% below list).
- Recommended offer: $153k (14.9% below list) — sets the bar for 1% rule.
- Cap rate 6.0% vs local median 2.5% in Branson — top-decile yield for the area; either an underpriced asset or a hidden risk that comps aren't pricing in. Stress-test before assuming the spread holds.
Location & tenants
- Location reads 77/100 on livability (#32 in MO, #2,940 nationally) — a middle-class / working-renter tenant base. Strengths: commute A+, cost of living A+, health & safety A+; Watch: employment C-, crime F.
- Branson R-IV (rural): math 48% / reading 52% proficiency, ranked #44 of 324 in MO (top 14%) — acceptable for families but not a draw, mixed tenant base, ~2y average lease.
- Zoned schools: Cedar Ridge Primary (345 students, 72% FRL); Branson Jr. High (math 48% / reading 49%, grade C-, #81 of 391 statewide, top 21%, 724 students, 51% FRL); Branson High (math 42% / reading 56%, grade D, #145 of 521 statewide, top 28%, 1,423 students, 46% FRL).
- Market conditions: Rents rising (+2.9%/yr); 1048 active listings in the ZIP; 7 comparable units currently listed for rent nearby; rentals lingering (median 44d on market — plan ~5-8 weeks vacancy on turnover, expect pricing pressure); 100% of comp listings sitting > 30 days — soft ceiling on asking rent; 331 units permitted in Taney County in 2024 (50 in 5+ unit buildings).
- This rent runs 30% of the median local income ($60k/yr) — at the standard rent-burdened threshold; future hikes will face affordability resistance.
Forward outlook
- Local home prices are declining (-3.0%/yr); year-one equity from $1k of loan paydown is wiped out by about $5k of value loss. Plan a longer hold.
- Taney County population projected at +17% by 2050 — long-run rental-demand tailwind backs the buy-and-hold thesis.
Negotiation context
- Only 7 days on market — expect competitive offers; lowballing is unlikely to land.
- 6 sale attempts since 10y ago with the ask held roughly flat each time — persistent listings suggest the price (not the market) is what's stuck; bring a comps-based counter.
Risks & watch-outs
- Climate carrying-cost: extreme-heat days projected 7→22/yr by 2055 (HVAC capex compounding) — expect insurance premiums to compound above CPI over the hold.
Questions for the listing agent
- What do current leases actually rent for vs. the listed asking? Can we see a recent rent roll and the last 12 months of T-12 income?
- What does the HOA fee cover, when was the last increase, and are there any pending special assessments or reserve-fund shortfalls?
- Any open or pending special assessments — roof, HVAC, plumbing, elevator, façade? What's the per-unit balance and payoff schedule, and is the seller paying it off at close or rolling it to the buyer?
- Is there a deadline driving the sale (1031 exchange, divorce, estate, relocation)? That informs how much negotiation room exists.
- Crime grade is F in this area — have there been break-ins, vandalism, or insurance claims at this property in the last 3 years? What carrier currently insures it and at what premium?
- The area grade is low — what's the realistic commute time and amenity access for the typical tenant pool here? Any planned neighborhood developments (good or bad) we should know about?
- What's the average days-on-market for RENTAL listings here right now (not sales)? A rising rental-DOM trend means longer vacancies and softer asking-rent achievability than the comps imply.
- What's the recent tenant-quality profile in this submarket — average credit score on applications, eviction rate, late-payment / NSF rate, and stable-employment percentage? A property-management company in the area should have these aggregated.
- How much new apartment / multifamily construction is in the pipeline within 1–3 miles? Heavy new supply (>2% of stock underway) typically softens rents 12–24 months out; light construction supports rent growth.
Investment metrics
- 1% rule
- 0.85% ✗
- Cap rate
- 6.04%
- Cash-on-cash
- -0.90%
- DSCR
- 0.96
- GRM
- 9.8
CMA / ARV
No comps found within radius.
Projected returns pro-forma
-3.0% appreciation · 2.9% rent growth · sell at horizon
- IRR
- -17.9%
- Equity multiple
- 0.37×
- Total profit
- $-31,684
- Equity at exit
- $26,824
- IRR
- -10.2%
- Equity multiple
- 0.38×
- Total profit
- $-31,211
- Equity at exit
- $15,554
Cash invested: $50,372 (down + closing). Projections, not guarantees.
Landlord ↔ Tenant lean methodology
- Overall (STATE)
- 81 Strongly Landlord-Friendly
- State Missouri
- 81 Strongly Landlord-Friendly · R+10
- County
- — inherits STATE
- City
- — inherits STATE
ZIP-level market 65616
- Home prices YoY
- -24.3%
- Rents YoY
- 2.9%
- Active inventory
- 1048
- Price-to-rent
- 9.8×
Monthly cashflow live
- Estimated rent
- $1,532 high interval (Pro) →
- Mortgage (P&I)
- −$943
- Tax from tax record
- −$53 /mo · $642/yr
- Insurance
- −$75
- HOA
- −$176
- Vacancy / Maint / Mgmt
- −$322
- Net cashflow
- $-38
Break-even live
UW: 25.0% down · 7.5% · 30yr · 1.5% tax · 5.0% vac · 8.0% maint · 8.0% mgmt
Financing live
Cash to close
- Down payment
- $44,975
- Closing costs
- $5,397
- Reserves months
- —
- Total cash needed
- —
Loan-product check · same deal, 3 products live
Conventional
25% down · 7.5% · 30yr
- Down + closing
- —
- Monthly P&I
- —
- Monthly cashflow
- —
- DSCR
- —
- Eligible?
- —
Personal DTI + credit; lowest rate.
DSCR
20% down · 8.5% · 30yr
- Down + closing
- —
- Monthly P&I
- —
- Monthly cashflow
- —
- DSCR
- —
- Eligible?
- —
No personal income docs; deal must DSCR.
Hard money
10% down · 12.0% · 12mo
- Down + closing
- —
- Monthly P&I
- —
- Monthly cashflow
- —
- DSCR
- —
- Eligible?
- —
Short-term bridge; refi at stabilization.
Rent comps 7 comps
| Address | Beds | Baths | Sqft | Rent | $/sqft | DOM | Units | Dist |
|---|---|---|---|---|---|---|---|---|
| 34 Golfshores Dr #6 Branson, MO | 2.0 | 2.0 | 1032 | $1,500 | $1.45 | 44d | 1 | 0.11mi |
| 25 Fall Creek Trl #8 Branson, MO | 2.0 | 2.0 | 859 | $900 | $1.05 | 44d | 1 | 0.39mi |
| 161 Avondale Dr #12 Branson, MO | 2.0 | 2.0 | 1207 | $1,490 | $1.23 | 44d | 1 | 0.51mi |
| 540 Abby Ln #8 Branson, MO | 2.0 | 2.0 | 1000 | $1,100 | $1.10 | 44d | 1 | 0.52mi |
| 193 Avondale Dr Branson, MO | 2.0 | 2.0 | 1215 | $1,638 | $1.35 | 44d | 2 | 0.58mi |
| 680 Fall Creek Dr Apt 10 Branson, MO | 2.0 | 2.0 | 750 | $1,295 | $1.73 | 44d | 1 | 0.60mi |
| 3245 Falls Pkwy Unit 335 Branson, MO | 2.0 | 2.0 | 864 | $995 | $1.15 | 44d | 1 | 1.43mi |
HOA detail condo
- Monthly dues
- $176 · $2,112/yr
- Assessments
- None detected in remarks — confirm with the listing agent.
Listing history 7 events
-
2026-06-19days on market $179,900 Active 7 DOM
-
2026-06-18days on market $179,900 Active 6 DOM
-
2026-06-17days on market $179,900 Active 5 DOM
-
2026-06-16days on market $179,900 Active 4 DOM
-
2026-06-15days on market $179,900 Active 3 DOM
-
2026-06-13remarks 699-char remark
-
2026-06-13$179,900 Active 1 DOM
ⓘ Source: listings_history table (triggers on properties + properties_extension) + one-shot
backfill from property_details.listing_events for pre-trigger history.
Tax reassessment forecast MO · Resets to sale price
- Current annual tax
- $642 · $53/mo
- Projected year-2 tax
- $1,745 · $145/mo
- Expected delta
- +$1,103/yr (+$92/mo · 172.0%)
ⓘ Screening estimate from a state-policy table — verify with the county assessor before closing.
Climate risk First Street
- Flood 1/10 Low FEMA zone X (unshaded) · 0% chance over 30 yrs
- Wildfire 3/10 Moderate
- Heat 6/10 Major 7 d/yr ≥105°F today · 22 d/yr by 30 yrs out
- Wind 2/10 Low 100% chance of damaging wind over 30 yrs
- Air quality 2/10 Low 0 unhealthy d/yr today · 1 by 30 yrs out
Nearby sold comps map
Loading sold comps map…
Walkable amenities ~0.75 mi
Loading nearby amenities…
Taxation est. · year 1
- Rental income
- $18,381
- − Mortgage interest
- −$10,077
- − Property taxes
- −$642
- − Insurance
- −$900
- − Repairs & maintenance
- −$1,470
- − Management
- −$1,470
- − HOA
- −$2,112
- − Depreciation
- −$5,233
- Taxable loss
- −$3,524
- Est. tax savings @ 24.0%
- +$846
- After-tax cash flow
- $393/yr
For passive investors: Depreciation is non-cash, so a rental often shows a tax loss while cash-flowing — sheltering income. Rental losses are passive: they offset passive income freely, and up to $25,000/yr can offset ordinary (W-2) income if you actively participate and your MAGI is under $100k (phasing out to $0 by $150k); unused losses carry forward. On sale, claimed depreciation is recaptured at up to 25%, and gains may owe capital-gains tax (a 1031 exchange can defer both). Figures are a year-1 estimate at your 24.0% rate — not tax advice; consult a CPA.
Schools (NCES district)
- District
- Branson R-IV
- NCES district ID
- 2905760
- Math proficiency
- 48% ▼ -6.00%
- Reading proficiency
- 52% ▼ -3.00%
- Median HH income
- $41,473
- Composite
- 41.96/100
- National rank
- #3347
- State rank
- #44 of 324 in MO
Livability — Branson
- Score
- 77/100
- State rank
- #32
- US rank
- #2940
Category grades
Schools grade is shown separately in the Schools card above.
Census & demographics
- Census place
- Branson, MO
- County
- Taney County · 28,460 people
- City population
- 28,460
- Metro
- Branson, MO
- Population (ZIP)
- 28,460
- Household income
- $60,489
- Rent vs Own
- Severe rent burden
- 1065.0
Population outlook (Taney County) Hauer SSP2
- Today (2025)
- 59,017 people
- By 2030
- 61,235 · +3.8%
- By 2040
- 65,225 · +10.5%
- By 2050
- 68,842 · +16.6%
- By 2075
- 77,705 · +31.7%
- By 2100
- 82,002 · +38.9%
Race, ethnicity, and origin ACS 2023
- Neighborhood character
- Predominantly White (82%)
- Race & ethnicity
- White 82% Two or more races 10% Hispanic / Latino 10% Black 2% Asian 2%
- Hispanic origin (detail)
- Mexican 6% Puerto Rican 2%
- Common ancestry
- Italian 4% Lithuanian 3% Slovak 2%
- Foreign-born
- 5% · Canada
- Languages at home
- 89% English-only · Spanish 7% Other Indo-European 1% Russian/Polish/Slavic 1%
Political lean MEDSL · Taney
- 2024 margin
- Solid R (+59.3) · D 19.9% · R 79.2%
- 2008→2024 swing
- -22.2pp toward R · 2008: -37.2pp · 2024: -59.3pp
- All cycles
- 2024: R+59.3 2020: R+57.7 2016: R+59.3 2012: R+47.4 2008: R+37.2
Not yet ingested
- Civics
- —
Market trends
- HPI YoY
- ▼ -64.45%
- Current HPI
- 200.8392
- Rent YoY
- ▲ 2.90%
- Metro
- Branson, MO
- State GDP YoY
- ▲ 1.84%
- F500 in state
- 20
Industry mix (Fortune 500 HQ in MO)
| Industry | F500 HQs | Revenue |
|---|---|---|
| Healthcare | 1 | $163B |
|
||
| Insurance | 1 | $21B |
|
||
| Industrial Technology | 1 | $17B |
|
||
| Retail | 1 | $16B |
|
||
| Industrial Distribution | 1 | $10B |
|
||
| Utilities | 1 | $9B |
|
||
Price history
+283.6% since first listed30 events — show timeline
- 2026-06-12 Listed $179,900 SOMO
- 2025-01-14 Sold (MLS) — SOMO
- 2024-11-24 Pending — SOMO
- 2024-07-26 Price Changed $165,000 SOMO
- 2024-07-10 Price Changed $168,900 SOMO
- 2024-04-24 Price Changed $169,900 SOMO
- 2024-04-21 Price Changed $172,900 SOMO
- 2024-03-18 Price Changed $174,900 SOMO
- 2024-03-04 Price Changed $175,900 SOMO
- 2024-02-13 Listed $179,900 SOMO
- 2023-10-27 Price Changed $178,900 SOMO
- 2023-10-12 Price Changed $179,900 SOMO
- 2023-10-04 Price Changed $183,900 SOMO
- 2023-08-19 Price Changed $184,900 SOMO
- 2023-08-06 Relisted — SOMO
- 2023-06-09 Pending — SOMO
- 2023-05-19 Listed $189,900 SOMO
- 2022-11-16 Sold (Public Records) — Public Records
- 2022-11-15 Sold (MLS) — SOMO
- 2022-10-11 Pending — SOMO
- 2022-09-21 Price Changed $189,000 SOMO
- 2022-08-25 Price Changed $194,000 SOMO
- 2022-08-03 Price Changed $198,500 SOMO
- 2022-07-22 Price Changed $198,900 SOMO
- 2022-06-18 Listed $199,800 SOMO
- 2017-02-10 Sold (MLS) — SOMO
- 2016-10-13 Listed $46,900 SOMO
- 2012-07-30 Sold (Public Records) — Public Records
- 2003-01-27 Sold (Public Records) — Public Records
- 1995-12-06 Sold (Public Records) — Public Records
Property tax history
+5.4%/yrLatest (2025): $642 · +6.6% YoY. Source: county tax records.
Cash-flow waterfall
monthlySold comps — $/sqft
last 12 mo · ≤1 miLoading sold comps…