 Multi-family
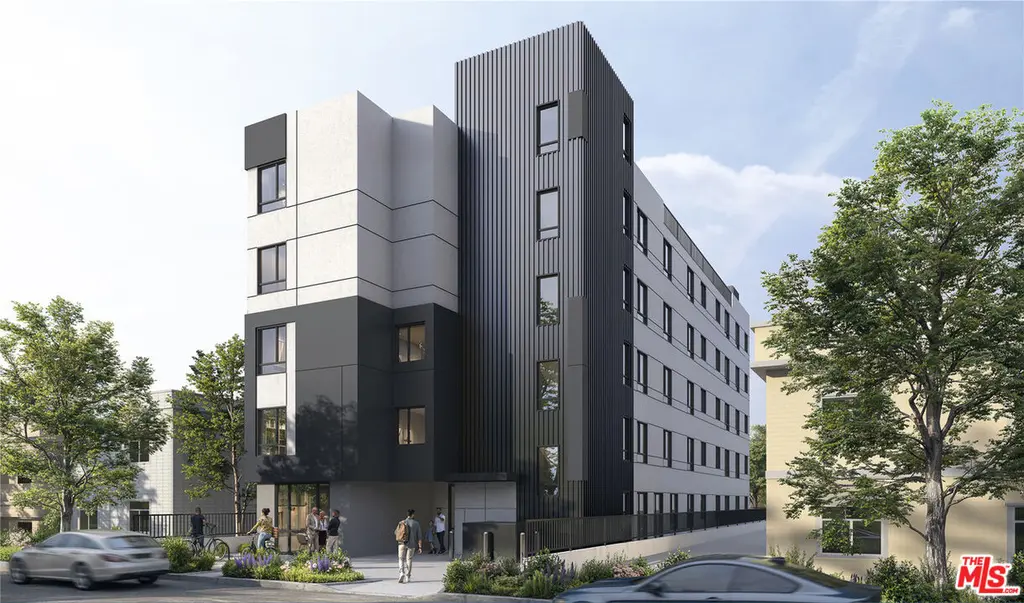
1156 N Kingsley Dr · Los Angeles, CA
Flood risk 1/10 · Minimal
- FEMA flood zone
- X (unshaded)
- Chance of flooding over 30 yrs
- 0.0%
- Est. flood insurance / yr
- $507 – $1,088
Fire risk 1/10 · Minimal
- Est. fire insurance / yr
- $659 – $1,223
Heat risk 6/10 · Moderate
- Hot days now (above 92°F)
- 7 days/yr
- Hot days in 30 yrs
- 22 days/yr
Wind risk 1/10 · Minimal
- Chance of severe wind over 30 yrs
- —
Air-quality risk 5/10 · Moderate
- Unhealthy air days now
- 8 days/yr
- Unhealthy air days in 30 yrs
- 8 days/yr
Risk factors via First Street. Map © Google.
Why this score? — see what drove the D- grade
The composite is a weighted blend of 9 inputs, each scored 0–100. Each bar is that input's sub-score; the figure is the points it added to the 100-point composite (weight × sub-score).
- Cash flow +15.0/30.0
- 1% rule +5.0/10.0
- DSCR +5.0/10.0
- Schools +3.6/10.0
- Livability +3.4/5.0
- Rent growth +2.5/5.0
- Condition / age +2.5/5.0
- ARV discount +0.0/15.0
- Appreciation +0.0/10.0
$1,650,000
🖨 Deal sheet 📄 Offer letter ✓ Due diligence
Multi-family units
County records classify this as Multi-Family (2-4 Unit). Listing-text estimate: 1 unit. estimate disagrees with records
Listing remarks MLS
PRICE REDUCED! Under $34,000 per unit!! KW Commercial is proud to present for sale a Ready-to-Issue (RTI) 49-unit, 100% affordable housing ED 1 development opportunity in the heart of Hollywood! Situated on a 7,895 SF lot, this five-story project has been thoughtfully designed for maximum efficiency, featuring 48 one-bedroom units and 1 studio for a total of approximately 21,753 rentable square feet. Perfectly positioned less than a mile from the Vermont/Santa Monica Metro Red Line Station and close to premier shopping, dining, and transit options, this location earns a Walk Score of 92 ("Walker's Paradise"). Affordability is at the core of this development, with: 10 units reserved for moderate-income households (110% AMI or below), 38 units reserved for low-income households (80% AMI or below), and 1 market-rate manager's unit. Applicable rent schedules include HCD Schedule VI (for very low and moderate-income units) and TCAC Schedule IX (for low-income units). The site's affordability mix may also appeal to Section 8 voucher tenants, potentially increasing income by up to 20% per unit. Designed with zero parking spaces, this project minimizes construction costs and streamlines development. The vacant lot offers a clear path to construction no tenant relocation or demolition required, allowing you to build immediately. Located within a Qualified Opportunity Zone, investors may benefit from additional tax incentives (buyer to verify). Don't miss this rare opportunity to build a brand-new, fully affordable multifamily community in one of Los Angeles' most dynamic neighborhoods, all at an exceptional value of just under $34,000/unit!! Contact the listing agent for additional details and a complete set of approved plans.
Key facts
- Walk score of 92
- Vacant lot
- Maximum efficiency
Tags
Neighborhood map
What this means for you Summary
Snapshot
- This is a multifamily listed at $1.65M.
Deal economics
- At list price, monthly cash flow is $68k ($813k/yr) — positive.
- The deal already cash-flows at list — no discount required.
- Meets the 1% rule at list price ($99k rent vs $1.65M).
- Recommended offer: $1.45M (12.0% below list) — sets the bar for market timing.
- Cap rate 55.6% vs local median 2.1% in Los Angeles — top-decile yield for the area; either an underpriced asset or a hidden risk that comps aren't pricing in. Stress-test before assuming the spread holds.
Location & tenants
- Location reads 68/100 on livability (#273 in CA) — a middle-class / working-renter tenant base. Strengths: amenities A+, commute A+, employment B; Watch: health & safety C-, schools D+, crime F.
- Los Angeles Unified (urban): math 29% / reading 54% proficiency, ranked #223 of 517 in CA (top 43%) — families likely to look elsewhere, expect single-tenant / working-renter base with shorter leases; 67% free/reduced lunch — lower-income household profile, screen leases tightly.
- Market conditions: Rents flat; 76 active listings in the ZIP; 40 comparable units currently listed for rent nearby; rentals at typical pace (median 25d on market — plan ~3-4 weeks tenant-placement turnaround); 19,697 units permitted in Los Angeles County in 2024 (9,426 in 5+ unit buildings).
- At $99,221/mo this rent would consume 1970% of the median local household income ($60k/yr) (locally 3614% of renters already pay >50% of income on rent) — very limited rent-growth headroom before tenants either downsize or default.
Forward outlook
- Local home prices are declining (-3.0%/yr); year-one equity from $11k of loan paydown is wiped out by about $50k of value loss. Plan a longer hold.
- Los Angeles County population projected at +9% by 2050 — modest demand growth; plan on rents tracking national, not racing it.
- At projected returns (-3.0% appreciation + 0.2% rent growth), your $462k cash investment doubles in ~1 year — after that, you're playing with house money.
Negotiation context
- It's been on market 224 days — a 12% lower offer ($1.45M) is reasonable based on typical stale-listing flexibility.
- 7 sale attempts since 22y ago; this cycle's ask has dropped $550k (25%) from the opening price — seller is motivated, your offer sets the floor, not the list.
- Current owner paid $1.24M; 34% above their basis — modest negotiation headroom, anchor on the comps not their cost.
Risks & watch-outs
- Climate carrying-cost: extreme-heat days projected 7→22/yr by 2055 (HVAC capex compounding) — expect insurance premiums to compound above CPI over the hold.
Questions for the listing agent
- It's been on market 224 days. Have you received any prior offers? Is the seller open to a 12% concession, seller financing, or rate buy-down credit?
- Why hasn't it sold? Are there any deal-killer items the seller is aware of (foundation, flood, title, zoning, code violations)?
- Is there a deadline driving the sale (1031 exchange, divorce, estate, relocation)? That informs how much negotiation room exists.
- Schools are D-rated, which usually means shorter tenancies and higher turnover. Who's the typical renter profile here, and what's been the actual vacancy rate?
- Crime grade is F in this area — have there been break-ins, vandalism, or insurance claims at this property in the last 3 years? What carrier currently insures it and at what premium?
- The area grade is low — what's the realistic commute time and amenity access for the typical tenant pool here? Any planned neighborhood developments (good or bad) we should know about?
- What's the average days-on-market for RENTAL listings here right now (not sales)? A rising rental-DOM trend means longer vacancies and softer asking-rent achievability than the comps imply.
- What's the recent tenant-quality profile in this submarket — average credit score on applications, eviction rate, late-payment / NSF rate, and stable-employment percentage? A property-management company in the area should have these aggregated.
- How much new apartment / multifamily construction is in the pipeline within 1–3 miles? Heavy new supply (>2% of stock underway) typically softens rents 12–24 months out; light construction supports rent growth.
Investment metrics
- 1% rule
- 6.01% ✓
- Cap rate
- 55.58%
- Cash-on-cash
- 176.03%
- DSCR
- 8.83
- GRM
- 1.4
CMA / ARV
- ARV (median comp)
- $1,358,644
- List price
- $1,650,000
- Delta
- 21.44%
- Verdict
- OVERPRICED
- Comps
- 20 within 1.0 mi
Show comp detail 12 sales within ~0.75 mi
| Address | Dist | Beds/Ba | Sqft | Sold | Price | $/sf | Match |
|---|---|---|---|---|---|---|---|
| 1203 N Normandie Ave | 0.12mi | 4/4.0 | 2,373 | 5mo | $1,195,000 | $504 | 77 |
| 1216 N Mariposa Ave | 0.21mi | 4/3.5 | 2,676 | 6mo | $1,510,000 | $564 | 73 |
| 966 N Serrano Ave | 0.36mi | 4/2.0 | 3,178 | 1mo | $1,120,000 | $352 | 70 |
| 826 N Normandie Ave | 0.46mi | 8/4.0 | 3,470 | 4mo | $850,000 | $245 | 63 |
| 732 N Kingsley | 0.54mi | 11/6.5 | 4,543 | 0mo | $1,200,000 | $264 | 62 |
| 1216 N St Andrews | 0.49mi | 2/2.0 | 1,214 | 3mo | $700,000 | $577 | 62 |
| 1536 N Serrano Ave | 0.56mi | 99/66.0 | 60,525 | 4mo | $7,600,000 | $126 | 58 |
| 5412 Monroe St | 0.72mi | 4/3.0 | 2,368 | 1mo | $1,030,000 | $435 | 53 |
| 5724 La Mirada Ave | 0.71mi | 6/5.0 | 3,284 | 2mo | $1,052,000 | $320 | 53 |
| 601 N Normandie Ave | 0.72mi | 9/9.0 | 5,724 | 3mo | $2,425,000 | $424 | 51 |
| 5427 Carlton Way | 0.68mi | 20/22.0 | 15,320 | 6mo | $5,080,000 | $332 | 51 |
| 606 N Normandie Ave | 0.75mi | 4/2.5 | 3,382 | 5mo | $1,000,000 | $296 | 49 |
Match score weights: distance 35% · size 25% · config 20% · recency 20%. Top-matched comps best support the ARV.
Projected returns pro-forma
-3.0% appreciation · 0.19% rent growth · sell at horizon
- IRR
- —
- Equity multiple
- 9.18×
- Total profit
- $3,777,114
- Equity at exit
- $246,020
- IRR
- —
- Equity multiple
- 17.87×
- Total profit
- $7,792,639
- Equity at exit
- $142,662
Cash invested: $462,000 (down + closing). Projections, not guarantees.
Landlord ↔ Tenant lean methodology
- Overall (CITY)
- 0 Strongly Tenant-Friendly
- State California
- 18 Strongly Tenant-Friendly · D+13
- County
- — inherits STATE
- City Los Angeles
- 0 Strongly Tenant-Friendly · D+22
ZIP-level market 90029
- Rents YoY
- 0.2%
- Active inventory
- 76
- Price-to-rent
- 67.9×
Monthly cashflow live
- Estimated rent
- $99,221 high interval (Pro) →
- Mortgage (P&I)
- −$8,653
- Tax from tax record
- −$1,274 /mo · $15,285/yr
- Insurance
- −$688
- HOA
- −$0
- Vacancy / Maint / Mgmt
- −$20,836
- Net cashflow
- $67,771
Break-even live
49-unit breakdown (identical units grouped — click to expand)
| Units | Beds | Baths | Est. rent |
|---|---|---|---|
| 49× units | 1 | 1 | $99,225 |
| #1 | 1 | 1 | $2,025 |
| #2 | 1 | 1 | $2,025 |
| #3 | 1 | 1 | $2,025 |
| #4 | 1 | 1 | $2,025 |
| #5 | 1 | 1 | $2,025 |
| #6 | 1 | 1 | $2,025 |
| #7 | 1 | 1 | $2,025 |
| #8 | 1 | 1 | $2,025 |
| #9 | 1 | 1 | $2,025 |
| #10 | 1 | 1 | $2,025 |
| #11 | 1 | 1 | $2,025 |
| #12 | 1 | 1 | $2,025 |
| #13 | 1 | 1 | $2,025 |
| #14 | 1 | 1 | $2,025 |
| #15 | 1 | 1 | $2,025 |
| #16 | 1 | 1 | $2,025 |
| #17 | 1 | 1 | $2,025 |
| #18 | 1 | 1 | $2,025 |
| #19 | 1 | 1 | $2,025 |
| #20 | 1 | 1 | $2,025 |
| #21 | 1 | 1 | $2,025 |
| #22 | 1 | 1 | $2,025 |
| #23 | 1 | 1 | $2,025 |
| #24 | 1 | 1 | $2,025 |
| #25 | 1 | 1 | $2,025 |
| #26 | 1 | 1 | $2,025 |
| #27 | 1 | 1 | $2,025 |
| #28 | 1 | 1 | $2,025 |
| #29 | 1 | 1 | $2,025 |
| #30 | 1 | 1 | $2,025 |
| #31 | 1 | 1 | $2,025 |
| #32 | 1 | 1 | $2,025 |
| #33 | 1 | 1 | $2,025 |
| #34 | 1 | 1 | $2,025 |
| #35 | 1 | 1 | $2,025 |
| #36 | 1 | 1 | $2,025 |
| #37 | 1 | 1 | $2,025 |
| #38 | 1 | 1 | $2,025 |
| #39 | 1 | 1 | $2,025 |
| #40 | 1 | 1 | $2,025 |
| #41 | 1 | 1 | $2,025 |
| #42 | 1 | 1 | $2,025 |
| #43 | 1 | 1 | $2,025 |
| #44 | 1 | 1 | $2,025 |
| #45 | 1 | 1 | $2,025 |
| #46 | 1 | 1 | $2,025 |
| #47 | 1 | 1 | $2,025 |
| #48 | 1 | 1 | $2,025 |
| #49 | 1 | 1 | $2,025 |
| Total (49 units) | $99,221 | ||
UW: 25.0% down · 7.5% · 30yr · 1.5% tax · 5.0% vac · 8.0% maint · 8.0% mgmt
Financing live
Cash to close
- Down payment
- $412,500
- Closing costs
- $49,500
- Reserves months
- —
- Total cash needed
- —
Loan-product check · same deal, 3 products live
Conventional
25% down · 7.5% · 30yr
- Down + closing
- —
- Monthly P&I
- —
- Monthly cashflow
- —
- DSCR
- —
- Eligible?
- —
Personal DTI + credit; lowest rate.
DSCR
20% down · 8.5% · 30yr
- Down + closing
- —
- Monthly P&I
- —
- Monthly cashflow
- —
- DSCR
- —
- Eligible?
- —
No personal income docs; deal must DSCR.
Hard money
10% down · 12.0% · 12mo
- Down + closing
- —
- Monthly P&I
- —
- Monthly cashflow
- —
- DSCR
- —
- Eligible?
- —
Short-term bridge; refi at stabilization.
Rent comps 40 comps
| Address | Beds | Baths | Sqft | Rent | $/sqft | DOM | Units | Dist |
|---|---|---|---|---|---|---|---|---|
| 1177 N Ardmore Ave Los Angeles, CA | 1.0 | 1.0 | — | $2,195 | — | 3d | 1 | 0.06mi |
| 1192 N Kingsley Dr Unit 1192 Los Angeles, CA | 2.0 | 1.0 | — | $2,500 | — | 24d | 1 | 0.08mi |
| 1190 N Kingsley Dr Unit 1190 Los Angeles, CA | 2.0 | 1.0 | — | $2,350 | — | 43d | 1 | 0.08mi |
| 1193 N Ardmore Ave Apt 9 Los Angeles, CA | 1.0 | 1.0 | 622 | $1,975 | $3.18 | 43d | 1 | 0.09mi |
| 1193 N Ardmore Ave Apt 9 Los Angeles, CA | 1.0 | 1.0 | 690 | $1,775 | $2.57 | 20d | 1 | 0.09mi |
| 1183 N Normandie Ave Los Angeles, CA | 3.0 | 2.0 | 1350 | $3,995 | $2.96 | 24d | 1 | 0.09mi |
| 5226 Lexington Ave Los Angeles, CA | 1.0 | 1.0 | — | $1,725 | — | 22d | 1 | 0.10mi |
| 5240 Virginia Ave #1267 Los Angeles, CA | 2.0 | 2.0 | 1000 | $3,090 | $3.09 | 20d | 1 | 0.10mi |
| 1150 N Normandie Ave Unit 203 Los Angeles, CA | 1.0 | 1.0 | 699 | $1,895 | $2.71 | 7d | 1 | 0.11mi |
| 1150 N Normandie Ave Los Angeles, CA | 1.0 | 1.0 | 736 | $1,799 | $2.44 | 1d | 1 | 0.11mi |
| 5245 Santa Monica Blvd Unit 325 Los Angeles, CA | 2.0 | 2.0 | 1400 | $4,200 | $3.00 | 11d | 1 | 0.13mi |
| 5225 Lexington Ave Los Angeles, CA | 1.0 | 1.0 | 760 | $1,725 | $2.27 | 22d | 1 | 0.13mi |
| 1217 N Kingsley Dr Unit 4 Los Angeles, CA | 1.0 | 1.0 | 700 | $2,200 | $3.14 | 20d | 1 | 0.14mi |
| 1050 N Kingsley Dr Los Angeles, CA | 3.0 | 3.0 | 1365 | $2,995 | $2.19 | 43d | 1 | 0.15mi |
| 1132 N Mariposa Ave Los Angeles, CA | 2.0 | 1.0 | 800 | $2,750 | $3.44 | 43d | 1 | 0.15mi |
| 1142 Mariposa Ave Unit 1142 Los Angeles, CA | 1.0 | 1.0 | 630 | $2,195 | $3.48 | 16d | 1 | 0.16mi |
| 1211 Mariposa Ave Unit 3 Los Angeles, CA | 3.0 | 2.5 | 1900 | $4,495 | $2.37 | 43d | 1 | 0.18mi |
| 1049 Mariposa Ave Apt 4 Los Angeles, CA | 1.0 | 1.0 | — | $1,595 | — | 43d | 1 | 0.18mi |
| 1029 N Ardmore Ave Los Angeles, CA | 1.0 | 1.0 | 680 | $1,950 | $2.87 | 7d | 1 | 0.18mi |
| 1028 N Ardmore Ave Unit C Los Angeles, CA | 3.0 | 1.0 | 1350 | $3,600 | $2.67 | 24d | 1 | 0.18mi |
| 5246 1/2 Santa Monica Blvd Los Angeles, CA | 2.0 | 2.0 | 935 | $3,258 | $3.48 | 24d | 1 | 0.19mi |
| 5315 Virginia Ave Los Angeles, CA | 1.0 | 1.0 | 465 | $1,750 | $3.76 | 10d | 1 | 0.19mi |
| 1267 N Normandie Ave Los Angeles, CA | 1.0 | 1.0 | 550 | $1,645 | $2.99 | 2d | 1 | 0.19mi |
| 5154 Fountain Ave Unit 5158 Los Angeles, CA | 1.0 | 1.0 | 450 | $1,700 | $3.78 | 24d | 1 | 0.19mi |
| 1238 Normandie Ave Unit 1/4 Los Angeles, CA | 1.0 | 1.0 | — | $1,200 | — | 43d | 1 | 0.19mi |
| 5311 Lexington Ave Unit 8 Los Angeles, CA | 2.0 | 1.5 | — | $2,300 | — | 2d | 1 | 0.20mi |
| 1025 Mariposa Ave Unit 17 Los Angeles, CA | 1.0 | 1.5 | — | $1,850 | — | 43d | 1 | 0.21mi |
| 1020 N Kingsley Dr Los Angeles, CA | 1.0 | 1.0 | 800 | $2,295 | $2.87 | 7d | 1 | 0.21mi |
| 1021 Mariposa Ave Unit 4 Los Angeles, CA | 2.0 | 1.0 | 13207 | $2,495 | $0.19 | 24d | 1 | 0.21mi |
| 1258 N Hobart Blvd Unit 1258 Los Angeles, CA | 2.0 | 2.5 | 1040 | $2,750 | $2.64 | 43d | 1 | 0.21mi |
| 5327 Lexington Ave Unit B Los Angeles, CA | 2.0 | 2.5 | 1700 | $3,500 | $2.06 | 24d | 1 | 0.23mi |
| 1219 Alexandria Ave Los Angeles, CA | 2.0 | 2.0 | 1000 | $3,150 | $3.15 | 43d | 1 | 0.24mi |
| 5119 Fountain Ave Los Angeles, CA | 1.0 | 1.0 | — | $1,845 | — | 13d | 4 | 0.24mi |
| 1301 N Kingsley Dr Unit 1 Los Angeles, CA | 3.0 | 3.0 | 300 | $700 | $2.33 | 24d | 1 | 0.24mi |
| 1208 Alexandria Ave Los Angeles, CA | 3.0 | 2.5 | 1192 | $4,499 | $3.77 | 24d | 1 | 0.24mi |
| 1131 N Kenmore Ave Unit 7 Los Angeles, CA | 2.0 | 1.0 | 4774 | $2,250 | $0.47 | 43d | 1 | 0.25mi |
| 1131 N Kenmore Ave Unit 4 Los Angeles, CA | 1.0 | 1.0 | 600 | $1,950 | $3.25 | 43d | 1 | 0.25mi |
| 5068 Romaine St Los Angeles, CA | 1.0 | 1.0 | — | $1,795 | — | 7d | 1 | 0.26mi |
| 1185 N Kenmore Ave Unit 27 Los Angeles, CA | 1.0 | 1.0 | 500 | $1,700 | $3.40 | 43d | 1 | 0.26mi |
| 5066 Romaine St Los Angeles, CA | 1.0 | 1.5 | 750 | $2,600 | $3.47 | 43d | 2 | 0.26mi |
Listing history 29 events
-
2026-06-04days on market $1,650,000 Active 224 DOM
-
2026-06-03days on market $1,650,000 Active 223 DOM
-
2026-06-02days on market $1,650,000 Active 222 DOM
-
2026-06-01days on market $1,650,000 Active 221 DOM
-
2026-05-31days on market $1,650,000 Active 220 DOM
-
2026-01-21price $1,650,000 1758-char remark
Show marketing remark (1758 chars)
PRICE REDUCED! Under $34,000 per unit!! KW Commercial is proud to present for sale a Ready-to-Issue (RTI) 49-unit, 100% affordable housing ED 1 development opportunity in the heart of Hollywood! Situated on a 7,895 SF lot, this five-story project has been thoughtfully designed for maximum efficiency, featuring 48 one-bedroom units and 1 studio for a total of approximately 21,753 rentable square feet. Perfectly positioned less than a mile from the Vermont/Santa Monica Metro Red Line Station and close to premier shopping, dining, and transit options, this location earns a Walk Score of 92 ("Walker's Paradise"). Affordability is at the core of this development, with: 10 units reserved for moderate-income households (110% AMI or below), 38 units reserved for low-income households (80% AMI or below), and 1 market-rate manager's unit. Applicable rent schedules include HCD Schedule VI (for very low and moderate-income units) and TCAC Schedule IX (for low-income units). The site's affordability mix may also appeal to Section 8 voucher tenants, potentially increasing income by up to 20% per unit. Designed with zero parking spaces, this project minimizes construction costs and streamlines development. The vacant lot offers a clear path to construction no tenant relocation or demolition required, allowing you to build immediately. Located within a Qualified Opportunity Zone, investors may benefit from additional tax incentives (buyer to verify). Don't miss this rare opportunity to build a brand-new, fully affordable multifamily community in one of Los Angeles' most dynamic neighborhoods, all at an exceptional value of just under $34,000/unit!! Contact the listing agent for additional details and a complete set of approved plans.
-
2025-11-06price $1,850,000 1758-char remark
Show marketing remark (1758 chars)
PRICE REDUCED! Under $34,000 per unit!! KW Commercial is proud to present for sale a Ready-to-Issue (RTI) 49-unit, 100% affordable housing ED 1 development opportunity in the heart of Hollywood! Situated on a 7,895 SF lot, this five-story project has been thoughtfully designed for maximum efficiency, featuring 48 one-bedroom units and 1 studio for a total of approximately 21,753 rentable square feet. Perfectly positioned less than a mile from the Vermont/Santa Monica Metro Red Line Station and close to premier shopping, dining, and transit options, this location earns a Walk Score of 92 ("Walker's Paradise"). Affordability is at the core of this development, with: 10 units reserved for moderate-income households (110% AMI or below), 38 units reserved for low-income households (80% AMI or below), and 1 market-rate manager's unit. Applicable rent schedules include HCD Schedule VI (for very low and moderate-income units) and TCAC Schedule IX (for low-income units). The site's affordability mix may also appeal to Section 8 voucher tenants, potentially increasing income by up to 20% per unit. Designed with zero parking spaces, this project minimizes construction costs and streamlines development. The vacant lot offers a clear path to construction no tenant relocation or demolition required, allowing you to build immediately. Located within a Qualified Opportunity Zone, investors may benefit from additional tax incentives (buyer to verify). Don't miss this rare opportunity to build a brand-new, fully affordable multifamily community in one of Los Angeles' most dynamic neighborhoods, all at an exceptional value of just under $34,000/unit!! Contact the listing agent for additional details and a complete set of approved plans.
-
2025-10-22$2,200,000 Active 1758-char remark
Show marketing remark (1758 chars)
PRICE REDUCED! Under $34,000 per unit!! KW Commercial is proud to present for sale a Ready-to-Issue (RTI) 49-unit, 100% affordable housing ED 1 development opportunity in the heart of Hollywood! Situated on a 7,895 SF lot, this five-story project has been thoughtfully designed for maximum efficiency, featuring 48 one-bedroom units and 1 studio for a total of approximately 21,753 rentable square feet. Perfectly positioned less than a mile from the Vermont/Santa Monica Metro Red Line Station and close to premier shopping, dining, and transit options, this location earns a Walk Score of 92 ("Walker's Paradise"). Affordability is at the core of this development, with: 10 units reserved for moderate-income households (110% AMI or below), 38 units reserved for low-income households (80% AMI or below), and 1 market-rate manager's unit. Applicable rent schedules include HCD Schedule VI (for very low and moderate-income units) and TCAC Schedule IX (for low-income units). The site's affordability mix may also appeal to Section 8 voucher tenants, potentially increasing income by up to 20% per unit. Designed with zero parking spaces, this project minimizes construction costs and streamlines development. The vacant lot offers a clear path to construction no tenant relocation or demolition required, allowing you to build immediately. Located within a Qualified Opportunity Zone, investors may benefit from additional tax incentives (buyer to verify). Don't miss this rare opportunity to build a brand-new, fully affordable multifamily community in one of Los Angeles' most dynamic neighborhoods, all at an exceptional value of just under $34,000/unit!! Contact the listing agent for additional details and a complete set of approved plans.
-
2022-11-29soldstatus $1,235,000
-
2013-01-02historical
-
2012-07-19status Backup Offers Accepted
-
2012-06-15price $334,700 Active
-
2012-06-15status Active
-
2012-06-08historical Hold
-
2012-06-07status Active
-
2012-05-26historical Hold
-
2012-05-17status Active
-
2012-05-03historical Hold
-
2012-05-01price $388,725
-
2012-05-01price $390,873
-
2012-04-28price $396,888
-
2012-04-26$400,000 Active
-
2005-01-26historical
-
2004-12-13soldstatus $590,000
-
2004-12-10soldstatus $590,000
-
2004-11-05historical
-
2004-07-29$599,000
-
2004-07-29$599,000
-
1994-07-21soldstatus $169,000
ⓘ Source: listings_history table (triggers on properties + properties_extension) + one-shot
backfill from property_details.listing_events for pre-trigger history.
Tax reassessment forecast CA · Resets to sale price
- Current annual tax
- $15,285 · $1,274/mo
- Projected year-2 tax
- $15,285 · $1,274/mo
- Expected delta
- $0/yr ($0/mo · 0.0%)
ⓘ Screening estimate from a state-policy table — verify with the county assessor before closing.
Climate risk First Street
- Flood 1/10 Low FEMA zone X (unshaded) · 0% chance over 30 yrs
- Wildfire 1/10 Low
- Heat 6/10 Major 7 d/yr ≥92°F today · 22 d/yr by 30 yrs out
- Wind 1/10 Low
- Air quality 5/10 Major 8 unhealthy d/yr today · 8 by 30 yrs out
Nearby sold comps map
Loading sold comps map…
Walkable amenities ~0.75 mi
Loading nearby amenities…
Taxation est. · year 1
- Rental income
- $1,190,652
- − Mortgage interest
- −$92,426
- − Property taxes
- −$15,285
- − Insurance
- −$8,250
- − Repairs & maintenance
- −$95,252
- − Management
- −$95,252
- − Depreciation
- −$48,000
- Taxable income
- $836,187
- Est. tax owed @ 24.0%
- −$200,685
- After-tax cash flow
- $612,562/yr
For passive investors: Depreciation is non-cash, so a rental often shows a tax loss while cash-flowing — sheltering income. Rental losses are passive: they offset passive income freely, and up to $25,000/yr can offset ordinary (W-2) income if you actively participate and your MAGI is under $100k (phasing out to $0 by $150k); unused losses carry forward. On sale, claimed depreciation is recaptured at up to 25%, and gains may owe capital-gains tax (a 1031 exchange can defer both). Figures are a year-1 estimate at your 24.0% rate — not tax advice; consult a CPA.
Schools (NCES district)
- District
- Los Angeles Unified
- NCES district ID
- 0622710
- Math proficiency
- 29% ▼ -4.00%
- Reading proficiency
- 54% ▲ 10.00%
- Median HH income
- $50,403
- Composite
- 35.67/100
- National rank
- #4875
- State rank
- #223 of 517 in CA
Livability — Los Angeles
- Score
- 68/100
- State rank
- #273
- US rank
- #9237
Category grades
Schools grade is shown separately in the Schools card above.
Census & demographics
- Census place
- Los Angeles, CA
- County
- Los Angeles County · 9,444,647 people
- City population
- 3,838,149
- Metro
- Los Angeles-Long Beach-Anaheim, CA
- Population (ZIP)
- 33,303
- Household income
- $60,440
- Rent vs Own
- Severe rent burden
- 3614.0
Population outlook (Los Angeles County) Hauer SSP2
- Today (2025)
- 10,940,515 people
- By 2030
- 11,256,481 · +2.9%
- By 2040
- 11,729,929 · +7.2%
- By 2050
- 11,948,407 · +9.2%
- By 2075
- 11,818,114 · +8.0%
- By 2100
- 10,842,928 · -0.9%
Race, ethnicity, and origin ACS 2023
- Neighborhood character
- Diverse neighborhood (Simpson 0.66)
- Race & ethnicity
- Hispanic / Latino 49% White 27% Asian 17% Two or more races 10% Black 4% Native American 1%
- Hispanic origin (detail)
- Mexican 19%
- Common ancestry
- Scotch-Irish 1% Romanian 1% Slovak 1%
- Foreign-born
- 49% · Canada, China, South Korea
- Languages at home
- 33% English-only · Spanish 45% Tagalog/Filipino 9% Other Indo-European 6%
Political lean MEDSL · Los Angeles
- 2024 margin
- Solid D (+32.9) · D 64.8% · R 31.9% · Other 3.3%
- 2008→2024 swing
- -7.4pp toward R · 2008: 40.4pp · 2024: 32.9pp
- All cycles
- 2024: D+32.9 2020: D+44.2 2016: D+48.0 2012: D+40.0 2008: D+40.4
Not yet ingested
- Civics
- —
Market trends
- HPI YoY
- ▼ -292.27%
- Current HPI
- 451.0593
- Rent YoY
- ▲ 0.19%
- Metro
- Los Angeles-Long Beach-Anaheim, CA
- State GDP YoY
- ▲ 3.21%
- F500 in state
- 116
Industry mix (Fortune 500 HQ in CA)
| Industry | F500 HQs | Revenue |
|---|---|---|
| Technology | 27 | $1,492B |
|
||
| Financial Services | 3 | $174B |
|
||
| Retail | 3 | $44B |
|
||
| Insurance | 3 | $26B |
|
||
| Media / Entertainment | 2 | $115B |
|
||
| Pharmaceuticals / Biotech | 2 | $62B |
|
||
Price history
+876.3% since first listed24 events — show timeline
- 2026-01-21 Price Changed $1,650,000 TheMLS
- 2025-11-06 Price Changed $1,850,000 TheMLS
- 2025-10-22 Listed $2,200,000 TheMLS
- 2022-11-29 Sold (Public Records) $1,235,000 Public Records
- 2013-01-02 Listing Removed — CRMLS
- 2012-07-19 Pending — CRMLS
- 2012-06-15 Relisted — CRMLS
- 2012-06-15 Price Changed $334,700 CRMLS
- 2012-06-08 Delisted — CRMLS
- 2012-06-07 Relisted — CRMLS
- 2012-05-26 Delisted — CRMLS
- 2012-05-17 Relisted — CRMLS
- 2012-05-03 Delisted — CRMLS
- 2012-05-01 Price Changed $388,725 CRMLS
- 2012-05-01 Price Changed $390,873 CRMLS
- 2012-04-28 Price Changed $396,888 CRMLS
- 2012-04-26 Listed $400,000 CRMLS
- 2005-01-26 Listing Removed — CRMLS
- 2004-12-13 Sold (MLS) $590,000 TheMLS
- 2004-12-10 Sold (Public Records) $590,000 Public Records
- 2004-11-05 Delisted — TheMLS
- 2004-07-29 Listed $599,000 CRMLS
- 2004-07-29 Listed $599,000 TheMLS
- 1994-07-21 Sold (Public Records) $169,000 Public Records
Property tax history
+4.2%/yrLatest (2025): $15,285 · -0.2% YoY. Source: county tax records.
Cash-flow waterfall
monthlySold comps — $/sqft
last 12 mo · ≤1 miLoading sold comps…