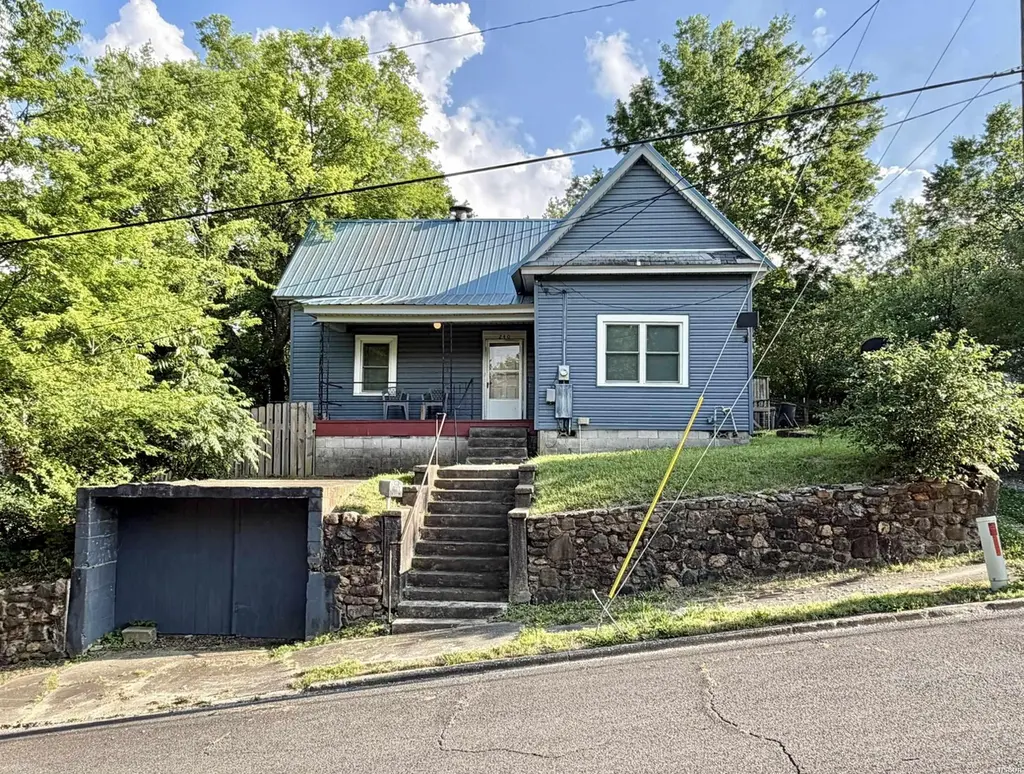
240 Plateau St · Hot Springs, AR
Flood risk 1/10 · Minimal
- FEMA flood zone
- X (unshaded)
- Chance of flooding over 30 yrs
- 0.0%
- Est. flood insurance / yr
- $507 – $1,088
Fire risk 3/10 · Minor
- Est. fire insurance / yr
- $1,499 – $2,785
Heat risk 6/10 · Moderate
- Hot days now (above 111°F)
- 7 days/yr
- Hot days in 30 yrs
- 21 days/yr
Wind risk 4/10 · Minor
- Chance of severe wind over 30 yrs
- 9.0%
Air-quality risk 1/10 · Minimal
- Unhealthy air days now
- 0 days/yr
- Unhealthy air days in 30 yrs
- 0 days/yr
Risk factors via First Street. Map © Google.
Why this score? — see what drove the B grade
The composite is a weighted blend of 9 inputs, each scored 0–100. Each bar is that input's sub-score; the figure is the points it added to the 100-point composite (weight × sub-score).
- Cash flow +30.0/30.0
- ARV discount +15.0/15.0
- DSCR +10.0/10.0
- 1% rule +8.5/10.0
- Livability +3.2/5.0
- Rent growth +2.5/5.0
- Condition / age +2.5/5.0
- Schools +2.0/10.0
- Appreciation +0.0/10.0
$85,000
🖨 Deal sheet 📄 Offer letter ✓ Due diligence
Listing remarks
Affordable, charming and move-in ready! This well-maintained 3-bedroom, 1-bath historic home sits on an oversized double lot in the heart of town with access from two separate streets. Recent updates include a metal roof, vinyl siding, HVAC system, energy-efficient windows and a new walk-in shower. Inside, you'll find original hardwood floors that add warmth and character throughout. The modest but functional floor plan includes a dedicated laundry room, while outside you'll enjoy a mature garden, greenhouse, storage building and carport. Plenty of room to garden, play, expand or simply enjoy the extra space. A rare combination of historic charm, modern updates, and affordability.
Key facts
- Metal roof
- New walk in shower
- Oversized double lot
Tags
Property features AI
Exterior
- Utilities: Public water; Public sewer
- Home design: Single-family residence; Single-story
- Construction: Vinyl siding
- Exterior features: Storage area; Metal roof
Interior
- Flooring: Laminate; Wood
- Bathrooms: 1 full bathroom
- Heating & cooling: Electric central heating; Ceiling fan(s) for cooling
- Interior features: Laminate and wood flooring; Ceiling fan(s)
- Laundry & utility: Dedicated laundry room
Neighborhood map
What this means for you Summary
Snapshot
- This is a 2-bed/1.0-bath single-family listed at $85k.
Deal economics
- At list price, monthly cash flow is $409 ($5k/yr) — positive.
- The deal already cash-flows at list — no discount required.
- Meets the 1% rule at list price ($1k rent vs $85k).
- Cap rate 12.1% vs local median 2.8% in Hot Springs — top-decile yield for the area; either an underpriced asset or a hidden risk that comps aren't pricing in. Stress-test before assuming the spread holds.
Location & tenants
- Location reads 65/100 on livability (#140 in AR) — a middle-class / working-renter tenant base. Strengths: cost of living A+, housing A+, health & safety A-; Watch: schools D, crime F, amenities F.
- Hot Springs School District (urban): math 24% / reading 25% proficiency, ranked #195 of 238 in AR (top 82%) — low school quality limits family demand, transient renter base, plan for 1-2y turnover; 72% free/reduced lunch — lower-income household profile, screen leases tightly.
- Market conditions: 363 active listings in the ZIP; 12 comparable units currently listed for rent nearby; rentals lingering (median 44d on market — plan ~5-8 weeks vacancy on turnover, expect pricing pressure); 92% of comp listings sitting > 30 days — soft ceiling on asking rent; 117 units permitted in Garland County in 2024 (24 in 5+ unit buildings).
Forward outlook
- Local home prices are declining (-3.0%/yr); year-one equity from $588 of loan paydown is wiped out by about $3k of value loss. Plan a longer hold.
- Garland County population projected at +7% by 2050 — modest demand growth; plan on rents tracking national, not racing it.
- At projected returns (-3.0% appreciation + 3.0% rent growth), your $24k cash investment doubles in ~6 years — after that, you're playing with house money.
Negotiation context
- Only 1 days on market — expect competitive offers; lowballing is unlikely to land.
- Current owner paid $25k; list at $85k implies a 240% gain — meaningful room to come down on a strong offer.
Risks & watch-outs
- Watch-outs: built in 1935 — expect roof / HVAC / electrical / plumbing capex.
- Climate carrying-cost: extreme-heat days projected 7→21/yr by 2055 (HVAC capex compounding) — expect insurance premiums to compound above CPI over the hold.
Questions for the listing agent
- Built in 1935 — when were the roof, HVAC, electrical panel, plumbing, and water heater last replaced?
- Is there a deadline driving the sale (1031 exchange, divorce, estate, relocation)? That informs how much negotiation room exists.
- Schools are D-rated, which usually means shorter tenancies and higher turnover. Who's the typical renter profile here, and what's been the actual vacancy rate?
- Crime grade is F in this area — have there been break-ins, vandalism, or insurance claims at this property in the last 3 years? What carrier currently insures it and at what premium?
- What's the average days-on-market for RENTAL listings here right now (not sales)? A rising rental-DOM trend means longer vacancies and softer asking-rent achievability than the comps imply.
- What's the recent tenant-quality profile in this submarket — average credit score on applications, eviction rate, late-payment / NSF rate, and stable-employment percentage? A property-management company in the area should have these aggregated.
- How much new for-sale + rental construction is in the pipeline within 1–3 miles? Heavy new supply typically softens prices + rents 12–24 months out; constrained supply supports both.
Investment metrics
- 1% rule
- 1.35% ✓
- Cap rate
- 12.06%
- Cash-on-cash
- 20.60%
- DSCR
- 1.92
- GRM
- 6.2
CMA / ARV
- ARV (on-the-fly)
- $136,452
- Comps found
- 12
Show comp detail 12 sales within ~0.75 mi
| Address | Dist | Beds/Ba | Sqft | Sold | Price | $/sf | Match |
|---|---|---|---|---|---|---|---|
| 110 Forest Park | 0.23mi | 2/1.0 | 1,020 (+2%) | 4mo | $160,000 | $157 | 82 |
| 111 Prospect Ave #10 | 0.55mi | 2/1.0 | 1,000 (+0%) | 12mo | $152,000 | $152 | 64 |
| 404 Gaines Ave | 0.40mi | 2/1.0 | 1,080 (+8%) | 7mo | $145,000 | $134 | 62 |
| 231 Garland Ave | 0.43mi | 3/1.5 (+1) | 1,024 (+3%) | 10mo | $160,000 | $156 | 60 |
| 305 W Belding St | 0.46mi | 2/1.0 | 986 (-1%) | 20mo | $126,000 | $128 | 60 |
| 126 Morrison Ave Ave | 0.48mi | 2/2.0 | 1,008 (+1%) | 16mo | $198,000 | $196 | 58 |
| 210 Morrison Ave | 0.48mi | 2/1.0 | 944 (-5%) | 19mo | $96,000 | $102 | 53 |
| 411 Palmetto St | 0.61mi | 3/1.0 (+1) | 1,108 (+11%) | 3mo | $113,000 | $102 | 45 |
| 313 Laser St | 0.72mi | 2/1.0 | 1,092 (+10%) | 8mo | $129,500 | $119 | 44 |
| 624 Prospect Ave | 0.70mi | 2/1.0 | 1,114 (+12%) | 9mo | $225,000 | $202 | 40 |
| 116 Nickels St | 0.72mi | 2/2.0 | 1,120 (+12%) | 4mo | $153,000 | $137 | 38 |
| 408 E Belding St | 0.70mi | 2/1.0 | 884 (-11%) | 20mo | $40,000 | $45 | 32 |
Match score weights: distance 35% · size 25% · config 20% · recency 20%. Top-matched comps best support the ARV.
Projected returns pro-forma
-3.0% appreciation · 3.0% rent growth · sell at horizon
- IRR
- 12.9%
- Equity multiple
- 1.51×
- Total profit
- $12,210
- Equity at exit
- $12,674
- IRR
- 21.7%
- Equity multiple
- 2.85×
- Total profit
- $43,988
- Equity at exit
- $7,349
Cash invested: $23,800 (down + closing). Projections, not guarantees.
Landlord ↔ Tenant lean methodology
- Overall (STATE)
- 92 Strongly Landlord-Friendly
- State Arkansas
- 92 Strongly Landlord-Friendly · R+14
- County
- — inherits STATE
- City
- — inherits STATE
ZIP-level market 71901
- Home prices YoY
- -3.6%
- Active inventory
- 363
- Price-to-rent
- 6.2×
Monthly cashflow live
- Estimated rent
- $1,149 high interval (Pro) →
- Mortgage (P&I)
- −$446
- Tax from tax record
- −$18 /mo · $214/yr
- Insurance
- −$35
- HOA
- −$0
- Vacancy / Maint / Mgmt
- −$241
- Net cashflow
- $409
Break-even live
UW: 25.0% down · 7.5% · 30yr · 1.5% tax · 5.0% vac · 8.0% maint · 8.0% mgmt
Financing live
Cash to close
- Down payment
- $21,250
- Closing costs
- $2,550
- Reserves months
- —
- Total cash needed
- —
Loan-product check · same deal, 3 products live
Conventional
25% down · 7.5% · 30yr
- Down + closing
- —
- Monthly P&I
- —
- Monthly cashflow
- —
- DSCR
- —
- Eligible?
- —
Personal DTI + credit; lowest rate.
DSCR
20% down · 8.5% · 30yr
- Down + closing
- —
- Monthly P&I
- —
- Monthly cashflow
- —
- DSCR
- —
- Eligible?
- —
No personal income docs; deal must DSCR.
Hard money
10% down · 12.0% · 12mo
- Down + closing
- —
- Monthly P&I
- —
- Monthly cashflow
- —
- DSCR
- —
- Eligible?
- —
Short-term bridge; refi at stabilization.
Rent comps 12 comps
| Address | Beds | Baths | Sqft | Rent | $/sqft | DOM | Units | Dist |
|---|---|---|---|---|---|---|---|---|
| 125 Oak St Unit 1-306 Hot Springs, AR | 2.0 | 1.0 | 970 | $1,200 | $1.24 | 43d | 1 | 0.25mi |
| 125 Oak St Unit 1-404 Hot Springs, AR | 1.0 | 1.0 | 783 | $1,175 | $1.50 | 43d | 1 | 0.25mi |
| 125 Oak St Unit 1-307 Hot Springs, AR | 2.0 | 1.0 | 1000 | $1,350 | $1.35 | 43d | 1 | 0.25mi |
| 627 Quapaw Ave Unit 2 Hot Springs, AR | 1.0 | 1.0 | 775 | $950 | $1.23 | 43d | 1 | 0.50mi |
| 104 Selma St Hot Springs National Park, AR | 2.0 | 1.0 | 832 | $950 | $1.14 | 43d | 1 | 0.52mi |
| 109 Alcorn St Unit A Hot Springs, AR | 2.0 | 1.0 | 850 | $1,295 | $1.52 | 44d | 1 | 0.55mi |
| 315 Convention Blvd Hot Springs, AR | 2.0 | 1.0 | 900 | $950 | $1.06 | 43d | 4 | 0.65mi |
| 405 Spring St Unit 2 Hot Springs, AR | 1.0 | 1.0 | 750 | $750 | $1.00 | 43d | 1 | 0.67mi |
| 410 Oakwood Ave Hot Springs, AR | 2.0–3.0 | 2.0 | 1000 | $999 | $1.00 | 43d | 6 | 1.33mi |
| 103 Juniper Pl Hot Springs National Park, AR | 3.0 | 1.0 | 1056 | $1,250 | $1.18 | 43d | 1 | 1.43mi |
| 143 Alpine St Hot Springs National Park, AR | 2.0 | 1.0 | 1000 | $995 | $0.99 | 43d | 1 | 1.45mi |
| 605 Hig Fry Rd Hot Springs National Park, AR | 2.0 | 1.0–2.0 | 806 | $1,400 | $1.74 | 23d | 1 | 1.49mi |
Listing history 8 events
-
2026-06-13status $85,000 Under Contract 1 DOM
-
2026-06-09statusdays on market $85,000 New Listing 1 DOM
-
2026-06-09status $85,000 Active Under Contract 6 DOM
-
2026-06-08days on market $85,000 Active 6 DOM
-
2026-06-07days on market $85,000 Active 5 DOM
-
2026-06-05days on market $85,000 Active 2 DOM
-
2026-06-03remarks 689-char remark
-
2026-06-03$85,000 Active 1 DOM
ⓘ Source: listings_history table (triggers on properties + properties_extension) + one-shot
backfill from property_details.listing_events for pre-trigger history.
Tax reassessment forecast AR · Resets to sale price
- Current annual tax
- $214 · $18/mo
- Projected year-2 tax
- $544 · $45/mo
- Expected delta
- +$330/yr (+$27/mo · 153.9%)
ⓘ Screening estimate from a state-policy table — verify with the county assessor before closing.
Climate risk First Street
- Flood 1/10 Low FEMA zone X (unshaded) · 0% chance over 30 yrs
- Wildfire 3/10 Moderate
- Heat 6/10 Major 7 d/yr ≥111°F today · 21 d/yr by 30 yrs out
- Wind 4/10 Moderate 9% chance of damaging wind over 30 yrs
- Air quality 1/10 Low 0 unhealthy d/yr today · 0 by 30 yrs out
Nearby sold comps map
Loading sold comps map…
Walkable amenities ~0.75 mi
Loading nearby amenities…
Taxation est. · year 1
- Rental income
- $13,786
- − Mortgage interest
- −$4,761
- − Property taxes
- −$214
- − Insurance
- −$425
- − Repairs & maintenance
- −$1,103
- − Management
- −$1,103
- − Depreciation
- −$2,473
- Taxable income
- $3,707
- Est. tax owed @ 24.0%
- −$890
- After-tax cash flow
- $4,013/yr
For passive investors: Depreciation is non-cash, so a rental often shows a tax loss while cash-flowing — sheltering income. Rental losses are passive: they offset passive income freely, and up to $25,000/yr can offset ordinary (W-2) income if you actively participate and your MAGI is under $100k (phasing out to $0 by $150k); unused losses carry forward. On sale, claimed depreciation is recaptured at up to 25%, and gains may owe capital-gains tax (a 1031 exchange can defer both). Figures are a year-1 estimate at your 24.0% rate — not tax advice; consult a CPA.
Schools (NCES district)
- District
- Hot Springs School District
- NCES district ID
- 0507890
- Math proficiency
- 24% ▼ -15.00%
- Reading proficiency
- 25% ▼ -12.00%
- Median HH income
- $28,817
- Composite
- 19.62/100
- National rank
- #8746
- State rank
- #195 of 238 in AR
Livability — Hot Springs
- Score
- 65/100
- State rank
- #140
- US rank
- #12498
Category grades
Schools grade is shown separately in the Schools card above.
Census & demographics
- Census place
- Hot Springs, AR
- County
- Garland County · 76,414 people
- City population
- 76,414
- Metro
- Hot Springs, AR
- Population (ZIP)
- 28,937
- Household income
- $53,514
- Rent vs Own
- Severe rent burden
- 961.0
Population outlook (Garland County) Hauer SSP2
- Today (2025)
- 100,343 people
- By 2030
- 101,880 · +1.5%
- By 2040
- 104,804 · +4.4%
- By 2050
- 107,292 · +6.9%
- By 2075
- 113,182 · +12.8%
- By 2100
- 112,247 · +11.9%
Race, ethnicity, and origin ACS 2023
- Neighborhood character
- Predominantly White (71%)
- Race & ethnicity
- White 71% Black 13% Hispanic / Latino 10% Two or more races 6%
- Hispanic origin (detail)
- Mexican 7%
- Common ancestry
- Italian 2% Slovak 2% Portuguese 1%
- Foreign-born
- 5% · Canada, Vietnam
- Languages at home
- 90% English-only · Spanish 7% Vietnamese 1%
Political lean MEDSL · Garland
- 2024 margin
- Solid R (+36.2) · D 30.8% · R 67.0% · Other 2.2%
- 2008→2024 swing
- -11.3pp toward R · 2008: -25.0pp · 2024: -36.2pp
- All cycles
- 2024: R+36.2 2020: R+34.0 2016: R+34.1 2012: R+29.9 2008: R+25.0
Not yet ingested
- Civics
- —
Market trends
- HPI YoY
- ▼ -11.75%
- Current HPI
- 317.2542
- Rent YoY
- —
- Metro
- Hot Springs, AR
- State GDP YoY
- ▲ 3.80%
- F500 in state
- 10
Industry mix (Fortune 500 HQ in AR)
| Industry | F500 HQs | Revenue |
|---|---|---|
| Retail | 1 | $681B |
|
||
| Food / Agriculture | 1 | $53B |
|
||
| Retail / Energy | 1 | $22B |
|
||
| Transportation / Logistics | 1 | $12B |
|
||
| Energy | 1 | $4B |
|
||
Price history
+203.6% since first listed3 events — show timeline
- 2026-06-02 Listed $85,000 HSBOR
- 2011-12-05 Sold (Public Records) $25,000 Public Records
- 1993-12-30 Sold (Public Records) $28,000 Public Records
Property tax history
+3.1%/yrLatest (2025): $214 · -1.3% YoY. Source: county tax records.
Cash-flow waterfall
monthlySold comps — $/sqft
last 12 mo · ≤1 miLoading sold comps…