603 63rd Ave W Unit S20 · Bayshore Gardens, FL
Flood risk 4/10 · Minor
- FEMA flood zone
- X (unshaded)
- Chance of flooding over 30 yrs
- 0.24%
- Est. flood insurance / yr
- $507 – $1,088
Fire risk 1/10 · Minimal
- Est. fire insurance / yr
- $947 – $1,759
Heat risk 10/10 · Severe
- Hot days now (above 106°F)
- 7 days/yr
- Hot days in 30 yrs
- 27 days/yr
Wind risk 10/10 · Severe
- Chance of severe wind over 30 yrs
- 99.0%
Air-quality risk 2/10 · Minimal
- Unhealthy air days now
- 1 days/yr
- Unhealthy air days in 30 yrs
- 2 days/yr
Risk factors via First Street. Map © Google.
Why this score? — see what drove the D grade
The composite is a weighted blend of 9 inputs, each scored 0–100. Each bar is that input's sub-score; the figure is the points it added to the 100-point composite (weight × sub-score).
- Cash flow +15.0/30.0
- ARV discount +7.5/15.0
- 1% rule +5.0/10.0
- DSCR +5.0/10.0
- Schools +4.4/10.0
- Livability +4.1/5.0
- Condition / age +2.5/5.0
- Rent growth +1.1/5.0
- Appreciation +0.0/10.0
$15,900
🖨 Deal sheet 📄 Offer letter ✓ Due diligence
Listing remarks
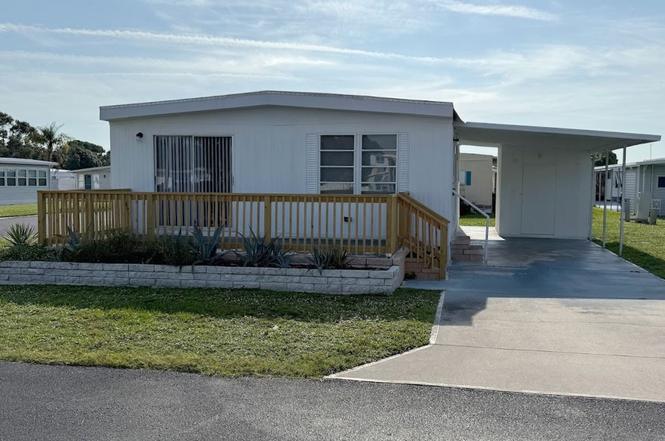
* THIS IS A RESALE LISTING * Bayshore Windmill Village is an active and exciting 55+ Senior Community. Make your dream of home ownership a reality with this 2 bedroom, 2 bathroom home! With a spacious floor plan and a perfectly designed kitchen area, you will love entertaining guests and spending time with family here. In a community with amenities such as a billiards room, a library, and a swimming pool, there is something here for everyone to love. This home won't be on the market long, so call us today for more information or to schedule a tour. Deposits & Fees are subject to change.
Key facts
- Swimming pool
- Billiards room
- Library
Tags
Property features AI
Finance
- Financial info: List price $18,500
Exterior
- Utilities: Electric heating and central air
- Home design: Spec inventory type; Plan: 87560
- Exterior features: Located at 603 63rd Ave W Unit S20, Bradenton, FL 34207
Interior
- Bedrooms: 2 bedrooms
- Bathrooms: 2 bathrooms (full)
- Heating & cooling: Electric heating; Central air conditioning
- Interior features: Living area of 864
Neighborhood map
What this means for you Summary
Snapshot
- This is a 2-bed/2.0-bath manufactured listed at $16k.
Deal economics
- At list price, monthly cash flow is $1k ($13k/yr) — positive.
- The deal already cash-flows at list — no discount required.
- Meets the 1% rule at list price ($2k rent vs $16k).
- Recommended offer: $14k (12.0% below list) — sets the bar for market timing.
- Cap rate 89.6% vs local median 4.7% in Bayshore Gardens — top-decile yield for the area; either an underpriced asset or a hidden risk that comps aren't pricing in. Stress-test before assuming the spread holds.
Location & tenants
- Location reads 82/100 on livability (#72 in FL, #1,180 nationally) — a professional / high-income tenant draw. Strengths: cost of living A+, housing A+, health & safety A+; Watch: crime C-, commute C-, schools F.
- Manatee (suburban): math 54% / reading 50% proficiency, ranked #26 of 73 in FL (top 36%) — acceptable for families but not a draw, mixed tenant base, ~2y average lease.
- Market conditions: Rents falling (-5.5%/yr); 361 active listings in the ZIP; 40 comparable units currently listed for rent nearby; rentals at typical pace (median 24d on market — plan ~3-4 weeks tenant-placement turnaround); 7,472 units permitted in Manatee County in 2024 (1,782 in 5+ unit buildings).
- This rent runs 41% of the median local income ($45k/yr) — at the standard rent-burdened threshold; future hikes will face affordability resistance.
Forward outlook
- Local home prices are declining (-3.0%/yr); year-one equity from $110 of loan paydown is wiped out by about $477 of value loss. Plan a longer hold.
- Manatee County population projected at +43% by 2050 — long-run rental-demand tailwind backs the buy-and-hold thesis.
- At projected returns (-3.0% appreciation + 0.0% rent growth), your $4k cash investment doubles in ~1 year — after that, you're playing with house money.
Negotiation context
- It's been on market 245 days — a 12% lower offer ($14k) is reasonable based on typical stale-listing flexibility.
Risks & watch-outs
- Climate carrying-cost: severe wind risk, 99% chance of damaging wind over 30y; extreme-heat days projected 7→27/yr by 2055 (HVAC capex compounding) — expect insurance premiums to compound above CPI over the hold.
Questions for the listing agent
- It's been on market 245 days. Have you received any prior offers? Is the seller open to a 12% concession, seller financing, or rate buy-down credit?
- Why hasn't it sold? Are there any deal-killer items the seller is aware of (foundation, flood, title, zoning, code violations)?
- Is there a deadline driving the sale (1031 exchange, divorce, estate, relocation)? That informs how much negotiation room exists.
- Schools are F-rated, which usually means shorter tenancies and higher turnover. Who's the typical renter profile here, and what's been the actual vacancy rate?
- The area grade is low — what's the realistic commute time and amenity access for the typical tenant pool here? Any planned neighborhood developments (good or bad) we should know about?
- What's the average days-on-market for RENTAL listings here right now (not sales)? A rising rental-DOM trend means longer vacancies and softer asking-rent achievability than the comps imply.
- What's the recent tenant-quality profile in this submarket — average credit score on applications, eviction rate, late-payment / NSF rate, and stable-employment percentage? A property-management company in the area should have these aggregated.
- How much new for-sale + rental construction is in the pipeline within 1–3 miles? Heavy new supply typically softens prices + rents 12–24 months out; constrained supply supports both.
Investment metrics
- 1% rule
- 9.66% ✓
- Cap rate
- 89.56%
- Cash-on-cash
- 297.39%
- DSCR
- 14.23
- GRM
- 0.9
CMA / ARV
- ARV (on-the-fly)
- $69,984
- Comps found
- 1
Show comp detail 1 sale within ~0.75 mi
| Address | Dist | Beds/Ba | Sqft | Sold | Price | $/sf | Match |
|---|---|---|---|---|---|---|---|
| 5530 Denmark Dr | 0.69mi | 2/2.0 | 864 (0%) | 4mo | $70,000 | $81 | 64 |
Match score weights: distance 35% · size 25% · config 20% · recency 20%. Top-matched comps best support the ARV.
Projected returns pro-forma
-3.0% appreciation · 0.0% rent growth · sell at horizon
- IRR
- —
- Equity multiple
- 15.20×
- Total profit
- $63,218
- Equity at exit
- $2,371
- IRR
- —
- Equity multiple
- 29.80×
- Total profit
- $128,236
- Equity at exit
- $1,375
Cash invested: $4,452 (down + closing). Projections, not guarantees.
Landlord ↔ Tenant lean methodology
- Overall (STATE)
- 87 Strongly Landlord-Friendly
- State Florida
- 87 Strongly Landlord-Friendly · R+3
- County
- — inherits STATE
- City
- — inherits STATE
ZIP-level market 34207
- Rents YoY
- -5.5%
- Active inventory
- 361
- Price-to-rent
- 0.9×
Monthly cashflow live
- Estimated rent
- $1,536 high interval (Pro) →
- Mortgage (P&I)
- −$83
- Tax est. 1.5%
- −$20 /mo · $238/yr
- Insurance
- −$7
- HOA
- −$0
- Vacancy / Maint / Mgmt
- −$322
- Net cashflow
- $1,103
Break-even live
UW: 25.0% down · 7.5% · 30yr · 1.5% tax · 5.0% vac · 8.0% maint · 8.0% mgmt
Financing live
Cash to close
- Down payment
- $3,975
- Closing costs
- $477
- Reserves months
- —
- Total cash needed
- —
Loan-product check · same deal, 3 products live
Conventional
25% down · 7.5% · 30yr
- Down + closing
- —
- Monthly P&I
- —
- Monthly cashflow
- —
- DSCR
- —
- Eligible?
- —
Personal DTI + credit; lowest rate.
DSCR
20% down · 8.5% · 30yr
- Down + closing
- —
- Monthly P&I
- —
- Monthly cashflow
- —
- DSCR
- —
- Eligible?
- —
No personal income docs; deal must DSCR.
Hard money
10% down · 12.0% · 12mo
- Down + closing
- —
- Monthly P&I
- —
- Monthly cashflow
- —
- DSCR
- —
- Eligible?
- —
Short-term bridge; refi at stabilization.
Rent comps 40 comps
| Address | Beds | Baths | Sqft | Rent | $/sqft | DOM | Units | Dist |
|---|---|---|---|---|---|---|---|---|
| 512 60th Avenue Ter W Unit 512 Bradenton, FL | 3.0 | 1.5 | 972 | $1,900 | $1.95 | 10d | 1 | 0.04mi |
| 3 Date Ave Bradenton, FL | 2.0 | 2.0 | 1000 | $1,495 | $1.50 | 23d | 1 | 0.27mi |
| 605 64th Ave W Bradenton, FL | 2.0 | 1.0 | 784 | $1,250 | $1.59 | 11d | 1 | 0.35mi |
| 1009 W 63rd AVE Bradenton, FL | 2.0 | 2.0 | 815 | $1,495 | $1.83 | 15d | 1 | 0.37mi |
| 6434 5th St W Unit 6434 Bradenton, FL | 2.0 | 1.0 | 754 | $2,800 | $3.71 | 19d | 1 | 0.47mi |
| 5828 3rd St E Bradenton, FL | 3.0 | 2.0 | 1036 | $1,995 | $1.93 | 23d | 1 | 0.55mi |
| 1007 57th Ave W Bradenton, FL | 2.0 | 1.5 | 967 | $1,495 | $1.55 | 10d | 1 | 0.59mi |
| 1566 Pleasant Rd Unit J24 Bradenton, FL | 2.0 | 1.0 | 733 | $1,150 | $1.57 | 23d | 1 | 0.65mi |
| 5580 Fountain Lake Cir Bradenton, FL | 1.0–3.0 | 1.0–2.0 | 1052 | $1,908 | $1.81 | 1d | 38 | 0.66mi |
| 5908 17th St W Unit C36 Bradenton, FL | 1.0 | 1.0 | 576 | $950 | $1.65 | 15d | 1 | 0.72mi |
| 5888 17th St W Unit C23 Bradenton, FL | 1.0 | 1.0 | 576 | $1,100 | $1.91 | 23d | 1 | 0.73mi |
| 1839 Sunny Dr Unit E36 Bradenton, FL | 1.0 | 1.0 | 576 | $1,350 | $2.34 | 23d | 1 | 0.75mi |
| 1825 Flamingo Blvd Unit O26 Bradenton, FL | 1.0 | 1.0 | 576 | $1,000 | $1.74 | 23d | 1 | 0.75mi |
| 1807 Restful Dr Unit N4 Bradenton, FL | 2.0 | 1.0 | 733 | $1,150 | $1.57 | 3d | 1 | 0.76mi |
| 5502 8th Street Ct W Bradenton, FL | 2.0 | 2.0 | 896 | $1,595 | $1.78 | 23d | 1 | 0.79mi |
| 1859 Restful Dr Unit L26 Bradenton, FL | 1.0 | 1.0 | 576 | $1,150 | $2.00 | 23d | 1 | 0.81mi |
| 1875 Sunny Dr Unit G32 Bradenton, FL | 1.0 | 1.0 | 576 | $1,100 | $1.91 | 23d | 1 | 0.82mi |
| 5858 Welcome Rd Unit J23 Bradenton, FL | 2.0 | 1.0 | 744 | $1,150 | $1.55 | 3d | 1 | 0.84mi |
| 1874 Sunny Dr Unit F32 Bradenton, FL | 2.0 | 1.0 | 744 | $950 | $1.28 | 23d | 1 | 0.85mi |
| 5955 Palm Ln Unit A33 Bradenton, FL | 2.0 | 1.0 | 744 | $1,150 | $1.55 | 14d | 1 | 0.88mi |
| 5896 Palm Ln Unit C27 Bradenton, FL | 2.0 | 2.0 | 966 | $1,400 | $1.45 | 23d | 1 | 0.88mi |
| 716 56th Avenue Dr E Bradenton, FL | 3.0 | 2.0 | 1000 | $1,700 | $1.70 | 3d | 1 | 0.90mi |
| 5531 16th St W Unit 5537 Bradenton, FL | 2.0 | 1.0 | 750 | $1,650 | $2.20 | 3d | 1 | 0.92mi |
| 2028 Canal Dr Unit M26 Bradenton, FL | 1.0 | 1.0 | 576 | $1,050 | $1.82 | 10d | 1 | 0.93mi |
| 5613 8th St Ct E Bradenton, FL | 3.0 | 2.0 | 1000 | $1,700 | $1.70 | 23d | 1 | 0.96mi |
| 1022 61st Avenue Dr E Bradenton, FL | 3.0 | 1.0 | 970 | $1,450 | $1.49 | 15d | 1 | 0.96mi |
| 5513 18th St W Bradenton, FL | 2.0 | 1.0 | 1000 | $1,499 | $1.50 | 23d | 1 | 0.97mi |
| 5820 21st St W Bradenton, FL | 3.0 | 2.0 | 1116 | $1,995 | $1.79 | 3d | 1 | 0.98mi |
| 1122 68th Avenue Dr W Unit 5 Bradenton, FL | 2.0 | 1.0 | 840 | $1,450 | $1.73 | 3d | 1 | 1.01mi |
| 5906 Garden Ln Unit A22 Bradenton, FL | 2.0 | 2.0 | 840 | $1,200 | $1.43 | 3d | 1 | 1.01mi |
| 6043 Coral Way Bradenton, FL | 2.0 | 1.0 | 865 | $1,700 | $1.97 | 15d | 1 | 1.02mi |
| 1109 59th Avenue Cir E Unit 1109 Bradenton, FL | 3.0 | 2.0 | 945 | $1,795 | $1.90 | 23d | 1 | 1.02mi |
| 2547 60th Ave W Unit L-36 Bradenton, FL | 1.0 | 1.0 | 576 | $1,100 | $1.91 | 15d | 1 | 1.08mi |
| 2423 60th Ave W Unit K29 Bradenton, FL | 2.0 | 2.0 | 1026 | $1,495 | $1.46 | 23d | 1 | 1.08mi |
| 1207 62nd Ave E Bradenton, FL | 3.0 | 2.0 | 1018 | $1,995 | $1.96 | 23d | 1 | 1.10mi |
| 110 52nd Avenue Ter E Bradenton, FL | 2.0 | 1.5 | 684 | $1,450 | $2.12 | 23d | 1 | 1.10mi |
| 6205 12th Street Ct E Bradenton, FL | 3.0 | 2.0 | 1018 | $1,895 | $1.86 | 23d | 1 | 1.12mi |
| 5996 Hibiscus Dr #6 Bradenton, FL | 2.0 | 1.0 | 865 | $1,550 | $1.79 | 15d | 1 | 1.12mi |
| 205 52nd Avenue Dr W Bradenton, FL | 1.0 | 1.0 | 528 | $1,200 | $2.27 | 23d | 1 | 1.14mi |
| 608 51st Ave W Bradenton, FL | 2.0 | 1.5 | 760 | $2,200 | $2.89 | 23d | 1 | 1.28mi |
Listing history 14 events
-
2026-06-18days on market $15,900 Active 245 DOM
-
2026-06-17days on market $15,900 Active 244 DOM
-
2026-06-16days on market $15,900 Active 243 DOM
-
2026-06-15days on market $15,900 Active 242 DOM
-
2026-06-13days on market $15,900 Active 240 DOM
-
2026-06-13days on market $15,900 Active 239 DOM
-
2026-06-10days on market $15,900 Active 237 DOM
-
2026-06-09days on market $15,900 Active 236 DOM
-
2026-06-08days on market $15,900 Active 235 DOM
-
2026-06-08days on market $15,900 Active 234 DOM
-
2026-06-03days on market $15,900 Active 230 DOM
-
2026-06-02days on market $15,900 Active 229 DOM
-
2026-06-01pricedays on market $15,900 Active 228 DOM
-
2026-05-31days on market $15,400 Active 227 DOM
ⓘ Source: listings_history table (triggers on properties + properties_extension) + one-shot
backfill from property_details.listing_events for pre-trigger history.
Climate risk First Street
- Flood 4/10 Moderate FEMA zone X (unshaded) · 24% chance over 30 yrs
- Wildfire 1/10 Low
- Heat 10/10 Extreme 7 d/yr ≥106°F today · 27 d/yr by 30 yrs out
- Wind 10/10 Extreme 99% chance of damaging wind over 30 yrs
- Air quality 2/10 Low 1 unhealthy d/yr today · 2 by 30 yrs out
Nearby sold comps map
Loading sold comps map…
Walkable amenities ~0.75 mi
Loading nearby amenities…
Taxation est. · year 1
- Rental income
- $18,429
- − Mortgage interest
- −$891
- − Property taxes
- −$238
- − Insurance
- −$80
- − Repairs & maintenance
- −$1,474
- − Management
- −$1,474
- − Depreciation
- −$463
- Taxable income
- $13,809
- Est. tax owed @ 24.0%
- −$3,314
- After-tax cash flow
- $9,926/yr
For passive investors: Depreciation is non-cash, so a rental often shows a tax loss while cash-flowing — sheltering income. Rental losses are passive: they offset passive income freely, and up to $25,000/yr can offset ordinary (W-2) income if you actively participate and your MAGI is under $100k (phasing out to $0 by $150k); unused losses carry forward. On sale, claimed depreciation is recaptured at up to 25%, and gains may owe capital-gains tax (a 1031 exchange can defer both). Figures are a year-1 estimate at your 24.0% rate — not tax advice; consult a CPA.
Schools (NCES district)
- District
- Manatee
- NCES district ID
- 1201230
- Math proficiency
- 54% ▼ -6.00%
- Reading proficiency
- 50% ▼ -2.00%
- Median HH income
- $49,607
- Composite
- 44.43/100
- National rank
- #2806
- State rank
- #26 of 73 in FL
Livability — Bayshore Gardens
- Score
- 82/100
- State rank
- #72
- US rank
- #1180
Category grades
Schools grade is shown separately in the Schools card above.
Census & demographics
- Census place
- Bayshore Gardens, FL
- County
- Manatee County · 416,364 people
- City population
- 33,840
- Metro
- North Port-Sarasota-Bradenton, FL
- Population (ZIP)
- 34,081
- Household income
- $45,010
- Rent vs Own
- Severe rent burden
- 1474.0
Population outlook (Manatee County) Hauer SSP2
- Today (2025)
- 447,342 people
- By 2030
- 488,911 · +9.3%
- By 2040
- 567,934 · +27.0%
- By 2050
- 637,995 · +42.6%
- By 2075
- 781,970 · +74.8%
- By 2100
- 848,272 · +89.6%
Race, ethnicity, and origin ACS 2023
- Neighborhood character
- Diverse neighborhood (Simpson 0.57)
- Race & ethnicity
- White 58% Hispanic / Latino 29% Two or more races 13% Black 7%
- Hispanic origin (detail)
- Mexican 12% Puerto Rican 4% Cuban 3% Dominican 1%
- Common ancestry
- Lithuanian 3% Romanian 2% Slovak 2%
- Foreign-born
- 16% · Canada, Jamaica
- Languages at home
- 74% English-only · Spanish 22% Other Indo-European 1% French/Haitian/Cajun 1%
Political lean MEDSL · Manatee
- 2024 margin
- Strong R (+23.5) · D 37.9% · R 61.4%
- 2008→2024 swing
- -16.5pp toward R · 2008: -7.0pp · 2024: -23.5pp
- All cycles
- 2024: R+23.5 2020: R+16.1 2016: R+17.1 2012: R+12.5 2008: R+7.0
Not yet ingested
- Civics
- —
Market trends
- HPI YoY
- ▼ -305.32%
- Current HPI
- 369.9899
- Rent YoY
- ▼ -5.50%
- Metro
- North Port-Sarasota-Bradenton, FL
- State GDP YoY
- ▲ 3.28%
- F500 in state
- 36
Industry mix (Fortune 500 HQ in FL)
| Industry | F500 HQs | Revenue |
|---|---|---|
| Industrial Technology | 2 | $29B |
|
||
| Insurance | 2 | $17B |
|
||
| Retail | 1 | $60B |
|
||
| Technology Distribution | 1 | $58B |
|
||
| Homebuilding | 1 | $35B |
|
||
| Technology Manufacturing | 1 | $35B |
|
||
Cash-flow waterfall
monthlySold comps — $/sqft
last 12 mo · ≤1 miLoading sold comps…