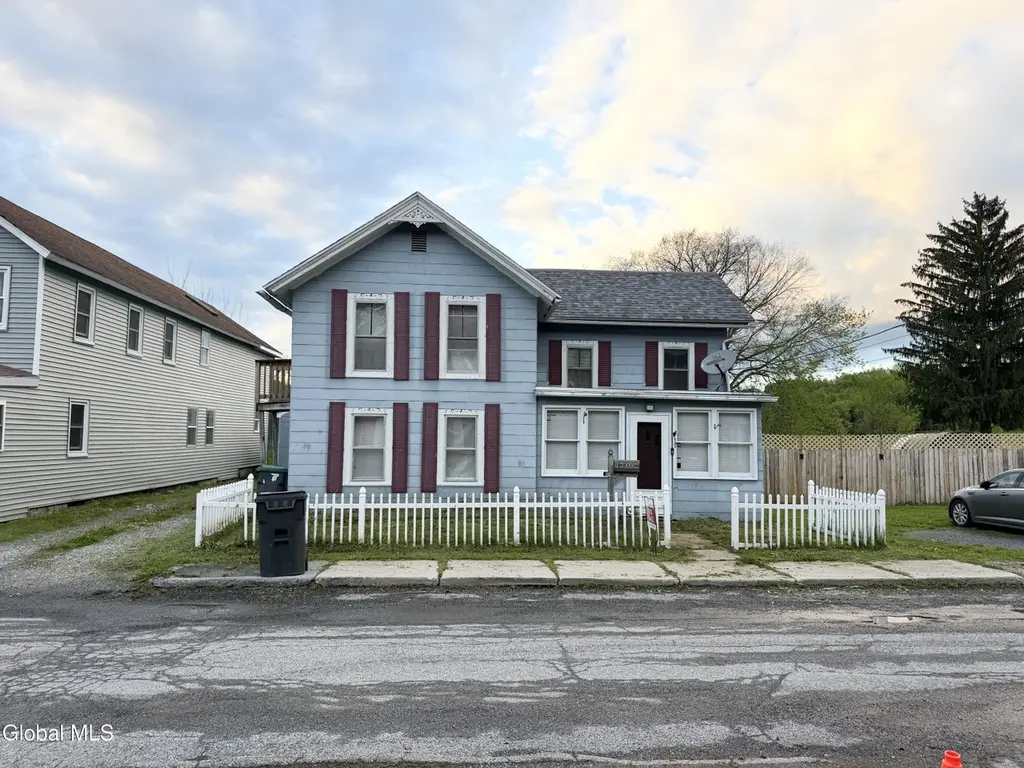
11 Nixon St · Hoosick Falls, NY
Flood risk 1/10 · Minimal
- FEMA flood zone
- X (unshaded)
- Chance of flooding over 30 yrs
- 0.0%
- Est. flood insurance / yr
- $473 – $860
Fire risk 3/10 · Minor
- Est. fire insurance / yr
- $691 – $1,283
Heat risk 3/10 · Minor
- Hot days now (above 94°F)
- 7 days/yr
- Hot days in 30 yrs
- 16 days/yr
Wind risk 3/10 · Minor
- Chance of severe wind over 30 yrs
- 6.0%
Air-quality risk 2/10 · Minimal
- Unhealthy air days now
- 1 days/yr
- Unhealthy air days in 30 yrs
- 1 days/yr
Risk factors via First Street. Map © Google.
Why this score? — see what drove the D+ grade
The composite is a weighted blend of 9 inputs, each scored 0–100. Each bar is that input's sub-score; the figure is the points it added to the 100-point composite (weight × sub-score).
- ARV discount +14.3/15.0
- Cash flow +9.2/30.0
- Appreciation +5.5/10.0
- Schools +4.4/10.0
- 1% rule +3.7/10.0
- Livability +3.6/5.0
- DSCR +2.6/10.0
- Rent growth +2.5/5.0
- Condition / age +2.5/5.0
$165,000
🖨 Deal sheet 📄 Offer letter ✓ Due diligence
Listing remarks MLS
Located on a dead-end street this large family home has room to entertain. 3 Bedrooms, 1 and half bath. Plenty of seating for family dinners or host backyard bar-b-ques in your large fenced in backyard. Front Enclosed Porch, first floor laundry and one car garage are some of the benefits to this home.
Key facts
- Off street parking
- Fenced in back yard
- 9,583 sq ft lot
Tags
Property features AI
Exterior
- Parking: Detached garage; Total of 4 parking spaces; 1 garage space
- Utilities: Public water; Public sewer; 100 amp electric service with circuit breakers; Cable available
- Home design: Single family residence; Entry on first level
- Construction: Masonite exterior; Asphalt roof; Unfinished basement
- Exterior features: Covered pressure-treated deck; Storm doors; Privacy backyard fencing; Back yard fencing; Garage(s) on property
Interior
- Kitchen: Electric oven; Refrigerator; Electric water heater
- Bedrooms: Bedroom on first floor; Bedroom on second floor; Bedroom on second floor
- Flooring: Tile; Carpet; Linoleum
- Bathrooms: One full bathroom on second floor; One half bathroom on first floor
- Heating & cooling: Hot water heating; Pellet stove heating; Zoned heating; Window unit cooling
- Interior features: High speed internet; Pellet stove
- Laundry & utility: Main level laundry room; Washer/Dryer included
Neighborhood map
What this means for you Summary
Snapshot
- This is a 2-bed/1.5-bath single-family listed at $165k.
Deal economics
- At list price, monthly cash flow is $-124 ($-1k/yr) — negative.
- To cash-flow at today's rent, offer at most $143k (13.3% below list).
- To meet the 1% rule (rent ≥ 1% of price), the offer needs to be $143k (13.1% below list).
- Recommended offer: $143k (13.3% below list) — sets the bar for cash-flow.
Location & tenants
- Location reads 72/100 on livability (#371 in NY) — a middle-class / working-renter tenant base. Strengths: housing A+, health & safety A+, cost of living A; Watch: amenities F, commute F.
- Hoosick Falls Central School District (rural): math 52% / reading 46% proficiency, ranked #469 of 755 in NY (top 62%) — families likely to look elsewhere, expect single-tenant / working-renter base with shorter leases.
- Zoned schools: Hoosick Falls Elementary School (math 54% / reading 64%, grade B-, #745 of 2,108 statewide, top 39%, 398 students, 53% FRL); Hoosick Falls High School (math 87% / reading 82%, grade A, #379 of 1,100 statewide, top 36%, 329 students, 51% FRL) — zoned schools average 52% FRL vs 35% district-wide (17 pts higher); higher-poverty schools than district average — tighter screening recommended.
- Zoned-school proficiency averages 72% at this address vs 49% district-wide (+23 pts) — the actual schools serving this property are materially stronger than the Hoosick Falls Central School District average implies; a family-tenant draw the district grade alone would hide.
- Market conditions: 49 active listings in the ZIP; 405 units permitted in Rensselaer County in 2024 (224 in 5+ unit buildings).
Forward outlook
- In year one you build about $3k of equity ($1k loan paydown + $2k appreciation (1.0% local appreciation)).
- Rensselaer County population projected to shrink 6% by 2050 — rents likely to lag national; underwrite the cash flow, not the appreciation.
Negotiation context
- It's been on market 36 days — a 3% lower offer ($160k) is reasonable based on typical stale-listing flexibility.
- 3 sale attempts since 29y ago with the ask held roughly flat each time — persistent listings suggest the price (not the market) is what's stuck; bring a comps-based counter.
Risks & watch-outs
- Watch-outs: built in 1870 — expect roof / HVAC / electrical / plumbing capex.
Questions for the listing agent
- What do current leases actually rent for vs. the listed asking? Can we see a recent rent roll and the last 12 months of T-12 income?
- It's been on market 36 days. Have you received any prior offers? Is the seller open to a 13% concession, seller financing, or rate buy-down credit?
- Built in 1870 — when were the roof, HVAC, electrical panel, plumbing, and water heater last replaced?
- Is there a deadline driving the sale (1031 exchange, divorce, estate, relocation)? That informs how much negotiation room exists.
- The area grade is low — what's the realistic commute time and amenity access for the typical tenant pool here? Any planned neighborhood developments (good or bad) we should know about?
- What's the average days-on-market for RENTAL listings here right now (not sales)? A rising rental-DOM trend means longer vacancies and softer asking-rent achievability than the comps imply.
- What's the recent tenant-quality profile in this submarket — average credit score on applications, eviction rate, late-payment / NSF rate, and stable-employment percentage? A property-management company in the area should have these aggregated.
- How much new for-sale + rental construction is in the pipeline within 1–3 miles? Heavy new supply typically softens prices + rents 12–24 months out; constrained supply supports both.
Investment metrics
- 1% rule
- 0.87% ✗
- Cap rate
- 5.39%
- Cash-on-cash
- -3.23%
- DSCR
- 0.86
- GRM
- 9.6
CMA / ARV
- ARV (median comp)
- $194,536
- List price
- $165,000
- Delta
- -15.18%
- Verdict
- UNDERPRICED
- Comps
- 20 within 1.0 mi
Show comp detail 12 sales within ~0.75 mi
| Address | Dist | Beds/Ba | Sqft | Sold | Price | $/sf | Match |
|---|---|---|---|---|---|---|---|
| 118 Main St | 0.32mi | 3/1.5 (+1) | 1,684 (+3%) | 8mo | $255,000 | $151 | 69 |
| 12 Mccaffrey St | 0.41mi | 2/2.5 | 1,607 (-2%) | 9mo | $220,000 | $137 | 66 |
| 6 1st St | 0.28mi | 3/1.5 (+1) | 1,510 (-8%) | 13mo | $152,600 | $101 | 58 |
| 3 Estabrook Ave | 0.39mi | 3/2.0 (+1) | 1,515 (-8%) | 6mo | $192,000 | $127 | 57 |
| 2 Cummings St | 0.58mi | 3/1.5 (+1) | 1,597 (-3%) | 8mo | $305,000 | $191 | 57 |
| 61 High St | 0.51mi | 3/1.5 (+1) | 1,738 (+6%) | 7mo | $165,000 | $95 | 56 |
| 26 Seward St | 0.54mi | 3/2.0 (+1) | 1,600 (-2%) | 12mo | $215,000 | $134 | 54 |
| 20 Carey Ave | 0.41mi | 3/1.0 (+1) | 1,493 (-9%) | 8mo | $160,000 | $107 | 52 |
| 79 High St | 0.55mi | 3/2.0 (+1) | 1,755 (+7%) | 9mo | $309,000 | $176 | 48 |
| 166 Church St | 0.41mi | 3/1.0 (+1) | 1,440 (-12%) | 8mo | $240,000 | $167 | 47 |
| 72 Wilder Ave | 0.57mi | 3/1.0 (+1) | 1,762 (+7%) | 11mo | $125,000 | $71 | 45 |
| 84 Richmond Ave | 0.71mi | 2/1.5 | 1,447 (-12%) | 9mo | $155,000 | $107 | 39 |
Match score weights: distance 35% · size 25% · config 20% · recency 20%. Top-matched comps best support the ARV.
Projected returns pro-forma
1.02% appreciation · 3.0% rent growth · sell at horizon
- IRR
- -2.0%
- Equity multiple
- 0.90×
- Total profit
- $-4,568
- Equity at exit
- $56,503
- IRR
- 3.1%
- Equity multiple
- 1.38×
- Total profit
- $17,402
- Equity at exit
- $75,222
Cash invested: $46,200 (down + closing). Projections, not guarantees.
Landlord ↔ Tenant lean methodology
- Overall (STATE)
- 15 Strongly Tenant-Friendly
- State New York
- 15 Strongly Tenant-Friendly · D+10
- County
- — inherits STATE
- City
- — inherits STATE
ZIP-level market 12090
- Home prices YoY
- 0.5%
- Active inventory
- 49
- Price-to-rent
- 9.6×
Monthly cashflow live
- Estimated rent
- $1,433 medium interval (Pro) →
- Mortgage (P&I)
- −$865
- Tax from tax record
- −$323 /mo · $3,871/yr
- Insurance
- −$69
- HOA
- −$0
- Vacancy / Maint / Mgmt
- −$301
- Net cashflow
- $-124
Break-even live
UW: 25.0% down · 7.5% · 30yr · 1.5% tax · 5.0% vac · 8.0% maint · 8.0% mgmt
Financing live
Cash to close
- Down payment
- $41,250
- Closing costs
- $4,950
- Reserves months
- —
- Total cash needed
- —
Loan-product check · same deal, 3 products live
Conventional
25% down · 7.5% · 30yr
- Down + closing
- —
- Monthly P&I
- —
- Monthly cashflow
- —
- DSCR
- —
- Eligible?
- —
Personal DTI + credit; lowest rate.
DSCR
20% down · 8.5% · 30yr
- Down + closing
- —
- Monthly P&I
- —
- Monthly cashflow
- —
- DSCR
- —
- Eligible?
- —
No personal income docs; deal must DSCR.
Hard money
10% down · 12.0% · 12mo
- Down + closing
- —
- Monthly P&I
- —
- Monthly cashflow
- —
- DSCR
- —
- Eligible?
- —
Short-term bridge; refi at stabilization.
Listing history 25 events
-
2026-06-19days on market $165,000 Active 36 DOM
-
2026-06-18days on market $165,000 Active 35 DOM
-
2026-06-17days on market $165,000 Active 34 DOM
-
2026-06-16days on market $165,000 Active 33 DOM
-
2026-06-15days on market $165,000 Active 32 DOM
-
2026-06-14days on market $165,000 Active 30 DOM
-
2026-06-12remarks 479-char remark
-
2026-06-12days on market $165,000 Active 29 DOM
-
2026-06-09days on market $165,000 Active 26 DOM
-
2026-06-08days on market $165,000 Active 25 DOM
-
2026-06-07pricedays on market $165,000 Active 24 DOM
-
2026-06-04days on market $169,000 Active 20 DOM
-
2026-06-02days on market $169,000 Active 19 DOM
-
2026-06-01days on market $169,000 Active 18 DOM
-
2026-05-31days on market $169,000 Active 17 DOM
-
2026-05-31days on market $169,000 Active 16 DOM
-
2026-05-14$169,000 Active 250-char remark
-
2023-09-19soldstatus $150,000
-
2023-09-15soldstatus $150,000 Closed 302-char remark
Show marketing remark (302 chars)
Located on a dead-end street this large family home has room to entertain. 3 Bedrooms, 1 and half bath. Plenty of seating for family dinners or host backyard bar-b-ques in your large fenced in backyard. Front Enclosed Porch, first floor laundry and one car garage are some of the benefits to this home.
-
2023-07-20status Pending 302-char remark
Show marketing remark (302 chars)
Located on a dead-end street this large family home has room to entertain. 3 Bedrooms, 1 and half bath. Plenty of seating for family dinners or host backyard bar-b-ques in your large fenced in backyard. Front Enclosed Porch, first floor laundry and one car garage are some of the benefits to this home.
-
2023-07-12$150,000 Active 302-char remark
Show marketing remark (302 chars)
Located on a dead-end street this large family home has room to entertain. 3 Bedrooms, 1 and half bath. Plenty of seating for family dinners or host backyard bar-b-ques in your large fenced in backyard. Front Enclosed Porch, first floor laundry and one car garage are some of the benefits to this home.
-
1998-04-17soldstatus $49,000
-
1998-04-10soldstatus $49,000
Show marketing remark (102 chars)
A GREAT FAMILY HOME WITH NEW ROOF AND NEW FURNACE. FENCED BACK YARD. AFFORDABLY PRICED. Good Condition
-
1998-02-03historical
Show marketing remark (102 chars)
A GREAT FAMILY HOME WITH NEW ROOF AND NEW FURNACE. FENCED BACK YARD. AFFORDABLY PRICED. Good Condition
-
1997-09-19$52,000
Show marketing remark (102 chars)
A GREAT FAMILY HOME WITH NEW ROOF AND NEW FURNACE. FENCED BACK YARD. AFFORDABLY PRICED. Good Condition
ⓘ Source: listings_history table (triggers on properties + properties_extension) + one-shot
backfill from property_details.listing_events for pre-trigger history.
Tax reassessment forecast NY · Partial reset (capped growth)
- Current annual tax
- $3,871 · $323/mo
- Projected year-2 tax
- $3,871 · $323/mo
- Expected delta
- $0/yr ($0/mo · 0.0%)
ⓘ Screening estimate from a state-policy table — verify with the county assessor before closing.
Climate risk First Street
- Flood 1/10 Low FEMA zone X (unshaded) · 0% chance over 30 yrs
- Wildfire 3/10 Moderate
- Heat 3/10 Moderate 7 d/yr ≥94°F today · 16 d/yr by 30 yrs out
- Wind 3/10 Moderate 6% chance of damaging wind over 30 yrs
- Air quality 2/10 Low 1 unhealthy d/yr today · 1 by 30 yrs out
Nearby sold comps map
Loading sold comps map…
Walkable amenities ~0.75 mi
Loading nearby amenities…
Taxation est. · year 1
- Rental income
- $17,201
- − Mortgage interest
- −$9,243
- − Property taxes
- −$3,871
- − Insurance
- −$825
- − Repairs & maintenance
- −$1,376
- − Management
- −$1,376
- − Depreciation
- −$4,800
- Taxable loss
- −$4,290
- Est. tax savings @ 24.0%
- +$1,029
- After-tax cash flow
- $-461/yr
For passive investors: Depreciation is non-cash, so a rental often shows a tax loss while cash-flowing — sheltering income. Rental losses are passive: they offset passive income freely, and up to $25,000/yr can offset ordinary (W-2) income if you actively participate and your MAGI is under $100k (phasing out to $0 by $150k); unused losses carry forward. On sale, claimed depreciation is recaptured at up to 25%, and gains may owe capital-gains tax (a 1031 exchange can defer both). Figures are a year-1 estimate at your 24.0% rate — not tax advice; consult a CPA.
Schools (NCES district)
- District
- Hoosick Falls Central School District
- NCES district ID
- 3614760
- Math proficiency
- 52% ▲ 5.00%
- Reading proficiency
- 46% ▬ 0.00%
- Median HH income
- $54,349
- Composite
- 44.44/100
- National rank
- #6093
- State rank
- #469 of 755 in NY
Livability — Hoosick Falls
- Score
- 72/100
- State rank
- #371
- US rank
- #6412
Category grades
Schools grade is shown separately in the Schools card above.
Census & demographics
- Census place
- Hoosick Falls, NY
- Population (ZIP)
- 5,874
Population outlook (Rensselaer County) Hauer SSP2
- Today (2025)
- 162,400 people
- By 2030
- 161,746 · -0.4%
- By 2040
- 158,095 · -2.7%
- By 2050
- 152,966 · -5.8%
- By 2075
- 140,767 · -13.3%
- By 2100
- 124,727 · -23.2%
Race, ethnicity, and origin ACS 2023
- Neighborhood character
- Predominantly White (93%)
- Race & ethnicity
- White 93% Hispanic / Latino 5% Two or more races 2%
- Common ancestry
- Romanian 6% Lithuanian 5% Iranian 3%
- Foreign-born
- 2% · Canada
- Languages at home
- 94% English-only · Spanish 2% German/W. Germanic 1% Russian/Polish/Slavic 1%
Political lean MEDSL · Rensselaer
- 2024 margin
- Toss-up / Even · D 50.7% · R 49.3%
- 2008→2024 swing
- -8.0pp toward R · 2008: 9.3pp · 2024: 1.4pp
- All cycles
- 2024: D+1.4 2020: D+5.6 2016: R+2.9 2012: D+11.8 2008: D+9.3
Not yet ingested
- Civics
- —
Market trends
- HPI YoY
- ▲ 1.02%
- Current HPI
- 218.9096
- Rent YoY
- —
- Metro
- —
- State GDP YoY
- ▲ 2.60%
- F500 in state
- 92
Industry mix (Fortune 500 HQ in NY)
| Industry | F500 HQs | Revenue |
|---|---|---|
| Financial Services | 10 | $950B |
|
||
| Consumer Goods | 9 | $162B |
|
||
| Insurance | 4 | $225B |
|
||
| Telecommunications | 2 | $144B |
|
||
| Pharmaceuticals | 2 | $112B |
|
||
| Media / Entertainment | 2 | $69B |
|
||
Price history
+217.3% since first listed10 events — show timeline
- 2026-06-05 Price Changed $165,000 Global MLS
- 2026-05-14 Listed $169,000 Global MLS
- 2023-09-19 Sold (Public Records) $150,000 Public Records
- 2023-09-15 Sold (MLS) $150,000 Global MLS
- 2023-07-20 Pending — Global MLS
- 2023-07-12 Listed $150,000 Global MLS
- 1998-04-17 Sold (Public Records) $49,000 Public Records
- 1998-04-10 Sold (MLS) $49,000 Global MLS
- 1998-02-03 Listing Removed — Global MLS
- 1997-09-19 Listed $52,000 Global MLS
Property tax history
+3.8%/yrLatest (2025): $3,871 · -2.8% YoY. Source: county tax records.
Cash-flow waterfall
monthlySold comps — $/sqft
last 12 mo · ≤1 miLoading sold comps…