12610 Pirate Bend Dr · Texas City, TX
Flood risk 5/10 · Moderate
- FEMA flood zone
- X (unshaded)
- Chance of flooding over 30 yrs
- 0.66%
- Est. flood insurance / yr
- $507 – $1,088
Fire risk 4/10 · Minor
- Est. fire insurance / yr
- $1,222 – $2,270
Heat risk 10/10 · Severe
- Hot days now (above 111°F)
- 7 days/yr
- Hot days in 30 yrs
- 27 days/yr
Wind risk 9/10 · Severe
- Chance of severe wind over 30 yrs
- 99.0%
Air-quality risk 3/10 · Minor
- Unhealthy air days now
- 2 days/yr
- Unhealthy air days in 30 yrs
- 2 days/yr
Risk factors via First Street. Map © Google.
Why this score? — see what drove the D grade
The composite is a weighted blend of 9 inputs, each scored 0–100. Each bar is that input's sub-score; the figure is the points it added to the 100-point composite (weight × sub-score).
- ARV discount +11.1/15.0
- Cash flow +10.8/30.0
- 1% rule +3.8/10.0
- Condition / age +3.8/5.0
- Schools +3.5/10.0
- DSCR +3.1/10.0
- Livability +3.1/5.0
- Rent growth +2.5/5.0
- Appreciation +0.0/10.0
$259,800
🖨 Deal sheet (PDF) 📄 Offer letter ✓ Due diligence
Listing remarks MLS
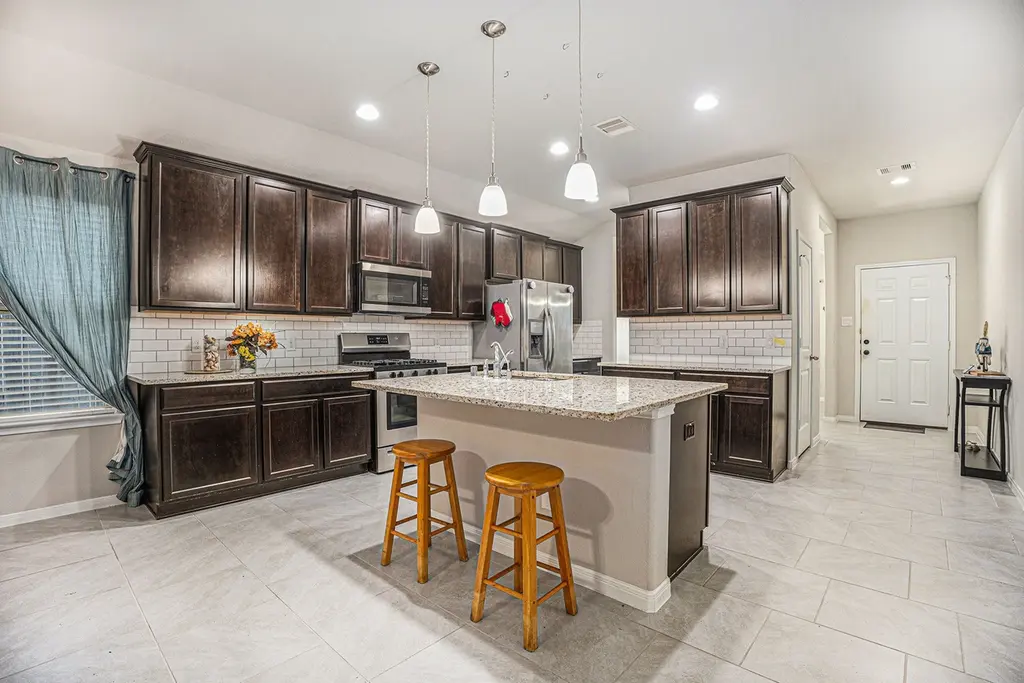
MOTIVATED SELLER ***This home checks all the boxes***NO FLOOD(x-zone)--3BR, spacious Open Concept Chefs Kitchen & Living/Family Rm. Granite counters, center island breakfast bar+pantry. Soft close drawers/cabinets. High Ceilings & Primary BR features walk-in closet, double vanity, garden size soaker tub, separate shower. Full brick surrounds home with cement board soffit/fascia+under-eave lighting in front of home. Whole house LED lighting and 2" Wood Plantation Blinds. Mature trees and landscaped front yard w/manual sprinkler system. Amenities: 12-acre Crystal Lagoon, 2 resort-style pools, splash pad, trails, Dog park, Soccer fields, 1/2 B-Ball Crt, two fitness centers + a Club House AND they're adding a pickleball court! Also subdivision security is all part of the resort-style living in the Lago Mar planned community. Relax with Bay Area breezes as you enjoy the white-sand beaches, swim in crystal waters or dine lagoon side. Nationally recognized dining & shopping nearby.
Key facts
- Double vanity
- Walk-in closet
- Granite counters
Tags
Neighborhood map
What this means for you Summary
Snapshot
- This is a 3-bed/2.0-bath single-family listed at $260k. Condition is rated good.
Deal economics
- At list price, monthly cash flow is $-119 ($-1k/yr) — negative.
- To cash-flow at today's rent, offer at most $243k (6.6% below list).
- To meet the 1% rule (rent ≥ 1% of price), the offer needs to be $227k (12.5% below list).
- Recommended offer: $227k (12.5% below list) — sets the bar for 1% rule.
- Cap rate 5.7% vs local median 4.3% in Texas City — top-decile yield for the area; either an underpriced asset or a hidden risk that comps aren't pricing in. Stress-test before assuming the spread holds.
Location & tenants
- Location reads 62/100 on livability (#907 in TX) — a middle-class / working-renter tenant base. Strengths: cost of living A+, housing A+; Watch: crime D+, amenities F, commute F.
- Dickinson ISD (suburban): math 39% / reading 40% proficiency, ranked #366 of 826 in TX (top 44%) — families likely to look elsewhere, expect single-tenant / working-renter base with shorter leases; 60% free/reduced lunch — lower-income household profile, screen leases tightly.
- Zoned schools: Hughes Road El (math 36% / reading 31%, grade F, #2,174 of 4,322 statewide, top 51%, 707 students, 67% FRL); Dunbar Middle (math 25% / reading 20%, grade F, #1,341 of 1,662 statewide, top 82%, 654 students, 78% FRL); Dickinson H S (math 30% / reading 46%, grade F, #880 of 1,632 statewide, top 54%, 3,619 students, 64% FRL).
- Market conditions: Rents soft (-0.1%/yr); 678 active listings in the ZIP; 8 comparable units currently listed for rent nearby; rentals leasing fast (median 7d on market — plan ~1-2 weeks tenant-placement turnaround); solid renter incomes; 3,258 units permitted in Galveston County in 2024 (0 in 5+ unit buildings).
- This rent runs 31% of the median local income ($89k/yr) — at the standard rent-burdened threshold; future hikes will face affordability resistance.
Forward outlook
- Local home prices are declining (-3.0%/yr); year-one equity from $2k of loan paydown is wiped out by about $8k of value loss. Plan a longer hold.
- Galveston County population projected at +43% by 2050 — long-run rental-demand tailwind backs the buy-and-hold thesis.
Negotiation context
- It's been on market 268 days — a 12% lower offer ($229k) is reasonable based on typical stale-listing flexibility.
- 6 sale attempts since 4y ago with the ask held roughly flat each time — persistent listings suggest the price (not the market) is what's stuck; bring a comps-based counter.
Risks & watch-outs
- Climate carrying-cost: moderate flood risk; severe wind risk, 99% chance of damaging wind over 30y; extreme-heat days projected 7→27/yr by 2055 (HVAC capex compounding) — expect insurance premiums to compound above CPI over the hold.
Questions for the listing agent
- What do current leases actually rent for vs. the listed asking? Can we see a recent rent roll and the last 12 months of T-12 income?
- It's been on market 268 days. Have you received any prior offers? Is the seller open to a 12% concession, seller financing, or rate buy-down credit?
- What does the HOA fee cover, when was the last increase, and are there any pending special assessments or reserve-fund shortfalls?
- Why hasn't it sold? Are there any deal-killer items the seller is aware of (foundation, flood, title, zoning, code violations)?
- Is there a deadline driving the sale (1031 exchange, divorce, estate, relocation)? That informs how much negotiation room exists.
- Schools are F-rated, which usually means shorter tenancies and higher turnover. Who's the typical renter profile here, and what's been the actual vacancy rate?
- Crime grade is D in this area — have there been break-ins, vandalism, or insurance claims at this property in the last 3 years? What carrier currently insures it and at what premium?
- The area grade is low — what's the realistic commute time and amenity access for the typical tenant pool here? Any planned neighborhood developments (good or bad) we should know about?
- What's the average days-on-market for RENTAL listings here right now (not sales)? A rising rental-DOM trend means longer vacancies and softer asking-rent achievability than the comps imply.
- What's the recent tenant-quality profile in this submarket — average credit score on applications, eviction rate, late-payment / NSF rate, and stable-employment percentage? A property-management company in the area should have these aggregated.
- How much new for-sale + rental construction is in the pipeline within 1–3 miles? Heavy new supply typically softens prices + rents 12–24 months out; constrained supply supports both.
Investment metrics
- 1% rule
- 0.88% ✗
- Cap rate
- 5.74%
- Cash-on-cash
- -1.96%
- DSCR
- 0.91
- GRM
- 9.5
CMA / ARV
- ARV (median comp)
- $282,574
- List price
- $259,800
- Delta
- -8.06%
- Verdict
- FAIR
- Comps
- 20 within 1.0 mi
Show comp detail 12 sales within ~0.75 mi
| Address | Dist | Beds/Ba | Sqft | Sold | Price | $/sf | Match |
|---|---|---|---|---|---|---|---|
| 2317 Nautica Terrace Dr | 0.13mi | 3/2.0 | 1,666 (-2%) | 1mo | $242,500 | $146 | 90 |
| 2322 Nautica Terrace Dr | 0.16mi | 3/2.0 | 1,575 (-7%) | 1mo | $250,000 | $159 | 80 |
| 2315 Oyster Bay Ave | 0.18mi | 3/2.5 | 1,615 (-5%) | 3mo | $250,000 | $155 | 79 |
| 109 Indigo Brush Dr | 0.33mi | 3/2.5 | 1,719 (+1%) | 4mo | $235,000 | $137 | 77 |
| 2210 Mirror Ridge Ct | 0.05mi | 4/2.0 (+1) | 1,831 (+8%) | 5mo | $299,990 | $164 | 75 |
| 2215 Manta Way | 0.28mi | 3/2.0 | 1,575 (-7%) | 1mo | $245,000 | $156 | 74 |
| 12801 Pirate Bend Dr | 0.16mi | 3/2.0 | 1,535 (-9%) | 4mo | $264,000 | $172 | 74 |
| 13137 Leisure Cove Dr | 0.52mi | 4/2.5 (+1) | 1,785 (+5%) | 2mo | $309,900 | $174 | 58 |
| 211 Hawks View Dr | 0.52mi | 4/2.0 (+1) | 1,875 (+11%) | 1mo | $267,500 | $143 | 52 |
| 6 Prairie Oaks Dr | 0.61mi | 3/2.0 | 1,860 (+10%) | 4mo | $295,000 | $159 | 52 |
| 2910 Mariner Island Dr | 0.74mi | 3/2.0 | 1,819 (+7%) | 3mo | $358,990 | $197 | 51 |
| 13421 Diamond Reef Ln | 0.73mi | 3/2.0 | 1,900 (+12%) | 1mo | $284,900 | $150 | 45 |
Match score weights: distance 35% · size 25% · config 20% · recency 20%. Top-matched comps best support the ARV.
Projected returns pro-forma
-3.0% appreciation · 0.0% rent growth · sell at horizon
- IRR
- -23.2%
- Equity multiple
- 0.23×
- Total profit
- $-56,238
- Equity at exit
- $38,737
- IRR
- -29.6%
- Equity multiple
- -0.16×
- Total profit
- $-84,049
- Equity at exit
- $22,463
Cash invested: $72,744 (down + closing). Projections, not guarantees.
Landlord ↔ Tenant lean methodology
- Overall (STATE)
- 87 Strongly Landlord-Friendly
- State Texas
- 87 Strongly Landlord-Friendly · R+5
- County
- — inherits STATE
- City
- — inherits STATE
ZIP-level market 77539
- Home prices YoY
- -29.8%
- Rents YoY
- -0.1%
- Active inventory
- 678
- Price-to-rent
- 9.5×
Monthly cashflow live
- Estimated rent
- $2,274 high interval (Pro) →
- Mortgage (P&I)
- −$1,362
- Tax est. 1.5%
- −$325 /mo · $3,897/yr
- Insurance
- −$108
- HOA
- −$120
- Vacancy / Maint / Mgmt
- −$478
- Net cashflow
- $-119
Break-even live
Sensitivity live
| Price | -10% $60 | -5% $-29 | +0% $-119 | +5% $-209 | +10% $-299 |
|---|---|---|---|---|---|
| Rent | -10% $-299 | -5% $-209 | +0% $-119 | +5% $-29 | +10% $61 |
| Rate | -1.0pp $12 | -0.5pp $-53 | base $-119 | +0.5pp $-186 | +1.0pp $-255 |
UW: 25.0% down · 7.5% · 30yr · 1.5% tax · 5.0% vac · 8.0% maint · 8.0% mgmt
Financing live
Cash to close
- Down payment
- $64,950
- Closing costs
- $7,794
- Reserves months
- —
- Total cash needed
- —
Loan-product check · same deal, 3 products live
Conventional
25% down · 7.5% · 30yr
- Down + closing
- —
- Monthly P&I
- —
- Monthly cashflow
- —
- DSCR
- —
- Eligible?
- —
Personal DTI + credit; lowest rate.
DSCR
20% down · 8.5% · 30yr
- Down + closing
- —
- Monthly P&I
- —
- Monthly cashflow
- —
- DSCR
- —
- Eligible?
- —
No personal income docs; deal must DSCR.
Hard money
10% down · 12.0% · 12mo
- Down + closing
- —
- Monthly P&I
- —
- Monthly cashflow
- —
- DSCR
- —
- Eligible?
- —
Short-term bridge; refi at stabilization.
Rent comps 8 comps
| Address | Beds | Baths | Sqft | Rent | $/sqft | DOM | Units | Dist |
|---|---|---|---|---|---|---|---|---|
| 12524 Jetty Cv Santa Fe, TX | 3.0 | 2.0 | 1803 | $2,506 | $1.39 | 24d | 1 | 0.16mi |
| 2437 Regatta Ln La Marque, TX | 4.0 | 2.0 | 1844 | $2,079 | $1.13 | 7d | 1 | 0.35mi |
| 640 Totem Trail Dr La Marque, TX | 4.0 | 2.5 | 2134 | $2,309 | $1.08 | 13d | 1 | 0.40mi |
| 2301 Starboard Sail Alta Loma, TX | 4.0 | 2.0 | 1856 | $2,181 | $1.18 | 13d | 1 | 0.42mi |
| 114 Mustang Stampede Dr La Marque, TX | 3.0 | 2.0 | 1752 | $2,050 | $1.17 | 3d | 1 | 0.51mi |
| 3301 Gulf Fwy La Marque, TX | 1.0–3.0 | 1.0–2.0 | 991 | $2,430 | $2.45 | 0d | 21 | 0.66mi |
| 3210 Gulf Fwy Texas City, TX | 1.0–2.0 | 1.0–2.0 | 872 | $1,780 | $2.04 | 0d | 12 | 0.88mi |
| 13817 Starboard Reach Dr Santa Fe, TX | 3.0–4.0 | 2.0–3.5 | 2268 | $2,445 | $1.08 | 0d | 1 | 1.47mi |
HOA detail
- Monthly dues
- $120 · $1,440/yr
- Likely covers
- waterpoolgymsecurity
Listing history 31 events
-
2026-06-21days on market $259,800 Active 268 DOM
-
2026-06-18days on market $259,800 Active 265 DOM
-
2026-06-17days on market $259,800 Active 264 DOM
-
2026-06-16days on market $259,800 Active 263 DOM
-
2026-06-15days on market $259,800 Active 262 DOM
-
2026-06-13days on market $259,800 Active 260 DOM
-
2026-06-09days on market $259,800 Active 256 DOM
-
2026-06-08days on market $259,800 Active 255 DOM
-
2026-06-07pricedays on market $259,800 Active 254 DOM
-
2026-06-04days on market $264,800 Active 251 DOM
-
2026-06-03days on market $264,800 Active 250 DOM
-
2026-06-02days on market $264,800 Active 249 DOM
-
2026-06-02days on market $264,800 Active 248 DOM
-
2026-05-31days on market $264,800 Active 247 DOM
-
2026-01-30price $264,800 1007-char remark
Show marketing remark (1007 chars)
MOTIVATED SELLER ***This home checks all the boxes***NO FLOOD(x-zone)--3BR, spacious Open Concept Chefs Kitchen & Living/Family Rm. Granite counters, center island breakfast bar+pantry. Soft close drawers/cabinets. High Ceilings & Primary BR features walk-in closet, double vanity, garden size soaker tub, separate shower. Full brick surrounds home with cement board soffit/fascia+under-eave lighting in front of home. Whole house LED lighting and 2" Wood Plantation Blinds. Mature trees and landscaped front yard w/manual sprinkler system. Amenities: 12-acre Crystal Lagoon, 2 resort-style pools, splash pad, trails, Dog park, Soccer fields, 1/2 B-Ball Crt, two fitness centers + a Club House AND they're adding a pickleball court! Also subdivision security is all part of the resort-style living in the Lago Mar planned community. Relax with Bay Area breezes as you enjoy the white-sand beaches, swim in crystal waters or dine lagoon side. Nationally recognized dining & shopping nearby.
-
2025-09-26$268,800 Active 1007-char remark
Show marketing remark (1007 chars)
MOTIVATED SELLER ***This home checks all the boxes***NO FLOOD(x-zone)--3BR, spacious Open Concept Chefs Kitchen & Living/Family Rm. Granite counters, center island breakfast bar+pantry. Soft close drawers/cabinets. High Ceilings & Primary BR features walk-in closet, double vanity, garden size soaker tub, separate shower. Full brick surrounds home with cement board soffit/fascia+under-eave lighting in front of home. Whole house LED lighting and 2" Wood Plantation Blinds. Mature trees and landscaped front yard w/manual sprinkler system. Amenities: 12-acre Crystal Lagoon, 2 resort-style pools, splash pad, trails, Dog park, Soccer fields, 1/2 B-Ball Crt, two fitness centers + a Club House AND they're adding a pickleball court! Also subdivision security is all part of the resort-style living in the Lago Mar planned community. Relax with Bay Area breezes as you enjoy the white-sand beaches, swim in crystal waters or dine lagoon side. Nationally recognized dining & shopping nearby.
-
2025-08-31historical
-
2025-07-15$275,000 Active
-
2025-07-15historical
-
2025-05-01price $275,000
-
2025-03-21$279,900 Active
-
2025-02-08historical
-
2024-11-11$280,000 Active
-
2023-07-31historical
-
2023-06-01price $270,000
-
2023-05-13price $280,000
-
2023-05-01status Active
-
2023-04-30historical
-
2023-03-29price $290,800
-
2023-02-24price $294,900
-
2022-11-25$299,900 Active
ⓘ Source: listings_history table (triggers on properties + properties_extension) + one-shot
backfill from property_details.listing_events for pre-trigger history.
Climate risk First Street
- Flood 5/10 Major FEMA zone X (unshaded) · 66% chance over 30 yrs
- Wildfire 4/10 Moderate
- Heat 10/10 Extreme 7 d/yr ≥111°F today · 27 d/yr by 30 yrs out
- Wind 9/10 Extreme 99% chance of damaging wind over 30 yrs
- Air quality 3/10 Moderate 2 unhealthy d/yr today · 2 by 30 yrs out
Nearby sold comps map
Loading sold comps map…
Walkable amenities ~0.75 mi
Loading nearby amenities…
Taxation est. · year 1
- Rental income
- $27,286
- − Mortgage interest
- −$14,553
- − Property taxes
- −$3,897
- − Insurance
- −$1,299
- − Repairs & maintenance
- −$2,183
- − Management
- −$2,183
- − HOA
- −$1,440
- − Depreciation
- −$7,558
- Taxable loss
- −$5,826
- Est. tax savings @ 24.0%
- +$1,398
- After-tax cash flow
- $-30/yr
For passive investors: Depreciation is non-cash, so a rental often shows a tax loss while cash-flowing — sheltering income. Rental losses are passive: they offset passive income freely, and up to $25,000/yr can offset ordinary (W-2) income if you actively participate and your MAGI is under $100k (phasing out to $0 by $150k); unused losses carry forward. On sale, claimed depreciation is recaptured at up to 25%, and gains may owe capital-gains tax (a 1031 exchange can defer both). Figures are a year-1 estimate at your 24.0% rate — not tax advice; consult a CPA.
Condition & rehab AI · 12 photos
This home is in good condition with a good condition score of 75. It has a good kitchen, bathrooms, and exterior. The property is located in a desirable neighborhood with amenities such as a 12-acre Crystal Lagoon and two resort-style pools. The home is move-in ready and has a good ROI potential.
Value-add opportunities
- Both Landscaping improvements — Enhances curb appeal and property value
- Both Add smart home features — Improves convenience and marketability
- Both Install smart thermostat — Saves energy and attracts buyers
Renovation cost estimate screening
Value-add ROI direction
- Both Landscaping improvements — Enhances curb appeal and property value ↑
- Both Add smart home features — Improves convenience and marketability ↑
- Both Install smart thermostat — Saves energy and attracts buyers ↑
ⓘ Cost ranges are severity-bucket heuristics (US national rule-of-thumb). Get contractor quotes + a written scope before underwriting a rehab budget.
Schools (NCES district)
- District
- Dickinson ISD
- NCES district ID
- 4817070
- Math proficiency
- 39% ▼ -11.00%
- Reading proficiency
- 40% ▼ -2.00%
- Median HH income
- $61,318
- Composite
- 35.16/100
- National rank
- #5005
- State rank
- #366 of 826 in TX
Livability — Texas City
- Score
- 62/100
- State rank
- #907
- US rank
- #16268
Category grades
Schools grade is shown separately in the Schools card above.
Census & demographics
- Census place
- Texas City, TX
- County
- Galveston County · 357,330 people
- City population
- 49,936
- Metro
- Houston-The Woodlands-Sugar Land, TX
- Population (ZIP)
- 49,375
- Household income
- $89,111
- Rent vs Own
- Severe rent burden
- 869.0
Population outlook (Galveston County) Hauer SSP2
- Today (2025)
- 390,640 people
- By 2030
- 425,226 · +8.9%
- By 2040
- 493,765 · +26.4%
- By 2050
- 559,698 · +43.3%
- By 2075
- 719,260 · +84.1%
- By 2100
- 819,628 · +109.8%
Race, ethnicity, and origin ACS 2023
- Neighborhood character
- Diverse neighborhood (Simpson 0.64)
- Race & ethnicity
- White 47% Hispanic / Latino 37% Two or more races 19% Black 10% Asian 3%
- Hispanic origin (detail)
- Mexican 29% Puerto Rican 2%
- Common ancestry
- Italian 3% Romanian 2% Lithuanian 1%
- Foreign-born
- 13% · Canada, Vietnam
- Languages at home
- 73% English-only · Spanish 24% Vietnamese 1% Other Indo-European 1%
Political lean MEDSL · Galveston
- 2024 margin
- Strong R (+27.4) · D 35.7% · R 63.1% · Other 1.2%
- 2008→2024 swing
- -7.9pp toward R · 2008: -19.5pp · 2024: -27.4pp
- All cycles
- 2024: R+27.4 2020: R+22.6 2016: R+22.6 2012: R+26.9 2008: R+19.5
Not yet ingested
- Civics
- —
Market trends
- HPI YoY
- ▼ -109.46%
- Current HPI
- 258.0104
- Rent YoY
- ▼ -0.12%
- Metro
- Houston-The Woodlands-Sugar Land, TX
- State GDP YoY
- ▲ 3.95%
- F500 in state
- 110
Industry mix (Fortune 500 HQ in TX)
| Industry | F500 HQs | Revenue |
|---|---|---|
| Energy | 16 | $1,198B |
|
||
| Technology | 5 | $198B |
|
||
| Engineering / Construction | 4 | $72B |
|
||
| Energy Services | 3 | $60B |
|
||
| Utilities | 3 | $41B |
|
||
| Healthcare | 2 | $330B |
|
||
Price history
-11.7% since first listed17 events — show timeline
- 2026-01-30 Price Changed $264,800 HARMLS
- 2025-09-26 Listed $268,800 HARMLS
- 2025-08-31 Listing Removed — HARMLS
- 2025-07-15 Listing Removed — HARMLS
- 2025-07-15 Listed $275,000 HARMLS
- 2025-05-01 Price Changed $275,000 HARMLS
- 2025-03-21 Listed $279,900 HARMLS
- 2025-02-08 Listing Removed — HARMLS
- 2024-11-11 Listed $280,000 HARMLS
- 2023-07-31 Listing Removed — HARMLS
- 2023-06-01 Price Changed $270,000 HARMLS
- 2023-05-13 Price Changed $280,000 HARMLS
- 2023-05-01 Relisted — HARMLS
- 2023-04-30 Listing Removed — HARMLS
- 2023-03-29 Price Changed $290,800 HARMLS
- 2023-02-24 Price Changed $294,900 HARMLS
- 2022-11-25 Listed $299,900 HARMLS
Cash-flow waterfall
monthlySold comps — $/sqft
last 12 mo · ≤1 miLoading sold comps…