2689 S Village Green Ln S · Macon-Bibb County, GA
Flood risk 1/10 · Minimal
- FEMA flood zone
- X (unshaded)
- Chance of flooding over 30 yrs
- 0.0%
- Est. flood insurance / yr
- $507 – $1,088
Fire risk 2/10 · Minimal
- Est. fire insurance / yr
- $963 – $1,789
Heat risk 7/10 · Major
- Hot days now (above 109°F)
- 7 days/yr
- Hot days in 30 yrs
- 18 days/yr
Wind risk 6/10 · Moderate
- Chance of severe wind over 30 yrs
- 66.0%
Air-quality risk 3/10 · Minor
- Unhealthy air days now
- 3 days/yr
- Unhealthy air days in 30 yrs
- 4 days/yr
Risk factors via First Street. Map © Google.
Why this score? — see what drove the C+ grade
The composite is a weighted blend of 9 inputs, each scored 0–100. Each bar is that input's sub-score; the figure is the points it added to the 100-point composite (weight × sub-score).
- Cash flow +26.5/30.0
- DSCR +9.1/10.0
- ARV discount +7.5/15.0
- 1% rule +7.1/10.0
- Rent growth +3.8/5.0
- Livability +2.5/5.0
- Condition / age +2.5/5.0
- Schools +1.2/10.0
- Appreciation +0.0/10.0
$100,000
🖨 Deal sheet (PDF) 📄 Offer letter ✓ Due diligence
Listing remarks
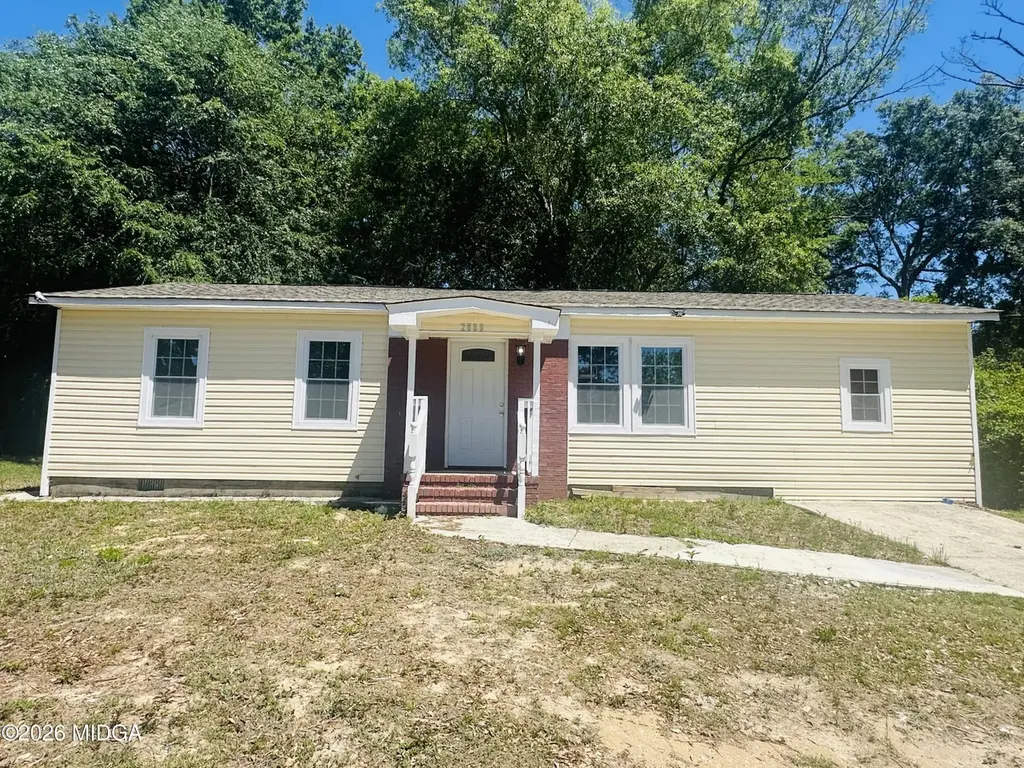
Excellent home for a first time home buyer or for investment. It features three bedrooms and one and a half baths, plus bonus room. Spacious kitchen and laundry. The garage was converted into a bonus room, adding 250 sq ft. The front and back porches were modified. AC is 10 years old and the roof is new, plus new windows, doors, floors and a half bath. .
Key facts
- 8,276 sq ft lot
- Built 1970
- Listed 46 days
Property features AI
Finance
- HOA & community: Street lights in the community
Exterior
- Parking: Driveway; Parking pad
- Utilities: Public water; Public sewer; Water service available
- Home design: Single-family residence; One level
- Construction: Vinyl siding; Block foundation; Shingle roof; Built as a residential single-family home
- Exterior features: Front porch; Fenced yard; No additional exterior structures
Interior
- Kitchen: Electric range; Microwave; Refrigerator
- Bedrooms: Total of 3 rooms (bedrooms and living areas included)
- Flooring: Hardwood flooring throughout
- Bathrooms: 1 full bathroom and 1 half bathroom
- Heating & cooling: Central electric cooling; Electric heat pump heating
- Interior features: Electric range, microwave, and refrigerator included; Hardwood floors; No fireplace
- Laundry & utility: Main-level laundry located in the kitchen; No basement
Neighborhood map
What this means for you Summary
Snapshot
- This is a 3-bed/1.5-bath single-family listed at $100k.
Deal economics
- At list price, monthly cash flow is $266 ($3k/yr) — positive.
- The deal already cash-flows at list — no discount required.
- Meets the 1% rule at list price ($1k rent vs $100k).
- Recommended offer: $97k (3.0% below list) — sets the bar for market timing.
- Cap rate 9.5% vs local median 5.4% in Macon-Bibb County — top-decile yield for the area; either an underpriced asset or a hidden risk that comps aren't pricing in. Stress-test before assuming the spread holds.
Location & tenants
- Location reads: area grade C — affects rentability + tenant quality, not the cash-flow math above.
- Bibb County (urban): math 11% / reading 18% proficiency, ranked #161 of 174 in GA (top 92%) — low school quality limits family demand, transient renter base, plan for 1-2y turnover; 75% free/reduced lunch — lower-income household profile, screen leases tightly.
- Market conditions: Rents rising fast (+5.0%/yr); 209 active listings in the ZIP; 16 comparable units currently listed for rent nearby; rentals lingering (median 45d on market — plan ~5-8 weeks vacancy on turnover, expect pricing pressure); 69% of comp listings sitting > 30 days — soft ceiling on asking rent; lower-income renter base — watch delinquency; 154 units permitted in Bibb County in 2024 (0 in 5+ unit buildings).
- At $1,212/mo this rent would consume 48% of the median local household income ($30k/yr) (locally 1335% of renters already pay >50% of income on rent) — very limited rent-growth headroom before tenants either downsize or default.
Forward outlook
- Local home prices are declining (-3.0%/yr); year-one equity from $691 of loan paydown is wiped out by about $3k of value loss. Plan a longer hold.
- Bibb County population projected at -12% by 2050 — secular population decline; favor cash flow + early exit over multi-decade hold.
- At projected returns (-3.0% appreciation + 5.0% rent growth), your $28k cash investment doubles in ~9 years — after that, you're playing with house money.
Negotiation context
- It's been on market 46 days — a 3% lower offer ($97k) is reasonable based on typical stale-listing flexibility.
- 2 sale attempts; this cycle's ask has dropped $25k (20%) from the opening price — seller is motivated, your offer sets the floor, not the list.
- Current owner paid $35k; list at $100k implies a 186% gain — meaningful room to come down on a strong offer.
Risks & watch-outs
- Climate carrying-cost: major wind risk, 66% chance of damaging wind over 30y; extreme-heat days projected 7→18/yr by 2055 (HVAC capex compounding) — expect insurance premiums to compound above CPI over the hold.
Questions for the listing agent
- It's been on market 46 days. Have you received any prior offers? Is the seller open to a 3% concession, seller financing, or rate buy-down credit?
- Built in 1970 — when were the roof, HVAC, electrical panel, plumbing, and water heater last replaced?
- Is there a deadline driving the sale (1031 exchange, divorce, estate, relocation)? That informs how much negotiation room exists.
- What's the average days-on-market for RENTAL listings here right now (not sales)? A rising rental-DOM trend means longer vacancies and softer asking-rent achievability than the comps imply.
- What's the recent tenant-quality profile in this submarket — average credit score on applications, eviction rate, late-payment / NSF rate, and stable-employment percentage? A property-management company in the area should have these aggregated.
- How much new for-sale + rental construction is in the pipeline within 1–3 miles? Heavy new supply typically softens prices + rents 12–24 months out; constrained supply supports both.
Investment metrics
- 1% rule
- 1.21% ✓
- Cap rate
- 9.48%
- Cash-on-cash
- 11.40%
- DSCR
- 1.51
- GRM
- 6.9
CMA / ARV
- ARV (median comp)
- $61,963
- List price
- $100,000
- Delta
- 61.39%
- Verdict
- OVERPRICED
- Comps
- 20 within 1.0 mi
Show comp detail 12 sales within ~0.75 mi
| Address | Dist | Beds/Ba | Sqft | Sold | Price | $/sf | Match |
|---|---|---|---|---|---|---|---|
| 5771 Satterfield Dr | 0.17mi | 3/1.0 | 888 (-1%) | 5mo | $65,000 | $73 | 84 |
| 5909 W Leone Dr | 0.27mi | 3/1.0 | 900 (0%) | 4mo | $27,500 | $31 | 82 |
| 4524 Dorset Dr | 0.26mi | 3/1.0 | 864 (-4%) | 1mo | $58,000 | $67 | 79 |
| 5746 Sterling Pl | 0.24mi | 3/1.0 | 864 (-4%) | 5mo | $20,000 | $23 | 76 |
| 5711 Sterling Pl | 0.30mi | 3/2.0 | 864 (-4%) | 2mo | $120,000 | $139 | 76 |
| 5756 Satterfield Dr | 0.20mi | 3/1.0 | 828 (-8%) | 3mo | $25,000 | $30 | 73 |
| 5770 Satterfield Dr | 0.18mi | 2/1.0 (-1) | 828 (-8%) | 5mo | $75,000 | $91 | 67 |
| 5756 Edwina Dr | 0.22mi | 3/1.5 | 1,000 (+11%) | 5mo | $132,000 | $132 | 67 |
| 2844 Shamrock Ln | 0.24mi | 3/1.0 | 1,000 (+11%) | 2mo | $47,000 | $47 | 66 |
| 5885 Leone Dr W | 0.29mi | 3/1.0 | 1,000 (+11%) | 4mo | $35,000 | $35 | 63 |
| 2642 Reynolds Dr | 0.36mi | 3/1.5 | 986 (+10%) | 9mo | $130,000 | $132 | 60 |
| 2431 Rosen Ave | 0.61mi | 3/1.0 | 810 (-10%) | 0mo | $73,000 | $90 | 53 |
Match score weights: distance 35% · size 25% · config 20% · recency 20%. Top-matched comps best support the ARV.
Projected returns pro-forma
-3.0% appreciation · 5.03% rent growth · sell at horizon
- IRR
- 3.0%
- Equity multiple
- 1.12×
- Total profit
- $3,279
- Equity at exit
- $14,910
- IRR
- 14.4%
- Equity multiple
- 2.27×
- Total profit
- $35,543
- Equity at exit
- $8,646
Cash invested: $28,000 (down + closing). Projections, not guarantees.
Landlord ↔ Tenant lean methodology
- Overall (STATE)
- 90 Strongly Landlord-Friendly
- State Georgia
- 90 Strongly Landlord-Friendly · R+3
- County
- — inherits STATE
- City
- — inherits STATE
ZIP-level market 31206
- Rents YoY
- 5.0%
- Active inventory
- 209
- Price-to-rent
- 6.9×
Monthly cashflow live
- Estimated rent
- $1,212 high interval (Pro) →
- Mortgage (P&I)
- −$524
- Tax from tax record
- −$125 /mo · $1,503/yr
- Insurance
- −$42
- HOA
- −$0
- Vacancy / Maint / Mgmt
- −$254
- Net cashflow
- $266
Break-even live
Sensitivity live
| Price | -10% $323 | -5% $294 | +0% $266 | +5% $238 | +10% $209 |
|---|---|---|---|---|---|
| Rent | -10% $170 | -5% $218 | +0% $266 | +5% $314 | +10% $362 |
| Rate | -1.0pp $316 | -0.5pp $291 | base $266 | +0.5pp $240 | +1.0pp $214 |
UW: 25.0% down · 7.5% · 30yr · 1.5% tax · 5.0% vac · 8.0% maint · 8.0% mgmt
Financing live
Cash to close
- Down payment
- $25,000
- Closing costs
- $3,000
- Reserves months
- —
- Total cash needed
- —
Loan-product check · same deal, 3 products live
Conventional
25% down · 7.5% · 30yr
- Down + closing
- —
- Monthly P&I
- —
- Monthly cashflow
- —
- DSCR
- —
- Eligible?
- —
Personal DTI + credit; lowest rate.
DSCR
20% down · 8.5% · 30yr
- Down + closing
- —
- Monthly P&I
- —
- Monthly cashflow
- —
- DSCR
- —
- Eligible?
- —
No personal income docs; deal must DSCR.
Hard money
10% down · 12.0% · 12mo
- Down + closing
- —
- Monthly P&I
- —
- Monthly cashflow
- —
- DSCR
- —
- Eligible?
- —
Short-term bridge; refi at stabilization.
Rent comps 16 comps
| Address | Beds | Baths | Sqft | Rent | $/sqft | DOM | Units | Dist |
|---|---|---|---|---|---|---|---|---|
| 2665 Chatsworth Ct Macon, GA | 3.0 | 1.5 | 1056 | $1,175 | $1.11 | 44d | 1 | 0.07mi |
| 2641 Leone Dr N Macon, GA | 3.0 | 1.0 | 864 | $1,100 | $1.27 | 44d | 1 | 0.13mi |
| 5771 Satterfield Dr Macon, GA | 3.0 | 1.0 | 888 | $1,250 | $1.41 | 44d | 1 | 0.18mi |
| 4386 Thrasher Cir Macon, GA | 3.0 | 2.0 | 1120 | $1,400 | $1.25 | 44d | 1 | 0.26mi |
| 5711 Sterling Pl Macon, GA | 3.0 | 1.0 | 864 | $1,500 | $1.74 | 22d | 1 | 0.31mi |
| 5708 Edwina Dr Macon, GA | 3.0 | 1.0 | 925 | $1,275 | $1.38 | 44d | 1 | 0.32mi |
| 4331 Ashland Dr Macon, GA | 3.0 | 1.0 | 864 | $1,025 | $1.19 | 44d | 1 | 0.40mi |
| 2961 Deeb Dr Macon, GA | 3.0 | 1.0 | 1000 | $1,000 | $1.00 | 44d | 1 | 0.50mi |
| 2477 Thrasher Ave Macon, GA | 3.0 | 1.0 | 960 | $825 | $0.86 | 14d | 1 | 0.51mi |
| 5487 Bloomfield Rd Macon, GA | 3.0 | 2.0 | 1050 | $1,200 | $1.14 | 22d | 1 | 0.62mi |
| 2459 Vivian Dr Macon, GA | 3.0 | 1.0 | 792 | $850 | $1.07 | 14d | 1 | 0.62mi |
| 2423 Thrasher Ave Macon, GA | 3.0 | 1.0 | 1056 | $725 | $0.69 | 44d | 1 | 0.63mi |
| 2427 Vivian Dr Macon, GA | 4.0 | 1.0 | 1056 | $1,150 | $1.09 | 44d | 1 | 0.69mi |
| 4278 Vinson Ave Macon, GA | 4.0 | 2.0 | 1104 | $1,550 | $1.40 | 22d | 1 | 0.70mi |
| 4069 Blair Ct Macon, GA | 3.0 | 1.0 | 864 | $850 | $0.98 | 44d | 1 | 1.16mi |
| 5161 Nisbet Dr Macon, GA | 2.0 | 1.5 | 1040 | $975 | $0.94 | 44d | 1 | 1.23mi |
Listing history 26 events
-
2026-06-21days on market $100,000 Active 46 DOM
-
2026-06-19days on market $100,000 Active 44 DOM
-
2026-06-18days on market $100,000 Active 43 DOM
-
2026-06-17price $100,000 Active 42 DOM
-
2026-06-17days on market $110,000 Active 42 DOM
-
2026-06-16days on market $110,000 Active 41 DOM
-
2026-06-15days on market $110,000 Active 40 DOM
-
2026-06-14days on market $110,000 Active 38 DOM
-
2026-06-13days on market $110,000 Active 37 DOM
-
2026-06-10days on market $110,000 Active 35 DOM
-
2026-06-09days on market $110,000 Active 34 DOM
-
2026-06-09days on market $110,000 Active 33 DOM
-
2026-06-07days on market $110,000 Active 32 DOM
-
2026-06-03days on market $110,000 Active 28 DOM
-
2026-06-02days on market $110,000 Active 27 DOM
-
2026-06-01days on market $110,000 Active 26 DOM
-
2026-05-31days on market $110,000 Active 25 DOM
-
2026-05-30days on market $110,000 Active 24 DOM
-
2026-05-06$125,000 Active 356-char remark
-
2026-05-01historical
-
2026-03-30price $125,000
-
2026-03-30price $125,000
-
2025-10-31$130,000 New
-
2006-02-15soldstatus $35,000
-
2005-10-04soldstatus $24,500
-
2004-07-30soldstatus $60,000
ⓘ Source: listings_history table (triggers on properties + properties_extension) + one-shot
backfill from property_details.listing_events for pre-trigger history.
Tax reassessment forecast GA · Resets to sale price
- Current annual tax
- $1,503 · $125/mo
- Projected year-2 tax
- $1,503 · $125/mo
- Expected delta
- $0/yr ($0/mo · 0.0%)
ⓘ Screening estimate from a state-policy table — verify with the county assessor before closing.
Climate risk First Street
- Flood 1/10 Low FEMA zone X (unshaded) · 0% chance over 30 yrs
- Wildfire 2/10 Low
- Heat 7/10 Severe 7 d/yr ≥109°F today · 18 d/yr by 30 yrs out
- Wind 6/10 Major 66% chance of damaging wind over 30 yrs
- Air quality 3/10 Moderate 3 unhealthy d/yr today · 4 by 30 yrs out
Nearby sold comps map
Loading sold comps map…
Walkable amenities ~0.75 mi
Loading nearby amenities…
Taxation est. · year 1
- Rental income
- $14,541
- − Mortgage interest
- −$5,602
- − Property taxes
- −$1,503
- − Insurance
- −$500
- − Repairs & maintenance
- −$1,163
- − Management
- −$1,163
- − Depreciation
- −$2,909
- Taxable income
- $1,701
- Est. tax owed @ 24.0%
- −$408
- After-tax cash flow
- $2,783/yr
For passive investors: Depreciation is non-cash, so a rental often shows a tax loss while cash-flowing — sheltering income. Rental losses are passive: they offset passive income freely, and up to $25,000/yr can offset ordinary (W-2) income if you actively participate and your MAGI is under $100k (phasing out to $0 by $150k); unused losses carry forward. On sale, claimed depreciation is recaptured at up to 25%, and gains may owe capital-gains tax (a 1031 exchange can defer both). Figures are a year-1 estimate at your 24.0% rate — not tax advice; consult a CPA.
Schools (NCES district)
- District
- Bibb County
- NCES district ID
- 1300420
- Math proficiency
- 11% ▼ -14.00%
- Reading proficiency
- 18% ▼ -11.00%
- Median HH income
- $37,426
- Composite
- 12.13/100
- National rank
- #9654
- State rank
- #161 of 174 in GA
Livability — Macon-Bibb County
No livability data for this city. (Only ~50 U.S. cities are tracked.)
Census & demographics
- Census place
- Macon-Bibb County, GA
- County
- Bibb County · 164,332 people
- City population
- 143,186
- Metro
- Macon-Bibb County, GA
- Population (ZIP)
- 24,310
- Household income
- $30,042
- Rent vs Own
- Severe rent burden
- 1335.0
Population outlook (Bibb County) Hauer SSP2
- Today (2025)
- 148,772 people
- By 2030
- 145,904 · -1.9%
- By 2040
- 139,404 · -6.3%
- By 2050
- 131,603 · -11.5%
- By 2075
- 111,050 · -25.4%
- By 2100
- 83,346 · -44.0%
Race, ethnicity, and origin ACS 2023
- Neighborhood character
- Predominantly Black (76%)
- Race & ethnicity
- Black 76% White 12% Hispanic / Latino 8% Two or more races 4%
- Hispanic origin (detail)
- Mexican 5% Puerto Rican 1%
- Common ancestry
- Lithuanian 1% Italian 1%
- Foreign-born
- 4% · Canada
- Languages at home
- 91% English-only · Spanish 8%
Political lean MEDSL · Bibb
- 2024 margin
- Strong D (+22.4) · D 61.0% · R 38.5%
- 2008→2024 swing
- +4.4pp toward D · 2008: 18.0pp · 2024: 22.4pp
- All cycles
- 2024: D+22.4 2020: D+23.8 2016: D+20.2 2012: D+20.0 2008: D+18.0
Not yet ingested
- Civics
- —
Market trends
- HPI YoY
- ▼ -80.17%
- Current HPI
- 148.6765
- Rent YoY
- ▲ 5.03%
- Metro
- Macon-Bibb County, GA
- State GDP YoY
- ▲ 2.66%
- F500 in state
- 28
Industry mix (Fortune 500 HQ in GA)
| Industry | F500 HQs | Revenue |
|---|---|---|
| Paper / Packaging | 2 | $29B |
|
||
| Retail | 1 | $160B |
|
||
| Transportation / Logistics | 1 | $91B |
|
||
| Airlines | 1 | $62B |
|
||
| Consumer Goods | 1 | $47B |
|
||
| Utilities | 1 | $25B |
|
||
Price history
+66.7% since first listed10 events — show timeline
- 2026-06-17 Price Changed $100,000 MGMLS
- 2026-05-24 Price Changed $110,000 MGMLS
- 2026-05-06 Listed $125,000 MGMLS
- 2026-05-01 Listing Removed — GAMLS
- 2026-03-30 Price Changed $125,000 GAMLS
- 2026-03-30 Price Changed $125,000 MGMLS
- 2025-10-31 Listed $130,000 GAMLS
- 2006-02-15 Sold (Public Records) $35,000 Public Records
- 2005-10-04 Sold (Public Records) $24,500 Public Records
- 2004-07-30 Sold (Public Records) $60,000 Public Records
Property tax history
+25.0%/yrLatest (2025): $1,503 · -8.1% YoY. Source: county tax records.
Cash-flow waterfall
monthlySold comps — $/sqft
last 12 mo · ≤1 miLoading sold comps…