 🏷️ Likely Rental
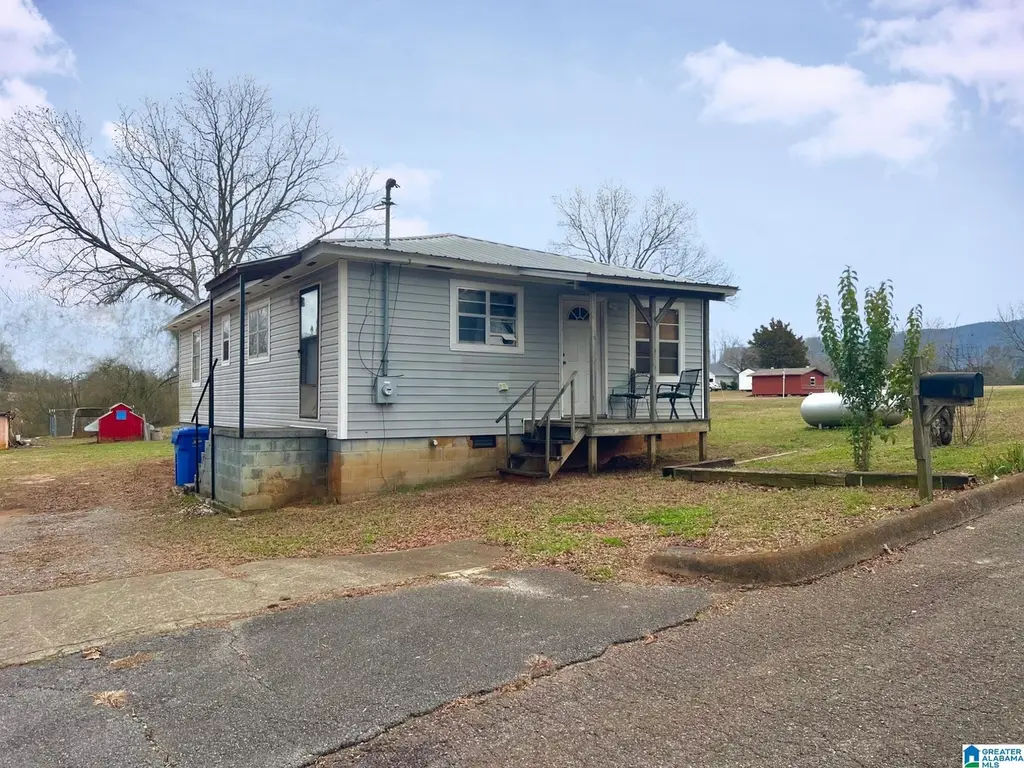
408 Woolf Ave · Piedmont, AL
Flood risk 1/10 · Minimal
- FEMA flood zone
- X (unshaded)
- Chance of flooding over 30 yrs
- 0.0%
- Est. flood insurance / yr
- $507 – $1,088
Fire risk 5/10 · Moderate
- Est. fire insurance / yr
- $916 – $1,700
Heat risk 6/10 · Moderate
- Hot days now (above 105°F)
- 7 days/yr
- Hot days in 30 yrs
- 19 days/yr
Wind risk 6/10 · Moderate
- Chance of severe wind over 30 yrs
- 27.0%
Air-quality risk 2/10 · Minimal
- Unhealthy air days now
- 1 days/yr
- Unhealthy air days in 30 yrs
- 2 days/yr
Risk factors via First Street. Map © Google.
Why this score? — see what drove the B- grade
The composite is a weighted blend of 9 inputs, each scored 0–100. Each bar is that input's sub-score; the figure is the points it added to the 100-point composite (weight × sub-score).
- Cash flow +30.0/30.0
- 1% rule +10.0/10.0
- DSCR +10.0/10.0
- ARV discount +7.5/15.0
- Schools +4.0/10.0
- Livability +2.9/5.0
- Rent growth +2.5/5.0
- Condition / age +2.5/5.0
- Appreciation +0.0/10.0
$40,000
🖨 Deal sheet 📄 Offer letter ✓ Due diligence
Listing remarks
This property is packed with potential! Located just two blocks from the Chief Ladiga Trail, this charming bungalow offers a great opportunity for investors, first-time buyers, or those looking to downsize. Currently tenant occupied, it already provides immediate income potential from day one. With its convenient location and growing interest in outdoor recreation in the area, this property could also make an excellent short-term rental or weekend getaway. Guests would love the quick access to the Chief Ladiga Trail, plus being only minutes from Terrapin Creek Outfitters and nearby ATV parks. Whether you’re searching for an investment property, an affordable path into homeownership, o
Key facts
- Weekend getaway
- Short-term rental
- 7,840 sq ft lot
Tags
Property features AI
Exterior
- Parking: Driveway parking
- Utilities: Public water; Sewer connected; Internet service availability
- Home design: Existing single-family style property
- Construction: Vinyl siding; Crawl space foundation
- Exterior features: No pool, patio, decks, or garden listed; Not waterfront; Property on approximately 0.18 acres
Interior
- Kitchen: Laminate countertops
- Bedrooms: Three bedrooms on the main level
- Flooring: Carpet and vinyl flooring
- Bathrooms: One full bathroom with tub/shower combo
- Heating & cooling: Gas heating; No air conditioning
- Interior features: Ceilings described as other (see remarks); No special interior features listed
- Laundry & utility: Main-level laundry in a closet; Washer hookup and electric dryer hookup; Electric water heater
Neighborhood map
What this means for you Summary
Snapshot
- This is a 3-bed/1.0-bath single-family listed at $40k.
Deal economics
- At list price, monthly cash flow is $509 ($6k/yr) — positive.
- The deal already cash-flows at list — no discount required.
- Meets the 1% rule at list price ($956 rent vs $40k).
- Recommended offer: $39k (3.0% below list) — sets the bar for market timing.
- Cap rate 21.6% vs local median 4.5% in Piedmont — top-decile yield for the area; either an underpriced asset or a hidden risk that comps aren't pricing in. Stress-test before assuming the spread holds.
Location & tenants
- Location reads 57/100 on livability (#402 in AL) — a working-class tenant base; expect higher turnover. Strengths: cost of living A+, housing A+; Watch: crime F, amenities F, commute F.
- Piedmont City (town): math 40% / reading 57% proficiency, ranked #14 of 129 in AL (top 11%) — families likely to look elsewhere, expect single-tenant / working-renter base with shorter leases.
- Zoned schools: Piedmont Elementary School (math 50% / reading 66%, grade C+, #72 of 627 statewide, top 12%, 534 students, 64% FRL); Piedmont High School (math 22% / reading 32%, grade F, #90 of 305 statewide, top 35%, 342 students, 62% FRL).
- Market conditions: 88 active listings in the ZIP; 135 units permitted in Calhoun County in 2024 (0 in 5+ unit buildings).
Forward outlook
- Local home prices are declining (-3.0%/yr); year-one equity from $277 of loan paydown is wiped out by about $1k of value loss. Plan a longer hold.
- Calhoun County population projected at -21% by 2050 — secular population decline; favor cash flow + early exit over multi-decade hold.
- At projected returns (-3.0% appreciation + 3.0% rent growth), your $11k cash investment doubles in ~3 years — after that, you're playing with house money.
Negotiation context
- It's been on market 42 days — a 3% lower offer ($39k) is reasonable based on typical stale-listing flexibility.
Risks & watch-outs
- Climate carrying-cost: major wind risk, 27% chance of damaging wind over 30y; moderate wildfire risk; extreme-heat days projected 7→19/yr by 2055 (HVAC capex compounding) — expect insurance premiums to compound above CPI over the hold.
Questions for the listing agent
- It's been on market 42 days. Have you received any prior offers? Is the seller open to a 3% concession, seller financing, or rate buy-down credit?
- Built in 1966 — when were the roof, HVAC, electrical panel, plumbing, and water heater last replaced?
- Is there a deadline driving the sale (1031 exchange, divorce, estate, relocation)? That informs how much negotiation room exists.
- Crime grade is F in this area — have there been break-ins, vandalism, or insurance claims at this property in the last 3 years? What carrier currently insures it and at what premium?
- What's the average days-on-market for RENTAL listings here right now (not sales)? A rising rental-DOM trend means longer vacancies and softer asking-rent achievability than the comps imply.
- What's the recent tenant-quality profile in this submarket — average credit score on applications, eviction rate, late-payment / NSF rate, and stable-employment percentage? A property-management company in the area should have these aggregated.
- How much new for-sale + rental construction is in the pipeline within 1–3 miles? Heavy new supply typically softens prices + rents 12–24 months out; constrained supply supports both.
Investment metrics
- 1% rule
- 2.39% ✓
- Cap rate
- 21.56%
- Cash-on-cash
- 54.52%
- DSCR
- 3.43
- GRM
- 3.5
CMA / ARV
- ARV (median comp)
- $97,935
- List price
- $40,000
- Delta
- -59.16%
- Verdict
- UNDERPRICED
- Comps
- 20 within 1.0 mi
Show comp detail 8 sales within ~0.75 mi
| Address | Dist | Beds/Ba | Sqft | Sold | Price | $/sf | Match |
|---|---|---|---|---|---|---|---|
| 605 Logan St | 0.15mi | 2/1.0 (-1) | 952 (-6%) | 12mo | $60,000 | $63 | 69 |
| 121 Taylor St | 0.63mi | 2/1.0 (-1) | 1,024 (+2%) | 1mo | $108,500 | $106 | 62 |
| 602 E Ladiga St | 0.38mi | 2/1.0 (-1) | 1,088 (+8%) | 5mo | $40,000 | $37 | 60 |
| 303 Southern Ave | 0.55mi | 2/1.0 (-1) | 994 (-1%) | 12mo | $105,000 | $106 | 57 |
| 430 Dink Moore Dr | 0.35mi | 3/1.0 | 1,120 (+11%) | 12mo | $132,500 | $118 | 55 |
| 119 S Church St | 0.55mi | 2/1.0 (-1) | 892 (-12%) | 2mo | $97,500 | $109 | 49 |
| 120 Old Ladiga Rd | 0.60mi | 2/1.0 (-1) | 1,052 (+4%) | 15mo | $45,000 | $43 | 47 |
| 411 Cedartown Hwy | 0.68mi | 2/1.0 (-1) | 1,085 (+8%) | 14mo | $87,500 | $81 | 39 |
Match score weights: distance 35% · size 25% · config 20% · recency 20%. Top-matched comps best support the ARV.
Projected returns pro-forma
-3.0% appreciation · 3.0% rent growth · sell at horizon
- IRR
- 52.7%
- Equity multiple
- 3.31×
- Total profit
- $25,921
- Equity at exit
- $5,964
- IRR
- 57.9%
- Equity multiple
- 6.74×
- Total profit
- $64,284
- Equity at exit
- $3,458
Cash invested: $11,200 (down + closing). Projections, not guarantees.
Landlord ↔ Tenant lean methodology
- Overall (STATE)
- 90 Strongly Landlord-Friendly
- State Alabama
- 90 Strongly Landlord-Friendly · R+15
- County
- — inherits STATE
- City
- — inherits STATE
ZIP-level market 36272
- Home prices YoY
- -10.2%
- Active inventory
- 88
- Price-to-rent
- 3.5×
Monthly cashflow live
- Estimated rent
- $956 medium interval (Pro) →
- Mortgage (P&I)
- −$210
- Tax from tax record
- −$20 /mo · $244/yr
- Insurance
- −$17
- HOA
- −$0
- Vacancy / Maint / Mgmt
- −$201
- Net cashflow
- $509
Break-even live
UW: 25.0% down · 7.5% · 30yr · 1.5% tax · 5.0% vac · 8.0% maint · 8.0% mgmt
Financing live
Cash to close
- Down payment
- $10,000
- Closing costs
- $1,200
- Reserves months
- —
- Total cash needed
- —
Loan-product check · same deal, 3 products live
Conventional
25% down · 7.5% · 30yr
- Down + closing
- —
- Monthly P&I
- —
- Monthly cashflow
- —
- DSCR
- —
- Eligible?
- —
Personal DTI + credit; lowest rate.
DSCR
20% down · 8.5% · 30yr
- Down + closing
- —
- Monthly P&I
- —
- Monthly cashflow
- —
- DSCR
- —
- Eligible?
- —
No personal income docs; deal must DSCR.
Hard money
10% down · 12.0% · 12mo
- Down + closing
- —
- Monthly P&I
- —
- Monthly cashflow
- —
- DSCR
- —
- Eligible?
- —
Short-term bridge; refi at stabilization.
Listing history 19 events
-
2026-06-19days on market $40,000 Active 42 DOM
-
2026-06-18days on market $40,000 Active 41 DOM
-
2026-06-17days on market $40,000 Active 40 DOM
-
2026-06-16days on market $40,000 Active 39 DOM
-
2026-06-15days on market $40,000 Active 38 DOM
-
2026-06-14days on market $40,000 Active 36 DOM
-
2026-06-12days on market $40,000 Active 35 DOM
-
2026-06-09days on market $40,000 Active 32 DOM
-
2026-06-08days on market $40,000 Active 31 DOM
-
2026-06-07days on market $40,000 Active 30 DOM
-
2026-06-07days on market $40,000 Active 29 DOM
-
2026-06-04days on market $40,000 Active 26 DOM
-
2026-06-02days on market $40,000 Active 25 DOM
-
2026-06-01days on market $40,000 Active 24 DOM
-
2026-05-31days on market $40,000 Active 23 DOM
-
2026-05-31days on market $40,000 Active 22 DOM
-
2026-05-04$40,000 Active 797-char remark
-
2026-02-11soldstatus $71,500
-
2025-06-18soldstatus $77,000
ⓘ Source: listings_history table (triggers on properties + properties_extension) + one-shot
backfill from property_details.listing_events for pre-trigger history.
Tax reassessment forecast AL · Resets to sale price
- Current annual tax
- $244 · $20/mo
- Projected year-2 tax
- $244 · $20/mo
- Expected delta
- $0/yr ($0/mo · 0.0%)
ⓘ Screening estimate from a state-policy table — verify with the county assessor before closing.
Climate risk First Street
- Flood 1/10 Low FEMA zone X (unshaded) · 0% chance over 30 yrs
- Wildfire 5/10 Major
- Heat 6/10 Major 7 d/yr ≥105°F today · 19 d/yr by 30 yrs out
- Wind 6/10 Major 27% chance of damaging wind over 30 yrs
- Air quality 2/10 Low 1 unhealthy d/yr today · 2 by 30 yrs out
Nearby sold comps map
Loading sold comps map…
Walkable amenities ~0.75 mi
Loading nearby amenities…
Taxation est. · year 1
- Rental income
- $11,477
- − Mortgage interest
- −$2,241
- − Property taxes
- −$244
- − Insurance
- −$200
- − Repairs & maintenance
- −$918
- − Management
- −$918
- − Depreciation
- −$1,164
- Taxable income
- $5,792
- Est. tax owed @ 24.0%
- −$1,390
- After-tax cash flow
- $4,716/yr
For passive investors: Depreciation is non-cash, so a rental often shows a tax loss while cash-flowing — sheltering income. Rental losses are passive: they offset passive income freely, and up to $25,000/yr can offset ordinary (W-2) income if you actively participate and your MAGI is under $100k (phasing out to $0 by $150k); unused losses carry forward. On sale, claimed depreciation is recaptured at up to 25%, and gains may owe capital-gains tax (a 1031 exchange can defer both). Figures are a year-1 estimate at your 24.0% rate — not tax advice; consult a CPA.
Schools (NCES district)
- District
- Piedmont City
- NCES district ID
- 0102760
- Math proficiency
- 40% ▼ -14.00%
- Reading proficiency
- 57% ▲ 6.00%
- Median HH income
- $32,302
- Composite
- 39.78/100
- National rank
- #3881
- State rank
- #14 of 129 in AL
Livability — Piedmont
- Score
- 57/100
- State rank
- #402
- US rank
- #22342
Category grades
Schools grade is shown separately in the Schools card above.
Census & demographics
- Census place
- Piedmont, AL
- City population
- 12,996
- Population (ZIP)
- 12,996
Population outlook (Calhoun County) Hauer SSP2
- Today (2025)
- 109,765 people
- By 2030
- 105,708 · -3.7%
- By 2040
- 96,192 · -12.4%
- By 2050
- 86,413 · -21.3%
- By 2075
- 63,467 · -42.2%
- By 2100
- 44,704 · -59.3%
Race, ethnicity, and origin ACS 2023
- Neighborhood character
- Predominantly White (90%)
- Race & ethnicity
- White 90% Black 5% Two or more races 3% Hispanic / Latino 2%
- Common ancestry
- Russian 2% Serbian 1% Lithuanian 1%
- Foreign-born
- 2% · Canada
- Languages at home
- 96% English-only · Spanish 4%
Political lean MEDSL · Calhoun
- 2024 margin
- Solid R (+44.8) · D 27.2% · R 71.9%
- 2008→2024 swing
- -12.2pp toward R · 2008: -32.5pp · 2024: -44.8pp
- All cycles
- 2024: R+44.8 2020: R+39.0 2016: R+41.4 2012: R+31.9 2008: R+32.5
Not yet ingested
- Civics
- —
Market trends
- HPI YoY
- ▼ -21.87%
- Current HPI
- 192.177
- Rent YoY
- —
- Metro
- —
- State GDP YoY
- ▲ 2.94%
- F500 in state
- 4
Industry mix (Fortune 500 HQ in AL)
| Industry | F500 HQs | Revenue |
|---|---|---|
| Financial Services | 1 | $8B |
|
||
| Healthcare | 1 | $5B |
|
||
Price history
-48.1% since first listed3 events — show timeline
- 2026-05-04 Listed $40,000 Greater Alabama MLS
- 2026-02-11 Sold (Public Records) $71,500 Public Records
- 2025-06-18 Sold (Public Records) $77,000 Public Records
Property tax history
+1.3%/yrLatest (2017): $244 · +0.4% YoY. Source: county tax records.
Cash-flow waterfall
monthlySold comps — $/sqft
last 12 mo · ≤1 miLoading sold comps…