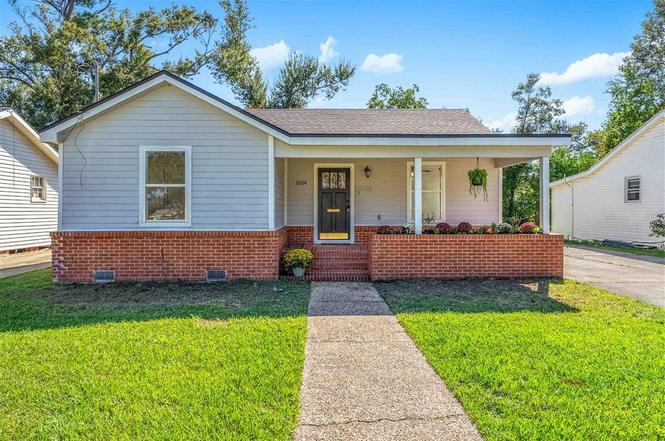
1624 9th St St · Lake Charles, LA
Flood risk 6/10 · Moderate
- FEMA flood zone
- A
- Chance of flooding over 30 yrs
- 0.71%
- Est. flood insurance / yr
- $1,009 – $1,996
Fire risk 1/10 · Minimal
- Est. fire insurance / yr
- $1,269 – $2,357
Heat risk 8/10 · Major
- Hot days now (above 109°F)
- 7 days/yr
- Hot days in 30 yrs
- 20 days/yr
Wind risk 9/10 · Severe
- Chance of severe wind over 30 yrs
- 99.0%
Air-quality risk 2/10 · Minimal
- Unhealthy air days now
- 1 days/yr
- Unhealthy air days in 30 yrs
- 1 days/yr
Risk factors via First Street. Map © Google.
Why this score? — see what drove the D+ grade
The composite is a weighted blend of 9 inputs, each scored 0–100. Each bar is that input's sub-score; the figure is the points it added to the 100-point composite (weight × sub-score).
- Cash flow +23.5/30.0
- DSCR +7.6/10.0
- 1% rule +4.9/10.0
- Rent growth +4.0/5.0
- Livability +3.4/5.0
- Schools +3.1/10.0
- Condition / age +2.5/5.0
- ARV discount +0.1/15.0
- Appreciation +0.0/10.0
$139,000
🖨 Deal sheet (PDF) 📄 Offer letter ✓ Due diligence
Listing remarks
This beautifully remodeled 3-bedroom, 2-bath home for sale in the heart of Lake Charles. This move-in-ready home has been thoughtfully updated with fresh interior paint, new flooring, and a releveled foundation, giving it a clean, modern look and lasting peace of mind. Enjoy the open-concept layout that connects the living room, dining area, and kitchen — perfect for entertaining, relaxing, or working from home. The AC has been serviced, and electrical and plumbing systems inspected, so you can focus on enjoying your new home without worry. Located just minutes from local hospitals, schools, restaurants, shopping, and entertainment, this property offers easy access to everything Lake
Key facts
- Releveled foundation
- New flooring
- Fresh interior paint
Tags
Neighborhood map
What this means for you Summary
Snapshot
- This is a 3-bed/2.0-bath single-family listed at $139k.
Deal economics
- At list price, monthly cash flow is $134 ($2k/yr) — positive.
- The deal already cash-flows at list — no discount required.
- To meet the 1% rule (rent ≥ 1% of price), the offer needs to be $137k (1.1% below list).
- Recommended offer: $122k (12.0% below list) — sets the bar for market timing.
- Cap rate 8.5% vs local median 4.2% in Lake Charles — top-decile yield for the area; either an underpriced asset or a hidden risk that comps aren't pricing in. Stress-test before assuming the spread holds.
Location & tenants
- Location reads 68/100 on livability (#95 in LA) — a middle-class / working-renter tenant base. Strengths: commute A+, cost of living A+, housing A+; Watch: crime F, amenities F, employment D-.
- Calcasieu Parish (other): math 30% / reading 44% proficiency, ranked #29 of 98 in LA (top 30%) — families likely to look elsewhere, expect single-tenant / working-renter base with shorter leases.
- Zoned schools: College Oaks Elementary School (math 12% / reading 22%, grade F, #487 of 646 statewide, top 78%, 254 students, 78% FRL); Ray D. Molo Middle Magnet School (math 6% / reading 18%, grade F, #193 of 218 statewide, top 88%, 325 students, 91% FRL); Lagrange High School (math 9% / reading 22%, grade F, #217 of 265 statewide, top 82%, 907 students, 76% FRL) — zoned schools average 82% FRL vs 52% district-wide (29 pts higher); higher-poverty schools than district average — tighter screening recommended.
- Zoned-school proficiency averages 15% at this address vs 37% district-wide (-22 pts) — the specific schools serving this property underperform the Calcasieu Parish average; the district grade overstates school quality for this exact location.
- Market conditions: Rents rising fast (+6.2%/yr); 364 active listings in the ZIP; 8 comparable units currently listed for rent nearby; rentals lingering (median 46d on market — plan ~5-8 weeks vacancy on turnover, expect pricing pressure); 50% of comp listings sitting > 30 days — soft ceiling on asking rent; 1,298 units permitted in Calcasieu Parish in 2024 (526 in 5+ unit buildings).
Forward outlook
- Local home prices are declining (-3.0%/yr); year-one equity from $961 of loan paydown is wiped out by about $4k of value loss. Plan a longer hold.
- Calcasieu County population projected at +11% by 2050 — modest demand growth; plan on rents tracking national, not racing it.
Negotiation context
- It's been on market 176 days — a 12% lower offer ($122k) is reasonable based on typical stale-listing flexibility.
- 3 sale attempts with the ask held roughly flat each time — persistent listings suggest the price (not the market) is what's stuck; bring a comps-based counter.
- Current owner paid $114k; 22% above their basis — modest negotiation headroom, anchor on the comps not their cost.
Risks & watch-outs
- Watch-outs: flood insurance adds $125/mo.
- Climate carrying-cost: in FEMA flood zone A (mandatory federal flood insurance); severe wind risk, 99% chance of damaging wind over 30y; extreme-heat days projected 7→20/yr by 2055 (HVAC capex compounding) — expect insurance premiums to compound above CPI over the hold.
Questions for the listing agent
- It's been on market 176 days. Have you received any prior offers? Is the seller open to a 12% concession, seller financing, or rate buy-down credit?
- Built in 1967 — when were the roof, HVAC, electrical panel, plumbing, and water heater last replaced?
- What's the actual annual flood-insurance premium (NFIP or private), and is the property in a SFHA with mandatory coverage?
- Why hasn't it sold? Are there any deal-killer items the seller is aware of (foundation, flood, title, zoning, code violations)?
- Is there a deadline driving the sale (1031 exchange, divorce, estate, relocation)? That informs how much negotiation room exists.
- Schools are B-rated — typically a magnet for longer-tenancy family renters. What's the average tenant stay here, and is there a school-zone premium baked into asking?
- Crime grade is F in this area — have there been break-ins, vandalism, or insurance claims at this property in the last 3 years? What carrier currently insures it and at what premium?
- The area grade is low — what's the realistic commute time and amenity access for the typical tenant pool here? Any planned neighborhood developments (good or bad) we should know about?
- What's the average days-on-market for RENTAL listings here right now (not sales)? A rising rental-DOM trend means longer vacancies and softer asking-rent achievability than the comps imply.
- What's the recent tenant-quality profile in this submarket — average credit score on applications, eviction rate, late-payment / NSF rate, and stable-employment percentage? A property-management company in the area should have these aggregated.
- How much new for-sale + rental construction is in the pipeline within 1–3 miles? Heavy new supply typically softens prices + rents 12–24 months out; constrained supply supports both.
Investment metrics
- 1% rule
- 0.99% ✗
- Cap rate
- 8.53%
- Cash-on-cash
- 7.99%
- DSCR
- 1.36
- GRM
- 8.4
CMA / ARV
- ARV (on-the-fly)
- $119,428
- Comps found
- 12
Show comp detail 12 sales within ~0.75 mi
| Address | Dist | Beds/Ba | Sqft | Sold | Price | $/sf | Match |
|---|---|---|---|---|---|---|---|
| 1624 9th St St | 0.00mi | 3/2.0 | 1,636 (0%) | 1mo | $120,000 | $73 | 99 |
| 1319 9th St | 0.28mi | 3/2.0 | 1,736 (+6%) | 12mo | $222,000 | $128 | 66 |
| 1410 Louisiana Ave | 0.56mi | 3/2.0 | 1,700 (+4%) | 3mo | $264,900 | $156 | 64 |
| 2002 13th St | 0.53mi | 3/2.0 | 1,560 (-5%) | 4mo | $78,000 | $50 | 64 |
| 1404 Dautel St | 0.53mi | 3/2.0 | 1,523 (-7%) | 1mo | $75,000 | $49 | 63 |
| 1721 11th St | 0.18mi | 3/2.0 | 1,856 (+13%) | 11mo | $105,000 | $57 | 60 |
| 1909 7th St St | 0.26mi | 3/1.0 | 1,396 (-15%) | 3mo | $45,000 | $32 | 57 |
| 2504 4th Ave Ave | 0.64mi | 3/2.0 | 1,510 (-8%) | 2mo | $161,500 | $107 | 56 |
| 2113 13th St | 0.61mi | 3/2.0 | 1,710 (+4%) | 12mo | $125,000 | $73 | 54 |
| 2405 Gardenia St | 0.55mi | 3/2.0 | 1,450 (-11%) | 2mo | $75,000 | $52 | 54 |
| 1226 7th St | 0.35mi | 3/1.0 | 1,446 (-12%) | 11mo | $142,000 | $98 | 51 |
| 1911 Orchid St | 0.65mi | 3/1.0 | 1,457 (-11%) | 10mo | $141,900 | $97 | 39 |
Match score weights: distance 35% · size 25% · config 20% · recency 20%. Top-matched comps best support the ARV.
Projected returns pro-forma
-3.0% appreciation · 6.18% rent growth · sell at horizon
- IRR
- -6.3%
- Equity multiple
- 0.76×
- Total profit
- $-9,438
- Equity at exit
- $20,725
- IRR
- 6.8%
- Equity multiple
- 1.58×
- Total profit
- $22,716
- Equity at exit
- $12,018
Cash invested: $38,920 (down + closing). Projections, not guarantees.
Landlord ↔ Tenant lean methodology
- Overall (STATE)
- 90 Strongly Landlord-Friendly
- State Louisiana
- 90 Strongly Landlord-Friendly · R+12
- County
- — inherits STATE
- City
- — inherits STATE
ZIP-level market 70601
- Rents YoY
- 6.2%
- Active inventory
- 364
- Price-to-rent
- 8.4×
Monthly cashflow live
- Estimated rent
- $1,375 high interval (Pro) →
- Mortgage (P&I)
- −$729
- Tax from tax record
- −$40 /mo · $483/yr
- Insurance
- −$58
- Flood insurance flood zone
- −$125 /mo · $1,502/yr
- HOA
- −$0
- Vacancy / Maint / Mgmt
- −$289
- Net cashflow
- $134
Break-even live
Sensitivity live
| Price | -10% $213 | -5% $173 | +0% $134 | +5% $95 | +10% $55 |
|---|---|---|---|---|---|
| Rent | -10% $25 | -5% $80 | +0% $134 | +5% $188 | +10% $243 |
| Rate | -1.0pp $204 | -0.5pp $169 | base $134 | +0.5pp $98 | +1.0pp $61 |
UW: 25.0% down · 7.5% · 30yr · 1.5% tax · 5.0% vac · 8.0% maint · 8.0% mgmt
Financing live
Cash to close
- Down payment
- $34,750
- Closing costs
- $4,170
- Reserves months
- —
- Total cash needed
- —
Loan-product check · same deal, 3 products live
Conventional
25% down · 7.5% · 30yr
- Down + closing
- —
- Monthly P&I
- —
- Monthly cashflow
- —
- DSCR
- —
- Eligible?
- —
Personal DTI + credit; lowest rate.
DSCR
20% down · 8.5% · 30yr
- Down + closing
- —
- Monthly P&I
- —
- Monthly cashflow
- —
- DSCR
- —
- Eligible?
- —
No personal income docs; deal must DSCR.
Hard money
10% down · 12.0% · 12mo
- Down + closing
- —
- Monthly P&I
- —
- Monthly cashflow
- —
- DSCR
- —
- Eligible?
- —
Short-term bridge; refi at stabilization.
Rent comps 8 comps
| Address | Beds | Baths | Sqft | Rent | $/sqft | DOM | Units | Dist |
|---|---|---|---|---|---|---|---|---|
| 1505 7th St Lake Charles, LA | 2.0 | 1.0 | 1054 | $900 | $0.85 | 45d | 1 | 0.24mi |
| 2002 13th St Lake Charles, LA | 4.0 | 2.0 | 1560 | $1,700 | $1.09 | 23d | 1 | 0.53mi |
| 1300 16th St Lake Charles, LA | 2.0 | 1.5 | 1344 | $1,295 | $0.96 | 23d | 1 | 0.72mi |
| 3108 Aster St Unit M Lake Charles, LA | 2.0 | 1.0 | 1100 | $1,300 | $1.18 | 15d | 1 | 1.18mi |
| 1710 Granger St Lake Charles, LA | 3.0 | 2.5 | 1450 | $1,900 | $1.31 | 45d | 1 | 1.19mi |
| 3206 Louisiana Ave Lake Charles, LA | 4.0 | 2.0 | 1600 | $1,600 | $1.00 | 15d | 1 | 1.32mi |
| 1731 Elms St Lake Charles, LA | 3.0 | 2.0 | 1575 | $2,000 | $1.27 | 45d | 1 | 1.41mi |
| 125 East St Lake Charles, LA | 3.0 | 2.0 | 1138 | $3,850 | $3.38 | 45d | 1 | 1.42mi |
Listing history 10 events
-
2026-04-21status Pending
-
2026-03-11status Active
-
2026-03-08status Pending
-
2026-01-21price $139,000
-
2025-11-10price $140,000
-
2025-10-25status Active
-
2025-10-25historical
-
2025-10-22$145,000 Active
-
2022-04-29soldstatus $113,900
-
2013-05-09soldstatus $90,000
ⓘ Source: listings_history table (triggers on properties + properties_extension) + one-shot
backfill from property_details.listing_events for pre-trigger history.
Tax reassessment forecast LA · Resets to sale price
- Current annual tax
- $483 · $40/mo
- Projected year-2 tax
- $764 · $64/mo
- Expected delta
- +$282/yr (+$23/mo · 58.4%)
ⓘ Screening estimate from a state-policy table — verify with the county assessor before closing.
Climate risk First Street
- Flood 6/10 Major FEMA zone A · 71% chance over 30 yrs
- Wildfire 1/10 Low
- Heat 8/10 Severe 7 d/yr ≥109°F today · 20 d/yr by 30 yrs out
- Wind 9/10 Extreme 99% chance of damaging wind over 30 yrs
- Air quality 2/10 Low 1 unhealthy d/yr today · 1 by 30 yrs out
Nearby sold comps map
Loading sold comps map…
Walkable amenities ~0.75 mi
Loading nearby amenities…
Taxation est. · year 1
- Rental income
- $16,500
- − Mortgage interest
- −$7,786
- − Property taxes
- −$483
- − Insurance
- −$2,198
- − Repairs & maintenance
- −$1,320
- − Management
- −$1,320
- − Depreciation
- −$4,044
- Taxable loss
- −$650
- Est. tax savings @ 24.0%
- +$156
- After-tax cash flow
- $1,763/yr
For passive investors: Depreciation is non-cash, so a rental often shows a tax loss while cash-flowing — sheltering income. Rental losses are passive: they offset passive income freely, and up to $25,000/yr can offset ordinary (W-2) income if you actively participate and your MAGI is under $100k (phasing out to $0 by $150k); unused losses carry forward. On sale, claimed depreciation is recaptured at up to 25%, and gains may owe capital-gains tax (a 1031 exchange can defer both). Figures are a year-1 estimate at your 24.0% rate — not tax advice; consult a CPA.
Schools (NCES district)
- District
- Calcasieu Parish
- NCES district ID
- 2200330
- Math proficiency
- 30% ▼ -39.00%
- Reading proficiency
- 44% ▼ -33.00%
- Median HH income
- $44,700
- Composite
- 31.45/100
- National rank
- #5979
- State rank
- #29 of 98 in LA
Livability — Lake Charles
- Score
- 68/100
- State rank
- #95
- US rank
- #9820
Category grades
Schools grade is shown separately in the Schools card above.
Census & demographics
- Census place
- Lake Charles, LA
- County
- Calcasieu Parish · 170,889 people
- City population
- 133,538
- Metro
- Lake Charles, LA
- Population (ZIP)
- 30,872
- Household income
- $49,992
- Rent vs Own
- Severe rent burden
- 1304.0
Population outlook (Calcasieu County) Hauer SSP2
- Today (2025)
- 212,179 people
- By 2030
- 218,199 · +2.8%
- By 2040
- 228,486 · +7.7%
- By 2050
- 236,208 · +11.3%
- By 2075
- 251,696 · +18.6%
- By 2100
- 247,848 · +16.8%
Race, ethnicity, and origin ACS 2023
- Neighborhood character
- Diverse neighborhood (Simpson 0.55)
- Race & ethnicity
- Black 59% White 31% Two or more races 7% Hispanic / Latino 5%
- Common ancestry
- Lithuanian 7% Iranian 1% Serbian 1%
- Foreign-born
- 3% · Canada
- Languages at home
- 95% English-only · Spanish 2% French/Haitian/Cajun 1%
Political lean MEDSL · Calcasieu
- 2024 margin
- Solid R (+39.6) · D 29.5% · R 69.0% · Other 1.5%
- 2008→2024 swing
- -15.0pp toward R · 2008: -24.6pp · 2024: -39.6pp
- All cycles
- 2024: R+39.6 2020: R+35.2 2016: R+33.3 2012: R+28.7 2008: R+24.6
Not yet ingested
- Civics
- —
Market trends
- HPI YoY
- ▼ -109.32%
- Current HPI
- 55.6127
- Rent YoY
- ▲ 6.18%
- Metro
- Lake Charles, LA
- State GDP YoY
- ▲ 3.29%
- F500 in state
- 10
Industry mix (Fortune 500 HQ in LA)
| Industry | F500 HQs | Revenue |
|---|---|---|
| Telecommunications | 2 | $23B |
|
||
| Utilities | 1 | $12B |
|
||
| Wholesale / Distribution | 1 | $5B |
|
||
| Advertising | 1 | $2B |
|
||
Price history
+54.4% since first listed10 events — show timeline
- 2026-04-21 Pending — SWLAR
- 2026-03-11 Relisted — SWLAR
- 2026-03-08 Pending — SWLAR
- 2026-01-21 Price Changed $139,000 SWLAR
- 2025-11-10 Price Changed $140,000 SWLAR
- 2025-10-25 Relisted — SWLAR
- 2025-10-25 Delisted — SWLAR
- 2025-10-22 Listed $145,000 SWLAR
- 2022-04-29 Sold (Public Records) $113,900 Public Records
- 2013-05-09 Sold (Public Records) $90,000 Public Records
Property tax history
+0.6%/yrLatest (2025): $483 · +4.5% YoY. Source: county tax records.
Cash-flow waterfall
monthlySold comps — $/sqft
last 12 mo · ≤1 miLoading sold comps…