 🔨 Auction
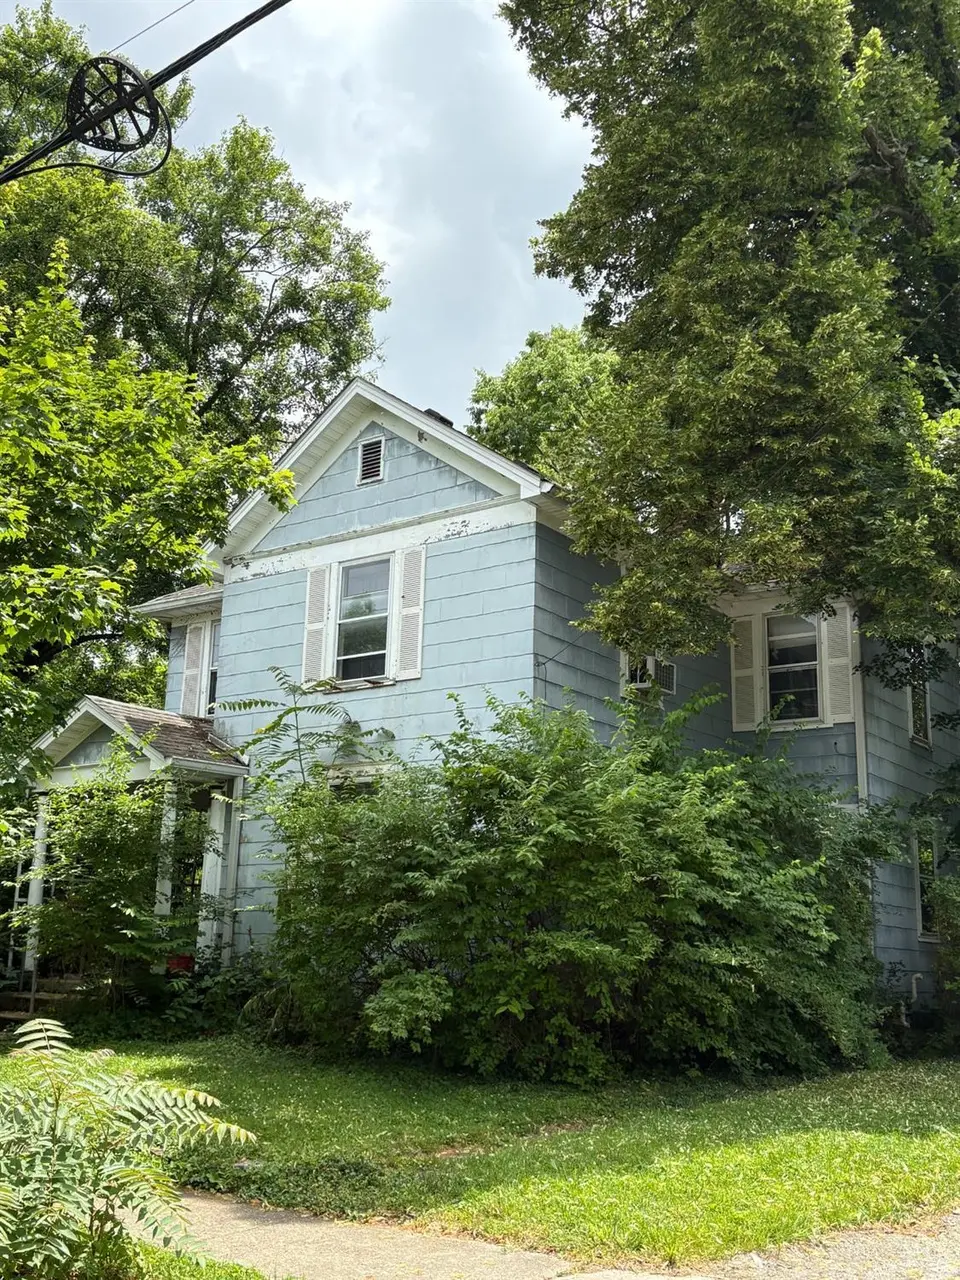
209 W Withrow St · Oxford, OH
Flood risk 1/10 · Minimal
- FEMA flood zone
- X (unshaded)
- Chance of flooding over 30 yrs
- 0.0%
- Est. flood insurance / yr
- $473 – $860
Fire risk 1/10 · Minimal
- Est. fire insurance / yr
- $713 – $1,323
Heat risk 3/10 · Minor
- Hot days now (above 101°F)
- 7 days/yr
- Hot days in 30 yrs
- 19 days/yr
Wind risk 2/10 · Minimal
- Chance of severe wind over 30 yrs
- 1.0%
Air-quality risk 3/10 · Minor
- Unhealthy air days now
- 2 days/yr
- Unhealthy air days in 30 yrs
- 4 days/yr
Risk factors via First Street. Map © Google.
Why this score? — see what drove the F grade
The composite is a weighted blend of 9 inputs, each scored 0–100. Each bar is that input's sub-score; the figure is the points it added to the 100-point composite (weight × sub-score).
- ARV discount +7.5/15.0
- Cash flow +7.2/30.0
- Schools +4.9/10.0
- Livability +4.4/5.0
- Rent growth +2.5/5.0
- Condition / age +2.5/5.0
- 1% rule +2.0/10.0
- DSCR +1.4/10.0
- Appreciation +0.0/10.0
$1
🖨 Deal sheet 📄 Offer letter ✓ Due diligence
Listing remarks
Oxford's Mile Square! Prime rental location! Great opportunity for investors to add to your portfolio. Auction at the house to take place on Sunday July 12th at 2:00pm. Rooms sizes are approx. Darling covered front porch. Beautiful tiled fireplace w/ wood surround mantle.
Key facts
- Covered front porch
- Tiled fireplace
- 5,144 sq ft lot
Tags
Property features AI
Finance
- Other: Property listed at auction
- HOA & community: No HOA
Exterior
- Parking: Detached oversized side garage (1 car); On-street parking available
- Utilities: Public water; Public sewer; Natural gas
- Home design: Victorian-style single family home; Two levels; Stone foundation
- Construction: Shingle roof; Construction materials: Other
- Exterior features: Covered deck/patio; Wood fencing
Interior
- Kitchen: Butler's pantry; Walkout kitchen; Kitchen approximately 10 x 10
- Bedrooms: Four bedrooms (all on second level); Primary bedroom approximately 12 x 10; Second and third bedrooms approximately 10 x 10; Fourth bedroom approximately 7 x 10
- Flooring: Wood floors in living room
- Bathrooms: One full bathroom on main level
- Heating & cooling: Forced air heating (gas); Gas water heater
- Interior features: Nine total rooms; Full basement with concrete floor; Handyman special
- Laundry & utility: Main-level laundry room (about 6 x 5)
Neighborhood map
What this means for you Summary
Snapshot
- This is a 4-bed/1.0-bath single-family listed at $1.
Deal economics
- At list price, monthly cash flow is $-391 ($-5k/yr) — negative.
- The deal already cash-flows at list — no discount required.
- Meets the 1% rule at list price ($2k rent vs $1).
- Cap rate 4.6% vs local median 3.6% in Oxford — meaningfully above typical; check what's discounted (condition, days-on-market, listing class) to confirm the premium yield is real.
Location & tenants
- Location reads 87/100 on livability (#30 in OH, #267 nationally) — a professional / high-income tenant draw. Strengths: amenities A+, commute A+, cost of living A+; Watch: employment F.
- Talawanda City (rural): math 55% / reading 61% proficiency, ranked #323 of 656 in OH (top 49%) — acceptable for families but not a draw, mixed tenant base, ~2y average lease.
- Market conditions: 66 active listings in the ZIP; 1,163 units permitted in Butler County in 2024 (356 in 5+ unit buildings).
- At $1,989/mo this rent would consume 48% of the median local household income ($49k/yr) (locally 1724% of renters already pay >50% of income on rent) — very limited rent-growth headroom before tenants either downsize or default.
Forward outlook
- Local home prices are declining (-3.0%/yr); year-one equity from $2k of loan paydown is wiped out by about $9k of value loss. Plan a longer hold.
Negotiation context
- Only 9 days on market — expect competitive offers; lowballing is unlikely to land.
Risks & watch-outs
- Watch-outs: property tax is 425832.0% of price; built in 1904 — expect roof / HVAC / electrical / plumbing capex.
Questions for the listing agent
- What do current leases actually rent for vs. the listed asking? Can we see a recent rent roll and the last 12 months of T-12 income?
- Built in 1904 — when were the roof, HVAC, electrical panel, plumbing, and water heater last replaced?
- Property tax is high relative to price — has the assessment been appealed recently, and will the sale trigger a re-assessment?
- Is there a deadline driving the sale (1031 exchange, divorce, estate, relocation)? That informs how much negotiation room exists.
- Schools are A-rated — typically a magnet for longer-tenancy family renters. What's the average tenant stay here, and is there a school-zone premium baked into asking?
- The area grade is low — what's the realistic commute time and amenity access for the typical tenant pool here? Any planned neighborhood developments (good or bad) we should know about?
- What's the average days-on-market for RENTAL listings here right now (not sales)? A rising rental-DOM trend means longer vacancies and softer asking-rent achievability than the comps imply.
- What's the recent tenant-quality profile in this submarket — average credit score on applications, eviction rate, late-payment / NSF rate, and stable-employment percentage? A property-management company in the area should have these aggregated.
- How much new for-sale + rental construction is in the pipeline within 1–3 miles? Heavy new supply typically softens prices + rents 12–24 months out; constrained supply supports both.
Investment metrics
- 1% rule
- 0.70% ✗
- Cap rate
- 4.64%
- Cash-on-cash
- -5.90%
- DSCR
- 0.74
- GRM
- 11.9
CMA / ARV
- ARV (on-the-fly)
- $283,888
- Comps found
- 12
Show comp detail 12 sales within ~0.75 mi
| Address | Dist | Beds/Ba | Sqft | Sold | Price | $/sf | Match |
|---|---|---|---|---|---|---|---|
| 5170 Brown Rd | 0.25mi | 4/2.0 | 1,664 (+3%) | 0mo | $385,000 | $231 | 79 |
| 230 W Collins St | 0.26mi | 3/1.5 (-1) | 1,554 (-4%) | 1mo | $180,000 | $116 | 74 |
| 112 S Elm St | 0.25mi | 3/1.0 (-1) | 1,536 (-5%) | 8mo | $180,250 | $117 | 69 |
| 117 Marti Ct | 0.36mi | 3/2.0 (-1) | 1,555 (-4%) | 2mo | $270,000 | $174 | 67 |
| 315 W Withrow St | 0.09mi | 3/1.0 (-1) | 1,468 (-9%) | 11mo | $260,000 | $177 | 67 |
| 312 N Beech St | 0.18mi | 4/2.0 | 1,412 (-12%) | 3mo | $355,000 | $251 | 64 |
| 217 S Main St | 0.39mi | 4/1.5 | 1,408 (-13%) | 1mo | $426,000 | $303 | 58 |
| 335 N Locust St | 0.21mi | 3/2.0 (-1) | 1,829 (+13%) | 8mo | $150,000 | $82 | 52 |
| 6171 Vereker Dr | 0.67mi | 3/2.0 (-1) | 1,541 (-4%) | 8mo | $240,000 | $156 | 46 |
| 719 S College Ave | 0.72mi | 3/2.0 (-1) | 1,492 (-8%) | 0mo | $271,250 | $182 | 44 |
| 100 Hilltop Rd | 0.55mi | 4/2.0 | 1,818 (+13%) | 8mo | $320,000 | $176 | 42 |
| 101 W Central Ave | 0.70mi | 3/2.0 (-1) | 1,440 (-11%) | 12mo | $235,000 | $163 | 30 |
Match score weights: distance 35% · size 25% · config 20% · recency 20%. Top-matched comps best support the ARV.
Projected returns pro-forma
-3.0% appreciation · 3.0% rent growth · sell at horizon
- IRR
- -26.4%
- Equity multiple
- 0.11×
- Total profit
- $-70,864
- Equity at exit
- $42,329
- IRR
- -23.5%
- Equity multiple
- -0.18×
- Total profit
- $-93,637
- Equity at exit
- $24,545
Cash invested: $79,489 (down + closing). Projections, not guarantees.
Landlord ↔ Tenant lean methodology
- Overall (STATE)
- 73 Landlord-Friendly
- State Ohio
- 73 Landlord-Friendly · R+6
- County
- — inherits STATE
- City
- — inherits STATE
ZIP-level market 45056
- Home prices YoY
- -29.6%
- Active inventory
- 66
Monthly cashflow live
- Estimated rent
- $1,989 medium interval (Pro) →
- Mortgage (P&I)
- −$1,489
- Tax est. 1.5%
- −$355 /mo · $4,258/yr
- Insurance
- −$118
- HOA
- −$0
- Vacancy / Maint / Mgmt
- −$418
- Net cashflow
- $-391
Break-even live
UW: 25.0% down · 7.5% · 30yr · 1.5% tax · 5.0% vac · 8.0% maint · 8.0% mgmt
Financing live
Cash to close
- Down payment
- $70,972
- Closing costs
- $8,517
- Reserves months
- —
- Total cash needed
- —
Loan-product check · same deal, 3 products live
Conventional
25% down · 7.5% · 30yr
- Down + closing
- —
- Monthly P&I
- —
- Monthly cashflow
- —
- DSCR
- —
- Eligible?
- —
Personal DTI + credit; lowest rate.
DSCR
20% down · 8.5% · 30yr
- Down + closing
- —
- Monthly P&I
- —
- Monthly cashflow
- —
- DSCR
- —
- Eligible?
- —
No personal income docs; deal must DSCR.
Hard money
10% down · 12.0% · 12mo
- Down + closing
- —
- Monthly P&I
- —
- Monthly cashflow
- —
- DSCR
- —
- Eligible?
- —
Short-term bridge; refi at stabilization.
Listing history 8 events
-
2026-06-18days on market $1 Active 9 DOM
-
2026-06-17days on market $1 Active 8 DOM
-
2026-06-16days on market $1 Active 7 DOM
-
2026-06-15days on market $1 Active 6 DOM
-
2026-06-13remarks 272-char remark
-
2026-06-13days on market $1 Active 4 DOM
-
2026-06-10remarks 250-char remark
-
2026-06-10$1 Active 1 DOM
ⓘ Source: listings_history table (triggers on properties + properties_extension) + one-shot
backfill from property_details.listing_events for pre-trigger history.
Climate risk First Street
- Flood 1/10 Low FEMA zone X (unshaded) · 0% chance over 30 yrs
- Wildfire 1/10 Low
- Heat 3/10 Moderate 7 d/yr ≥101°F today · 19 d/yr by 30 yrs out
- Wind 2/10 Low 100% chance of damaging wind over 30 yrs
- Air quality 3/10 Moderate 2 unhealthy d/yr today · 4 by 30 yrs out
Nearby sold comps map
Loading sold comps map…
Walkable amenities ~0.75 mi
Loading nearby amenities…
Taxation est. · year 1
- Rental income
- $23,864
- − Mortgage interest
- −$15,902
- − Property taxes
- −$4,258
- − Insurance
- −$1,419
- − Repairs & maintenance
- −$1,909
- − Management
- −$1,909
- − Depreciation
- −$8,259
- Taxable loss
- −$9,792
- Est. tax savings @ 24.0%
- +$2,350
- After-tax cash flow
- $-2,340/yr
For passive investors: Depreciation is non-cash, so a rental often shows a tax loss while cash-flowing — sheltering income. Rental losses are passive: they offset passive income freely, and up to $25,000/yr can offset ordinary (W-2) income if you actively participate and your MAGI is under $100k (phasing out to $0 by $150k); unused losses carry forward. On sale, claimed depreciation is recaptured at up to 25%, and gains may owe capital-gains tax (a 1031 exchange can defer both). Figures are a year-1 estimate at your 24.0% rate — not tax advice; consult a CPA.
Schools (NCES district)
- District
- Talawanda City
- NCES district ID
- 3904615
- Math proficiency
- 55% ▼ -20.00%
- Reading proficiency
- 61% ▼ -13.00%
- Median HH income
- $47,696
- Composite
- 49.18/100
- National rank
- #2043
- State rank
- #323 of 656 in OH
Livability — Oxford
- Score
- 87/100
- State rank
- #30
- US rank
- #267
Category grades
Schools grade is shown separately in the Schools card above.
Census & demographics
- Census place
- Oxford, OH
- County
- Butler County · 381,674 people
- City population
- 27,376
- Metro
- Cincinnati, OH-KY-IN
- Population (ZIP)
- 27,376
- Household income
- $49,233
- Rent vs Own
- Severe rent burden
- 1724.0
Population outlook (Butler County) Hauer SSP2
- Today (2025)
- 387,706 people
- By 2030
- 392,028 · +1.1%
- By 2040
- 395,307 · +2.0%
- By 2050
- 391,116 · +0.9%
- By 2075
- 378,642 · -2.3%
- By 2100
- 343,248 · -11.5%
Race, ethnicity, and origin ACS 2023
- Neighborhood character
- Predominantly White (81%)
- Race & ethnicity
- White 81% Asian 7% Two or more races 5% Black 4% Hispanic / Latino 3%
- Common ancestry
- Italian 2% Romanian 2% Lithuanian 1%
- Foreign-born
- 10% · China, Vietnam, Canada
- Languages at home
- 90% English-only · Chinese 5% Spanish 2% Other Indo-European 1%
Political lean MEDSL · Butler
- 2024 margin
- Strong R (+26.3) · D 36.4% · R 62.7%
- 2008→2024 swing
- -3.6pp toward R · 2008: -22.6pp · 2024: -26.3pp
- All cycles
- 2024: R+26.3 2020: R+24.0 2016: R+28.3 2012: R+26.2 2008: R+22.6
Not yet ingested
- Civics
- —
Market trends
- HPI YoY
- ▼ -93.81%
- Current HPI
- 223.1217
- Rent YoY
- —
- Metro
- Cincinnati, OH-KY-IN
- State GDP YoY
- ▲ 1.98%
- F500 in state
- 48
Industry mix (Fortune 500 HQ in OH)
| Industry | F500 HQs | Revenue |
|---|---|---|
| Insurance | 3 | $145B |
|
||
| Industrial Machinery | 3 | $49B |
|
||
| Financial Services | 3 | $24B |
|
||
| Consumer Goods | 2 | $93B |
|
||
| Aerospace / Defense | 2 | $47B |
|
||
| Utilities | 2 | $33B |
|
||
Property tax history
+5.5%/yrLatest (2025): $2,885 · +19.0% YoY. Source: county tax records.
Cash-flow waterfall
monthlySold comps — $/sqft
last 12 mo · ≤1 miLoading sold comps…