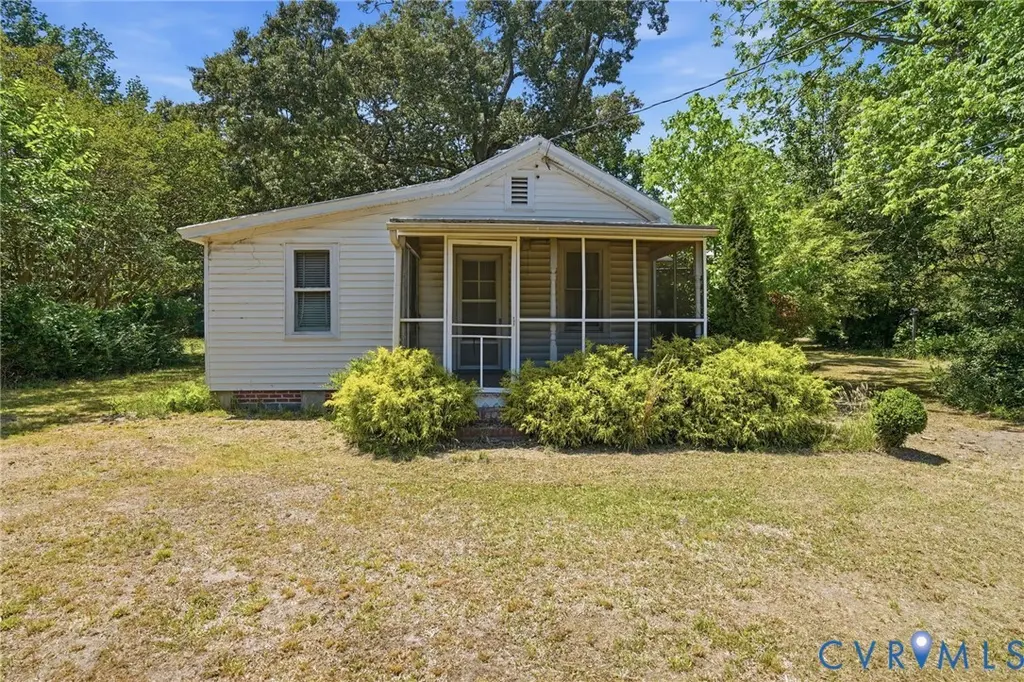
2350 Chelsea Rd · West Point, VA
Flood risk 6/10 · Moderate
- FEMA flood zone
- AE
- Chance of flooding over 30 yrs
- 0.67%
- Est. flood insurance / yr
- $1,737 – $8,500
Fire risk 2/10 · Minimal
- Est. fire insurance / yr
- $666 – $1,236
Heat risk 9/10 · Severe
- Hot days now (above 110°F)
- 7 days/yr
- Hot days in 30 yrs
- 16 days/yr
Wind risk 6/10 · Moderate
- Chance of severe wind over 30 yrs
- 59.0%
Air-quality risk 1/10 · Minimal
- Unhealthy air days now
- 0 days/yr
- Unhealthy air days in 30 yrs
- 0 days/yr
Risk factors via First Street. Map © Google.
Why this score? — see what drove the B+ grade
The composite is a weighted blend of 9 inputs, each scored 0–100. Each bar is that input's sub-score; the figure is the points it added to the 100-point composite (weight × sub-score).
- Cash flow +30.0/30.0
- ARV discount +15.0/15.0
- DSCR +10.0/10.0
- 1% rule +7.7/10.0
- Schools +6.1/10.0
- Livability +3.8/5.0
- Rent growth +2.5/5.0
- Condition / age +1.5/5.0
- Appreciation +0.0/10.0
$175,000
🖨 Deal sheet (PDF) 📄 Offer letter ✓ Due diligence
Listing remarks
Investor special with 4.82 acres in West Point! Close to Mattaponi River! Walkable to West Point Schools, and just two minutes to Riverwalk Park! This 3-bedroom home is being sold strictly AS-IS and needs significant renovation, making it a great opportunity for investors, flippers, or buyers looking for a project with so much potential. Inside you will find beautiful hardwood floors in most rooms! Kitchen with vintage stove, and a separate laundry room! Outside there is a detached garage with workshop, and two other sheds! Situated on a spacious and private lot, the property offers plenty of room to reimagine, expand, or restore. Conveniently located just minutes from downtown West Point
Key facts
- 4.82 acres
- Vintage stove
- 4.82 acre lot
Tags
Property features AI
Exterior
- Parking: Detached garage; Driveway; Off-street parking; Unpaved parking
- Utilities: Well water; Septic tank
- Home design: Single-story; Resale property; Facing: unspecified
- Construction: Metal roof; Brick, plaster, vinyl siding and wood siding exterior; Crawl space foundation; Built (actual year not specified)
- Exterior features: Outbuilding(s); Storage; Shed; Front screened porch; Unpaved driveway; Corner lot; Level topography
Interior
- Kitchen: Electric cooking; Oven; Stove; Refrigerator; Pantry; Eat-in kitchen
- Bedrooms: Main level bedroom
- Flooring: Partially carpeted; Vinyl flooring; Wood flooring
- Bathrooms: 1 full bathroom
- Heating & cooling: Electric heating; Forced air; Floor furnace; Has heating
- Interior features: Bedroom on main level; Ceiling fans; Eat-in kitchen; Pantry; Paneling / wainscoting
- Laundry & utility: Washer hookup; Dryer hookup; Electric water heater
Neighborhood map
What this means for you Summary
Snapshot
- This is a 3-bed/1.0-bath single-family listed at $175k. Condition is rated poor.
Deal economics
- At list price, monthly cash flow is $302 ($4k/yr) — positive.
- The deal already cash-flows at list — no discount required.
- Meets the 1% rule at list price ($2k rent vs $175k).
- Cap rate 11.3% vs local median 3.4% in West Point — top-decile yield for the area; either an underpriced asset or a hidden risk that comps aren't pricing in. Stress-test before assuming the spread holds.
Location & tenants
- Location reads 76/100 on livability (#111 in VA, #3,458 nationally) — a middle-class / working-renter tenant base. Strengths: schools A+, crime A+, employment A+; Watch: amenities F, commute F.
- West Point Public School District (town): math 63% / reading 80% proficiency, ranked #17 of 131 in VA (top 13%) — strong family-tenant draw, lease renewals of 3-5y typical.
- Market conditions: 62 active listings in the ZIP; 129 units permitted in King William County in 2024 (0 in 5+ unit buildings).
Forward outlook
- Local home prices are declining (-3.0%/yr); year-one equity from $1k of loan paydown is wiped out by about $5k of value loss. Plan a longer hold.
Negotiation context
- Only 6 days on market — expect competitive offers; lowballing is unlikely to land.
- Current owner paid $135k; 30% above their basis — modest negotiation headroom, anchor on the comps not their cost.
Risks & watch-outs
- Watch-outs: flood insurance adds $427/mo; built in 1940 — expect roof / HVAC / electrical / plumbing capex.
- Climate carrying-cost: in FEMA flood zone AE (mandatory federal flood insurance); major wind risk, 59% chance of damaging wind over 30y; extreme-heat days projected 7→16/yr by 2055 (HVAC capex compounding) — expect insurance premiums to compound above CPI over the hold.
Questions for the listing agent
- Have any recent inspections been done? Can we get a copy of the seller's disclosures and any deferred-maintenance estimates?
- Built in 1940 — when were the roof, HVAC, electrical panel, plumbing, and water heater last replaced?
- What's the actual annual flood-insurance premium (NFIP or private), and is the property in a SFHA with mandatory coverage?
- Is there a deadline driving the sale (1031 exchange, divorce, estate, relocation)? That informs how much negotiation room exists.
- Schools are A-rated — typically a magnet for longer-tenancy family renters. What's the average tenant stay here, and is there a school-zone premium baked into asking?
- What's the average days-on-market for RENTAL listings here right now (not sales)? A rising rental-DOM trend means longer vacancies and softer asking-rent achievability than the comps imply.
- What's the recent tenant-quality profile in this submarket — average credit score on applications, eviction rate, late-payment / NSF rate, and stable-employment percentage? A property-management company in the area should have these aggregated.
- How much new for-sale + rental construction is in the pipeline within 1–3 miles? Heavy new supply typically softens prices + rents 12–24 months out; constrained supply supports both.
Investment metrics
- 1% rule
- 1.27% ✓
- Cap rate
- 11.29%
- Cash-on-cash
- 17.85%
- DSCR
- 1.79
- GRM
- 6.6
CMA / ARV
- ARV (on-the-fly)
- $295,176
- Comps found
- 4
Show comp detail 4 sales within ~0.75 mi
| Address | Dist | Beds/Ba | Sqft | Sold | Price | $/sf | Match |
|---|---|---|---|---|---|---|---|
| 322 Ogden St | 0.61mi | 3/2.5 | 1,200 (+2%) | 1mo | $300,950 | $251 | 61 |
| 332 Ogden St | 0.61mi | 3/2.5 | 1,200 (+2%) | 1mo | $295,000 | $246 | 61 |
| 314 Ogden St | 0.64mi | 3/2.5 | 1,200 (+2%) | 1mo | $303,000 | $253 | 60 |
| 260 Thompson Ave | 0.65mi | 4/2.0 (+1) | 1,263 (+7%) | 15mo | $240,000 | $190 | 36 |
Match score weights: distance 35% · size 25% · config 20% · recency 20%. Top-matched comps best support the ARV.
Projected returns pro-forma
-3.0% appreciation · 3.0% rent growth · sell at horizon
- IRR
- -4.9%
- Equity multiple
- 0.82×
- Total profit
- $-8,912
- Equity at exit
- $26,093
- IRR
- 4.9%
- Equity multiple
- 1.36×
- Total profit
- $17,786
- Equity at exit
- $15,131
Cash invested: $49,000 (down + closing). Projections, not guarantees.
Landlord ↔ Tenant lean methodology
- Overall (STATE)
- 55 Moderately Landlord-Leaning
- State Virginia
- 55 Moderately Landlord-Leaning · D+2
- County
- — inherits STATE
- City
- — inherits STATE
ZIP-level market 23181
- Home prices YoY
- -29.9%
- Active inventory
- 62
- Price-to-rent
- 6.6×
Monthly cashflow live
- Estimated rent
- $2,221 medium interval (Pro) →
- Mortgage (P&I)
- −$918
- Tax from tax record
- −$35 /mo · $422/yr
- Insurance
- −$73
- Flood insurance flood zone
- −$427 /mo · $5,118/yr
- HOA
- −$0
- Vacancy / Maint / Mgmt
- −$466
- Net cashflow
- $302
Break-even live
Sensitivity live
| Price | -10% $402 | -5% $352 | +0% $302 | +5% $253 | +10% $203 |
|---|---|---|---|---|---|
| Rent | -10% $127 | -5% $215 | +0% $302 | +5% $390 | +10% $478 |
| Rate | -1.0pp $391 | -0.5pp $347 | base $302 | +0.5pp $257 | +1.0pp $211 |
UW: 25.0% down · 7.5% · 30yr · 1.5% tax · 5.0% vac · 8.0% maint · 8.0% mgmt
Financing live
Cash to close
- Down payment
- $43,750
- Closing costs
- $5,250
- Reserves months
- —
- Total cash needed
- —
Loan-product check · same deal, 3 products live
Conventional
25% down · 7.5% · 30yr
- Down + closing
- —
- Monthly P&I
- —
- Monthly cashflow
- —
- DSCR
- —
- Eligible?
- —
Personal DTI + credit; lowest rate.
DSCR
20% down · 8.5% · 30yr
- Down + closing
- —
- Monthly P&I
- —
- Monthly cashflow
- —
- DSCR
- —
- Eligible?
- —
No personal income docs; deal must DSCR.
Hard money
10% down · 12.0% · 12mo
- Down + closing
- —
- Monthly P&I
- —
- Monthly cashflow
- —
- DSCR
- —
- Eligible?
- —
Short-term bridge; refi at stabilization.
Listing history 3 events
-
2026-05-21$175,000 Active
-
2023-09-01soldstatus $135,000
-
2019-07-11soldstatus $145,000
ⓘ Source: listings_history table (triggers on properties + properties_extension) + one-shot
backfill from property_details.listing_events for pre-trigger history.
Tax reassessment forecast VA · Resets to sale price
- Current annual tax
- $422 · $35/mo
- Projected year-2 tax
- $1,435 · $120/mo
- Expected delta
- +$1,013/yr (+$84/mo · 240.4%)
ⓘ Screening estimate from a state-policy table — verify with the county assessor before closing.
Climate risk First Street
- Flood 6/10 Major FEMA zone AE · 67% chance over 30 yrs
- Wildfire 2/10 Low
- Heat 9/10 Extreme 7 d/yr ≥110°F today · 16 d/yr by 30 yrs out
- Wind 6/10 Major 59% chance of damaging wind over 30 yrs
- Air quality 1/10 Low 0 unhealthy d/yr today · 0 by 30 yrs out
Nearby sold comps map
Loading sold comps map…
Walkable amenities ~0.75 mi
Loading nearby amenities…
Taxation est. · year 1
- Rental income
- $26,654
- − Mortgage interest
- −$9,803
- − Property taxes
- −$422
- − Insurance
- −$5,994
- − Repairs & maintenance
- −$2,132
- − Management
- −$2,132
- − Depreciation
- −$5,091
- Taxable income
- $1,081
- Est. tax owed @ 24.0%
- −$259
- After-tax cash flow
- $3,370/yr
For passive investors: Depreciation is non-cash, so a rental often shows a tax loss while cash-flowing — sheltering income. Rental losses are passive: they offset passive income freely, and up to $25,000/yr can offset ordinary (W-2) income if you actively participate and your MAGI is under $100k (phasing out to $0 by $150k); unused losses carry forward. On sale, claimed depreciation is recaptured at up to 25%, and gains may owe capital-gains tax (a 1031 exchange can defer both). Figures are a year-1 estimate at your 24.0% rate — not tax advice; consult a CPA.
Condition & rehab AI · 1 photo
This 3-bedroom home in West Point, VA, requires extensive renovation and updates to bring it up to current standards and increase its value.
Repairs flagged
- Major Painting — Exterior siding appears aged
- Major Siding replacement — Exterior siding appears aged
- Major Kitchen update — Vintage stove, no updates
- Major Bathroom update — No updates
- Major Landscaping — Overgrown yard
Value-add opportunities
- Both Painting and updating exterior siding — Improves curb appeal and value
- Both Kitchen and bathroom updates — Modernizes the home and increases value
- Both Landscaping and yard maintenance — Enhances curb appeal and value
Renovation cost estimate screening
| Repair item | Severity | Est. cost |
|---|---|---|
| Painting · Exterior siding appears aged | Major | $15,000–50,000 |
| Siding replacement · Exterior siding appears aged | Major | $15,000–50,000 |
| Kitchen update · Vintage stove, no updates | Major | $15,000–50,000 |
| Bathroom update · No updates | Major | $15,000–50,000 |
| Landscaping · Overgrown yard | Major | $15,000–50,000 |
| Total estimated repair cost · 5 items | $75,000–250,000 |
Value-add ROI direction
- Both Painting and updating exterior siding — Improves curb appeal and value ↑
- Both Kitchen and bathroom updates — Modernizes the home and increases value ↑
- Both Landscaping and yard maintenance — Enhances curb appeal and value ↑
ⓘ Cost ranges are severity-bucket heuristics (US national rule-of-thumb). Get contractor quotes + a written scope before underwriting a rehab budget.
Schools (NCES district)
- District
- West Point Public School District
- NCES district ID
- 5103950
- Math proficiency
- 63% ▼ -30.00%
- Reading proficiency
- 80% ▼ -12.00%
- Median HH income
- $59,177
- Composite
- 61.42/100
- National rank
- #761
- State rank
- #17 of 131 in VA
Livability — West Point
- Score
- 76/100
- State rank
- #111
- US rank
- #3458
Category grades
Schools grade is shown separately in the Schools card above.
Census & demographics
- Census place
- West Point, VA
- Population (ZIP)
- 5,386
Population outlook (King William County) Hauer SSP2
- Today (2025)
- 16,840 people
- By 2030
- 16,990 · +0.9%
- By 2040
- 16,965 · +0.7%
- By 2050
- 16,483 · -2.1%
- By 2075
- 15,292 · -9.2%
- By 2100
- 12,764 · -24.2%
Race, ethnicity, and origin ACS 2023
- Neighborhood character
- Predominantly White (79%)
- Race & ethnicity
- White 79% Black 9% Two or more races 8% Hispanic / Latino 5% Native American 1%
- Hispanic origin (detail)
- Mexican 4%
- Common ancestry
- Romanian 4% Lithuanian 2% Italian 2%
- Foreign-born
- 2% · Canada
- Languages at home
- 97% English-only · Spanish 2% Tagalog/Filipino 1%
Political lean MEDSL · King William
- 2024 margin
- Solid R (+40.6) · D 29.3% · R 69.9%
- 2008→2024 swing
- -21.2pp toward R · 2008: -19.3pp · 2024: -40.6pp
- All cycles
- 2024: R+40.6 2020: R+37.8 2016: R+35.3 2012: R+23.9 2008: R+19.3
Not yet ingested
- Civics
- —
Market trends
- HPI YoY
- ▼ -76.32%
- Current HPI
- 179.2453
- Rent YoY
- —
- Metro
- —
- State GDP YoY
- ▲ 2.40%
- F500 in state
- 50
Industry mix (Fortune 500 HQ in VA)
| Industry | F500 HQs | Revenue |
|---|---|---|
| Aerospace / Defense | 4 | $236B |
|
||
| Technology / Defense | 3 | $32B |
|
||
| Financial Services | 2 | $176B |
|
||
| Utilities | 2 | $27B |
|
||
| Insurance | 2 | $25B |
|
||
| Technology | 2 | $15B |
|
||
Price history
+20.7% since first listed3 events — show timeline
- 2026-05-21 Listed $175,000 CVRMLS
- 2023-09-01 Sold (Public Records) $135,000 Public Records
- 2019-07-11 Sold (Public Records) $145,000 Public Records
Property tax history
+1.9%/yrLatest (2025): $422 · +13.0% YoY. Source: county tax records.
Cash-flow waterfall
monthlySold comps — $/sqft
last 12 mo · ≤1 miLoading sold comps…