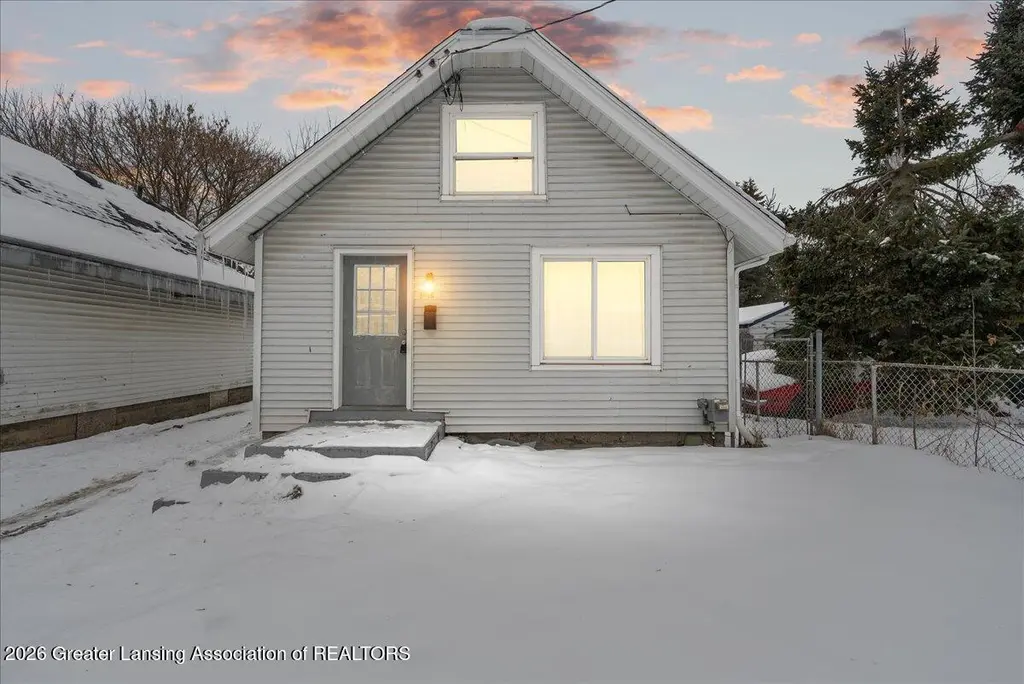
1415 New York Ave · Lansing, MI
Flood risk 1/10 · Minimal
- FEMA flood zone
- X (unshaded)
- Chance of flooding over 30 yrs
- 0.0%
- Est. flood insurance / yr
- $473 – $860
Fire risk 1/10 · Minimal
- Est. fire insurance / yr
- $784 – $1,456
Heat risk 2/10 · Minimal
- Hot days now (above 97°F)
- 7 days/yr
- Hot days in 30 yrs
- 16 days/yr
Wind risk 2/10 · Minimal
- Chance of severe wind over 30 yrs
- —
Air-quality risk 2/10 · Minimal
- Unhealthy air days now
- 1 days/yr
- Unhealthy air days in 30 yrs
- 2 days/yr
Risk factors via First Street. Map © Google.
Why this score? — see what drove the C grade
The composite is a weighted blend of 9 inputs, each scored 0–100. Each bar is that input's sub-score; the figure is the points it added to the 100-point composite (weight × sub-score).
- Cash flow +21.2/30.0
- ARV discount +10.4/15.0
- 1% rule +7.9/10.0
- DSCR +6.8/10.0
- Rent growth +5.0/5.0
- Livability +4.0/5.0
- Condition / age +2.5/5.0
- Schools +1.9/10.0
- Appreciation +0.0/10.0
$100,000
🖨 Deal sheet 📄 Offer letter ✓ Due diligence
Listing remarks MLS
Welcome to 1415 New York Ave in Lansing, a thoughtfully updated home ready for its next chapter. A brand-new roof installed in April 2025, along with a new washer added the same year, provides peace of mind and modern convenience. Fresh interior paint, new carpet, and updated flooring throughout most of the home create a bright and welcoming feel from the moment you step inside.
Key facts
- Updated flooring
- New washer
- New roof
Tags
Neighborhood map
What this means for you Summary
Snapshot
- This is a 3-bed/1.0-bath single-family listed at $100k.
Deal economics
- At list price, monthly cash flow is $145 ($2k/yr) — positive.
- The deal already cash-flows at list — no discount required.
- Meets the 1% rule at list price ($1k rent vs $100k).
- Recommended offer: $91k (9.0% below list) — sets the bar for market timing.
- Cap rate 8.0% vs local median 6.0% in Lansing — top-decile yield for the area; either an underpriced asset or a hidden risk that comps aren't pricing in. Stress-test before assuming the spread holds.
Location & tenants
- Location reads 79/100 on livability (#94 in MI, #2,182 nationally) — a middle-class / working-renter tenant base. Strengths: amenities A+, commute A+, cost of living A+; Watch: employment D, schools F, crime F.
- Lansing Public School District (urban): math 14% / reading 23% proficiency, ranked #650 of 760 in MI (top 86%) — low school quality limits family demand, transient renter base, plan for 1-2y turnover; 68% free/reduced lunch — lower-income household profile, screen leases tightly.
- Market conditions: Rents rising fast (+10.5%/yr); 138 active listings in the ZIP; 6 comparable units currently listed for rent nearby; rentals lingering (median 44d on market — plan ~5-8 weeks vacancy on turnover, expect pricing pressure); 83% of comp listings sitting > 30 days — soft ceiling on asking rent; 350 units permitted in Ingham County in 2024 (186 in 5+ unit buildings).
Forward outlook
- Local home prices are declining (-3.0%/yr); year-one equity from $691 of loan paydown is wiped out by about $3k of value loss. Plan a longer hold.
- Ingham County population projected at +11% by 2050 — modest demand growth; plan on rents tracking national, not racing it.
- At projected returns (-3.0% appreciation + 8.0% rent growth), your $28k cash investment doubles in ~8 years — after that, you're playing with house money.
Negotiation context
- It's been on market 111 days — a 9% lower offer ($91k) is reasonable based on typical stale-listing flexibility.
- 5 sale attempts since 2y ago with the ask held roughly flat each time — persistent listings suggest the price (not the market) is what's stuck; bring a comps-based counter.
Risks & watch-outs
- Watch-outs: property tax is 3.7% of price; built in 1922 — expect roof / HVAC / electrical / plumbing capex.
Questions for the listing agent
- It's been on market 111 days. Have you received any prior offers? Is the seller open to a 9% concession, seller financing, or rate buy-down credit?
- Built in 1922 — when were the roof, HVAC, electrical panel, plumbing, and water heater last replaced?
- Property tax is high relative to price — has the assessment been appealed recently, and will the sale trigger a re-assessment?
- Why hasn't it sold? Are there any deal-killer items the seller is aware of (foundation, flood, title, zoning, code violations)?
- Is there a deadline driving the sale (1031 exchange, divorce, estate, relocation)? That informs how much negotiation room exists.
- Schools are F-rated, which usually means shorter tenancies and higher turnover. Who's the typical renter profile here, and what's been the actual vacancy rate?
- Crime grade is F in this area — have there been break-ins, vandalism, or insurance claims at this property in the last 3 years? What carrier currently insures it and at what premium?
- What's the average days-on-market for RENTAL listings here right now (not sales)? A rising rental-DOM trend means longer vacancies and softer asking-rent achievability than the comps imply.
- What's the recent tenant-quality profile in this submarket — average credit score on applications, eviction rate, late-payment / NSF rate, and stable-employment percentage? A property-management company in the area should have these aggregated.
- How much new for-sale + rental construction is in the pipeline within 1–3 miles? Heavy new supply typically softens prices + rents 12–24 months out; constrained supply supports both.
Investment metrics
- 1% rule
- 1.29% ✓
- Cap rate
- 8.03%
- Cash-on-cash
- 6.20%
- DSCR
- 1.28
- GRM
- 6.5
CMA / ARV
- ARV (median comp)
- $107,004
- List price
- $100,000
- Delta
- -6.55%
- Verdict
- FAIR
- Comps
- 20 within 1.0 mi
Show comp detail 12 sales within ~0.75 mi
| Address | Dist | Beds/Ba | Sqft | Sold | Price | $/sf | Match |
|---|---|---|---|---|---|---|---|
| 1405 Vermont Ave | 0.13mi | 2/1.0 (-1) | 640 (0%) | 10mo | $105,000 | $164 | 81 |
| 1633 Illinois Ave | 0.30mi | 2/1.0 (-1) | 660 (+3%) | 1mo | $90,000 | $136 | 75 |
| 1635 Indiana Ave | 0.39mi | 2/1.0 (-1) | 620 (-3%) | 0mo | $97,500 | $157 | 71 |
| 1312 Otto St | 0.37mi | 2/2.0 (-1) | 652 (+2%) | 1mo | $113,500 | $174 | 70 |
| 1022 Persons Ct | 0.22mi | 2/1.0 (-1) | 714 (+12%) | 0mo | $66,000 | $92 | 65 |
| 1102 Persons Ct | 0.22mi | 3/1.0 | 720 (+12%) | 5mo | $67,500 | $94 | 64 |
| 919 Mahlon St | 0.48mi | 2/1.0 (-1) | 678 (+6%) | 4mo | $96,000 | $142 | 59 |
| 614 Woodbury Ave | 0.49mi | 2/1.0 (-1) | 672 (+5%) | 7mo | $50,000 | $74 | 58 |
| 1107 May St | 0.49mi | 2/1.0 (-1) | 704 (+10%) | 1mo | $89,500 | $127 | 55 |
| 930 Mahlon St | 0.48mi | 2/1.0 (-1) | 704 (+10%) | 3mo | $60,000 | $85 | 53 |
| 1922 Polly Ave | 0.59mi | 3/1.0 | 572 (-11%) | 7mo | $80,000 | $140 | 49 |
| 321 Douglas Ave | 0.74mi | 2/1.0 (-1) | 720 (+12%) | 9mo | $114,900 | $160 | 32 |
Match score weights: distance 35% · size 25% · config 20% · recency 20%. Top-matched comps best support the ARV.
Projected returns pro-forma
-3.0% appreciation · 8.0% rent growth · sell at horizon
- IRR
- -0.0%
- Equity multiple
- 1.00×
- Total profit
- $-37
- Equity at exit
- $14,910
- IRR
- 15.0%
- Equity multiple
- 2.55×
- Total profit
- $43,403
- Equity at exit
- $8,646
Cash invested: $28,000 (down + closing). Projections, not guarantees.
Landlord ↔ Tenant lean methodology
- Overall (STATE)
- 62 Landlord-Friendly
- State Michigan
- 62 Landlord-Friendly · EVEN
- County
- — inherits STATE
- City
- — inherits STATE
ZIP-level market 48906
- Rents YoY
- 10.5%
- Active inventory
- 138
- Price-to-rent
- 6.5×
Monthly cashflow live
- Estimated rent
- $1,290 high interval (Pro) →
- Mortgage (P&I)
- −$524
- Tax from tax record
- −$308 /mo · $3,700/yr
- Insurance
- −$42
- HOA
- −$0
- Vacancy / Maint / Mgmt
- −$271
- Net cashflow
- $145
Break-even live
UW: 25.0% down · 7.5% · 30yr · 1.5% tax · 5.0% vac · 8.0% maint · 8.0% mgmt
Financing live
Cash to close
- Down payment
- $25,000
- Closing costs
- $3,000
- Reserves months
- —
- Total cash needed
- —
Loan-product check · same deal, 3 products live
Conventional
25% down · 7.5% · 30yr
- Down + closing
- —
- Monthly P&I
- —
- Monthly cashflow
- —
- DSCR
- —
- Eligible?
- —
Personal DTI + credit; lowest rate.
DSCR
20% down · 8.5% · 30yr
- Down + closing
- —
- Monthly P&I
- —
- Monthly cashflow
- —
- DSCR
- —
- Eligible?
- —
No personal income docs; deal must DSCR.
Hard money
10% down · 12.0% · 12mo
- Down + closing
- —
- Monthly P&I
- —
- Monthly cashflow
- —
- DSCR
- —
- Eligible?
- —
Short-term bridge; refi at stabilization.
Rent comps 6 comps
| Address | Beds | Baths | Sqft | Rent | $/sqft | DOM | Units | Dist |
|---|---|---|---|---|---|---|---|---|
| 936 N Fairview Ave Lansing, MI | 1.0–2.0 | 1.0 | 825 | $1,245 | $1.51 | 43d | 2 | 0.92mi |
| 1245 Weber Dr Unit 2 Lansing, MI | 2.0 | 1.0 | 700 | $1,250 | $1.79 | 43d | 1 | 1.03mi |
| 1010 N Pine St Unit B Lansing, MI | 2.0 | 1.0 | 750 | $1,100 | $1.47 | 43d | 1 | 1.18mi |
| 427 Seymour Ave Unit 315 Lansing, MI | 2.0 | 1.0 | 550 | $1,300 | $2.36 | 43d | 1 | 1.21mi |
| 427 Seymour Ave Unit 315 Lansing, MI | 2.0 | 1.0 | 550 | $1,300 | $2.36 | 21d | 1 | 1.21mi |
| 504 W Lapeer St Apt A Lansing, MI | 2.0 | 1.0 | 600 | $895 | $1.49 | 43d | 1 | 1.26mi |
Listing history 24 events
-
2026-06-03status $100,000 Pending 111 DOM
-
2026-06-02days on market $100,000 Active Under Contract 111 DOM
-
2026-06-01days on market $100,000 Active Under Contract 110 DOM
-
2026-05-31days on market $100,000 Active Under Contract 109 DOM
-
2026-05-30days on market $100,000 Active Under Contract 108 DOM
-
2026-05-11historical Active Under Contract 381-char remark
Show marketing remark (381 chars)
Welcome to 1415 New York Ave in Lansing, a thoughtfully updated home ready for its next chapter. A brand-new roof installed in April 2025, along with a new washer added the same year, provides peace of mind and modern convenience. Fresh interior paint, new carpet, and updated flooring throughout most of the home create a bright and welcoming feel from the moment you step inside.
-
2026-02-11$100,000 Active 381-char remark
Show marketing remark (381 chars)
Welcome to 1415 New York Ave in Lansing, a thoughtfully updated home ready for its next chapter. A brand-new roof installed in April 2025, along with a new washer added the same year, provides peace of mind and modern convenience. Fresh interior paint, new carpet, and updated flooring throughout most of the home create a bright and welcoming feel from the moment you step inside.
-
2026-02-10historical
-
2025-11-19price $104,900
-
2025-11-19price $104,900
-
2025-10-01price $109,900
-
2025-10-01price $109,900
-
2025-09-08price $114,900
-
2025-09-08price $114,900
-
2025-08-22$119,900 Active
-
2024-08-19soldstatus $94,900
-
2024-08-06soldstatus $94,900
-
2024-08-06soldstatus $94,900 Closed
-
2024-07-02$94,900
-
2024-07-02$94,900 Active
-
2022-02-11soldstatus $205,000
-
2006-12-29soldstatus $82,500
ⓘ Source: listings_history table (triggers on properties + properties_extension) + one-shot
backfill from property_details.listing_events for pre-trigger history.
Tax reassessment forecast MI · Partial reset (capped growth)
- Current annual tax
- $3,700 · $308/mo
- Projected year-2 tax
- $3,700 · $308/mo
- Expected delta
- $0/yr ($0/mo · 0.0%)
ⓘ Screening estimate from a state-policy table — verify with the county assessor before closing.
Climate risk First Street
- Flood 1/10 Low FEMA zone X (unshaded) · 0% chance over 30 yrs
- Wildfire 1/10 Low
- Heat 2/10 Low 7 d/yr ≥97°F today · 16 d/yr by 30 yrs out
- Wind 2/10 Low
- Air quality 2/10 Low 1 unhealthy d/yr today · 2 by 30 yrs out
Nearby sold comps map
Loading sold comps map…
Walkable amenities ~0.75 mi
Loading nearby amenities…
Taxation est. · year 1
- Rental income
- $15,481
- − Mortgage interest
- −$5,602
- − Property taxes
- −$3,700
- − Insurance
- −$500
- − Repairs & maintenance
- −$1,238
- − Management
- −$1,238
- − Depreciation
- −$2,909
- Taxable income
- $293
- Est. tax owed @ 24.0%
- −$70
- After-tax cash flow
- $1,666/yr
For passive investors: Depreciation is non-cash, so a rental often shows a tax loss while cash-flowing — sheltering income. Rental losses are passive: they offset passive income freely, and up to $25,000/yr can offset ordinary (W-2) income if you actively participate and your MAGI is under $100k (phasing out to $0 by $150k); unused losses carry forward. On sale, claimed depreciation is recaptured at up to 25%, and gains may owe capital-gains tax (a 1031 exchange can defer both). Figures are a year-1 estimate at your 24.0% rate — not tax advice; consult a CPA.
Schools (NCES district)
- District
- Lansing Public School District
- NCES district ID
- 2621150
- Math proficiency
- 14% ▲ 1.00%
- Reading proficiency
- 23% ▲ 3.00%
- Median HH income
- $37,453
- Composite
- 18.76/100
- National rank
- #14002
- State rank
- #650 of 760 in MI
Livability — Lansing
- Score
- 79/100
- State rank
- #94
- US rank
- #2182
Category grades
Schools grade is shown separately in the Schools card above.
Census & demographics
- Census place
- Lansing, MI
- County
- Ingham County · 237,052 people
- City population
- 161,269
- Metro
- Lansing-East Lansing, MI
- Population (ZIP)
- 25,901
- Household income
- $64,315
- Rent vs Own
- Severe rent burden
- 851.0
Population outlook (Ingham County) Hauer SSP2
- Today (2025)
- 300,362 people
- By 2030
- 307,808 · +2.5%
- By 2040
- 320,492 · +6.7%
- By 2050
- 333,223 · +10.9%
- By 2075
- 373,693 · +24.4%
- By 2100
- 392,021 · +30.5%
Race, ethnicity, and origin ACS 2023
- Neighborhood character
- Diverse neighborhood (Simpson 0.56)
- Race & ethnicity
- White 64% Black 15% Two or more races 12% Hispanic / Latino 12% Asian 2%
- Hispanic origin (detail)
- Mexican 9%
- Common ancestry
- Romanian 3% Lithuanian 2% Iranian 2%
- Foreign-born
- 6% · Canada, China
- Languages at home
- 88% English-only · Spanish 5% Other Asian/Pacific 1% French/Haitian/Cajun 1%
Political lean MEDSL · Ingham
- 2024 margin
- Strong D (+29.7) · D 63.9% · R 34.2% · Other 2.0%
- 2008→2024 swing
- -3.6pp toward R · 2008: 33.3pp · 2024: 29.7pp
- All cycles
- 2024: D+29.7 2020: D+32.2 2016: D+27.6 2012: D+27.9 2008: D+33.3
Not yet ingested
- Civics
- —
Market trends
- HPI YoY
- ▼ -135.54%
- Current HPI
- 228.7023
- Rent YoY
- ▲ 10.50%
- Metro
- Lansing-East Lansing, MI
- State GDP YoY
- ▲ 1.37%
- F500 in state
- 28
Industry mix (Fortune 500 HQ in MI)
| Industry | F500 HQs | Revenue |
|---|---|---|
| Automotive Parts | 3 | $48B |
|
||
| Automotive | 2 | $372B |
|
||
| Chemicals | 1 | $45B |
|
||
| Automotive Retail | 1 | $29B |
|
||
| Healthcare / Medical Devices | 1 | $23B |
|
||
| Automotive Technology | 1 | $20B |
|
||
Price history
+21.2% since first listed19 events — show timeline
- 2026-05-11 Contingent — REALCOMP
- 2026-05-11 Contingent — Greater Lansing AoR
- 2026-02-11 Listed $100,000 REALCOMP
- 2026-02-11 Listed $100,000 Greater Lansing AoR
- 2026-02-10 Listing Removed — REALCOMP
- 2025-11-19 Price Changed $104,900 REALCOMP
- 2025-11-19 Price Changed $104,900 Greater Lansing AoR
- 2025-10-01 Price Changed $109,900 REALCOMP
- 2025-10-01 Price Changed $109,900 Greater Lansing AoR
- 2025-09-08 Price Changed $114,900 REALCOMP
- 2025-09-08 Price Changed $114,900 Greater Lansing AoR
- 2025-08-22 Listed $119,900 REALCOMP
- 2024-08-19 Sold (Public Records) $94,900 Public Records
- 2024-08-06 Sold (MLS) $94,900 Greater Lansing AoR
- 2024-08-06 Sold (MLS) $94,900 REALCOMP
- 2024-07-02 Listed $94,900 Greater Lansing AoR
- 2024-07-02 Listed $94,900 REALCOMP
- 2022-02-11 Sold (Public Records) $205,000 Public Records
- 2006-12-29 Sold (Public Records) $82,500 Public Records
Property tax history
+4.8%/yrLatest (2025): $3,700 · +24.6% YoY. Source: county tax records.
Cash-flow waterfall
monthlySold comps — $/sqft
last 12 mo · ≤1 miLoading sold comps…