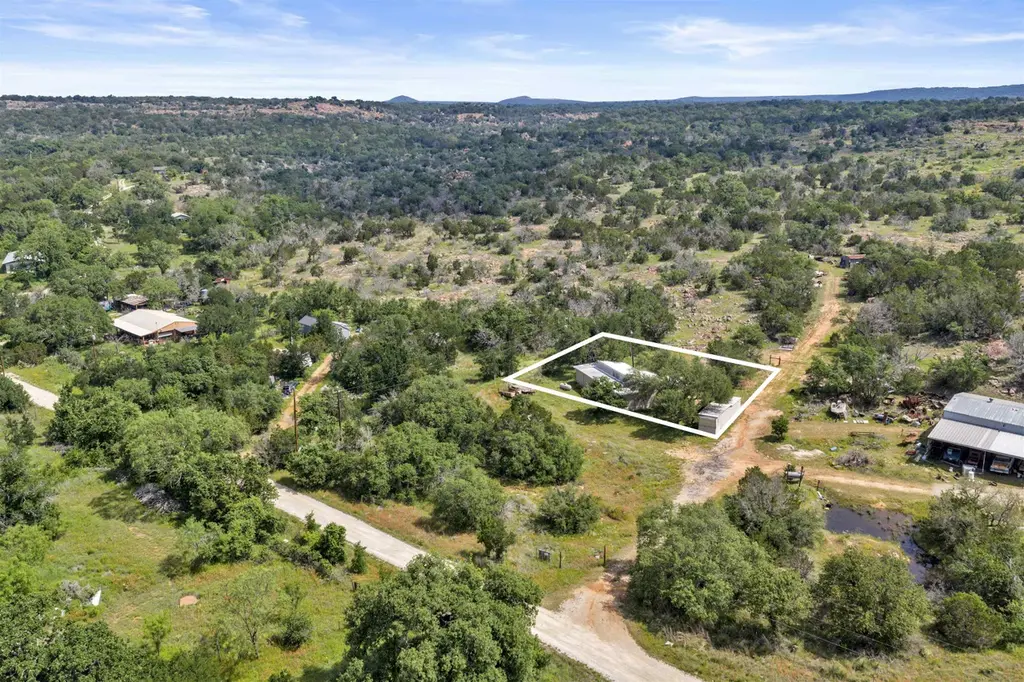
112 Mica Dr · Burnet, TX
Flood risk 1/10 · Minimal
- FEMA flood zone
- X (unshaded)
- Chance of flooding over 30 yrs
- 0.0%
- Est. flood insurance / yr
- $507 – $1,088
Fire risk 5/10 · Moderate
- Est. fire insurance / yr
- $1,222 – $2,270
Heat risk 7/10 · Major
- Hot days now (above 104°F)
- 7 days/yr
- Hot days in 30 yrs
- 23 days/yr
Wind risk 6/10 · Moderate
- Chance of severe wind over 30 yrs
- 45.0%
Air-quality risk 1/10 · Minimal
- Unhealthy air days now
- 0 days/yr
- Unhealthy air days in 30 yrs
- 0 days/yr
Risk factors via First Street. Map © Google.
Why this score? — see what drove the B+ grade
The composite is a weighted blend of 9 inputs, each scored 0–100. Each bar is that input's sub-score; the figure is the points it added to the 100-point composite (weight × sub-score).
- Cash flow +30.0/30.0
- ARV discount +14.6/15.0
- 1% rule +10.0/10.0
- DSCR +10.0/10.0
- Livability +3.8/5.0
- Schools +3.2/10.0
- Rent growth +2.5/5.0
- Condition / age +2.5/5.0
- Appreciation +0.0/10.0
$80,000
🖨 Deal sheet (PDF) 📄 Offer letter ✓ Due diligence
Listing remarks
Hidden away in the Creek Hills subdivision Is this Hidden Gem. A livable mobile with additions for the price of the lot with 2 bedrooms two full baths on . 22 acres this starter home will give you years of use. Then Upgrade it to a newer mobile or build your dream home. This is also a great rental investment property if you're looking to get into the rental business. Don't let this one get away. Priced to sell quickly don't hesitate call for a showing appointment today.
Key facts
- 9,583 sq ft lot
- Listed 21 days
Property features AI
Finance
- Other: Lot dimensions approximately 101 x 120 x 81.9 x 95.4 (0.22 acres); Subdivision: Spring Crk Hill
Exterior
- Utilities: Private well water; Septic tank sewer
- Home design: Manufactured home on land; Single-story
- Construction: Composition roof
- Exterior features: Barbed wire fencing; Cleared lot
Interior
- Kitchen: Electric range; Refrigerator
- Flooring: Vinyl
- Bathrooms: 2 full bathrooms
- Heating & cooling: Wall furnace heating; Wall/window air conditioning units
- Interior features: Electric water heater; Vinyl flooring
- Laundry & utility: Laundry room with washer hookup and electric dryer hookup
Neighborhood map
What this means for you Summary
Snapshot
- This is a 2-bed/2.0-bath manufactured listed at $80k.
Deal economics
- At list price, monthly cash flow is $557 ($7k/yr) — positive.
- The deal already cash-flows at list — no discount required.
- Meets the 1% rule at list price ($1k rent vs $80k).
- Recommended offer: $79k (1.5% below list) — sets the bar for market timing.
- Cap rate 14.6% vs local median 2.7% in Burnet — top-decile yield for the area; either an underpriced asset or a hidden risk that comps aren't pricing in. Stress-test before assuming the spread holds.
Location & tenants
- Location reads 76/100 on livability (#101 in TX, #3,384 nationally) — a middle-class / working-renter tenant base. Strengths: crime A+, cost of living A+, housing A+; Watch: schools F, amenities F, commute F.
- Burnet CISD (rural): math 36% / reading 38% proficiency, ranked #465 of 826 in TX (top 56%) — families likely to look elsewhere, expect single-tenant / working-renter base with shorter leases.
- Market conditions: 554 active listings in the ZIP; solid renter incomes; 891 units permitted in Burnet County in 2024 (76 in 5+ unit buildings).
Forward outlook
- Local home prices are declining (-3.0%/yr); year-one equity from $553 of loan paydown is wiped out by about $2k of value loss. Plan a longer hold.
- Burnet County population projected at +22% by 2050 — long-run rental-demand tailwind backs the buy-and-hold thesis.
- At projected returns (-3.0% appreciation + 3.0% rent growth), your $22k cash investment doubles in ~5 years — after that, you're playing with house money.
Negotiation context
- It's been on market 21 days — a 2% lower offer ($79k) is reasonable based on typical stale-listing flexibility.
- 2 sale attempts with the ask held roughly flat each time — persistent listings suggest the price (not the market) is what's stuck; bring a comps-based counter.
Risks & watch-outs
- Climate carrying-cost: major wind risk, 45% chance of damaging wind over 30y; moderate wildfire risk; extreme-heat days projected 7→23/yr by 2055 (HVAC capex compounding) — expect insurance premiums to compound above CPI over the hold.
Questions for the listing agent
- Is there a deadline driving the sale (1031 exchange, divorce, estate, relocation)? That informs how much negotiation room exists.
- Schools are F-rated, which usually means shorter tenancies and higher turnover. Who's the typical renter profile here, and what's been the actual vacancy rate?
- What's the average days-on-market for RENTAL listings here right now (not sales)? A rising rental-DOM trend means longer vacancies and softer asking-rent achievability than the comps imply.
- What's the recent tenant-quality profile in this submarket — average credit score on applications, eviction rate, late-payment / NSF rate, and stable-employment percentage? A property-management company in the area should have these aggregated.
- How much new for-sale + rental construction is in the pipeline within 1–3 miles? Heavy new supply typically softens prices + rents 12–24 months out; constrained supply supports both.
Investment metrics
- 1% rule
- 1.63% ✓
- Cap rate
- 14.65%
- Cash-on-cash
- 29.84%
- DSCR
- 2.33
- GRM
- 5.1
CMA / ARV
- ARV (median comp)
- $95,000
- List price
- $80,000
- Delta
- -15.79%
- Verdict
- UNDERPRICED
- Comps
- 1 within 2.0 mi
Projected returns pro-forma
-3.0% appreciation · 3.0% rent growth · sell at horizon
- IRR
- 24.4%
- Equity multiple
- 2.00×
- Total profit
- $22,479
- Equity at exit
- $11,928
- IRR
- 32.2%
- Equity multiple
- 3.91×
- Total profit
- $65,134
- Equity at exit
- $6,917
Cash invested: $22,400 (down + closing). Projections, not guarantees.
Landlord ↔ Tenant lean methodology
- Overall (STATE)
- 87 Strongly Landlord-Friendly
- State Texas
- 87 Strongly Landlord-Friendly · R+5
- County
- — inherits STATE
- City
- — inherits STATE
ZIP-level market 78611
- Home prices YoY
- -24.7%
- Active inventory
- 554
- Price-to-rent
- 5.1×
Monthly cashflow live
- Estimated rent
- $1,306 medium interval (Pro) →
- Mortgage (P&I)
- −$420
- Tax from tax record
- −$22 /mo · $264/yr
- Insurance
- −$33
- HOA
- −$0
- Vacancy / Maint / Mgmt
- −$274
- Net cashflow
- $557
Break-even live
Sensitivity live
| Price | -10% $602 | -5% $580 | +0% $557 | +5% $534 | +10% $512 |
|---|---|---|---|---|---|
| Rent | -10% $454 | -5% $505 | +0% $557 | +5% $609 | +10% $660 |
| Rate | -1.0pp $597 | -0.5pp $577 | base $557 | +0.5pp $536 | +1.0pp $515 |
UW: 25.0% down · 7.5% · 30yr · 1.5% tax · 5.0% vac · 8.0% maint · 8.0% mgmt
Financing live
Cash to close
- Down payment
- $20,000
- Closing costs
- $2,400
- Reserves months
- —
- Total cash needed
- —
Loan-product check · same deal, 3 products live
Conventional
25% down · 7.5% · 30yr
- Down + closing
- —
- Monthly P&I
- —
- Monthly cashflow
- —
- DSCR
- —
- Eligible?
- —
Personal DTI + credit; lowest rate.
DSCR
20% down · 8.5% · 30yr
- Down + closing
- —
- Monthly P&I
- —
- Monthly cashflow
- —
- DSCR
- —
- Eligible?
- —
No personal income docs; deal must DSCR.
Hard money
10% down · 12.0% · 12mo
- Down + closing
- —
- Monthly P&I
- —
- Monthly cashflow
- —
- DSCR
- —
- Eligible?
- —
Short-term bridge; refi at stabilization.
Listing history 3 events
-
2026-04-23$80,000 Active 474-char remark
-
2024-05-01soldstatus
-
1996-12-20soldstatus
ⓘ Source: listings_history table (triggers on properties + properties_extension) + one-shot
backfill from property_details.listing_events for pre-trigger history.
Tax reassessment forecast TX · Resets to sale price
- Current annual tax
- $264 · $22/mo
- Projected year-2 tax
- $1,464 · $122/mo
- Expected delta
- +$1,200/yr (+$100/mo · 455.1%)
ⓘ Screening estimate from a state-policy table — verify with the county assessor before closing.
Climate risk First Street
- Flood 1/10 Low FEMA zone X (unshaded) · 0% chance over 30 yrs
- Wildfire 5/10 Major
- Heat 7/10 Severe 7 d/yr ≥104°F today · 23 d/yr by 30 yrs out
- Wind 6/10 Major 45% chance of damaging wind over 30 yrs
- Air quality 1/10 Low 0 unhealthy d/yr today · 0 by 30 yrs out
Nearby sold comps map
Loading sold comps map…
Walkable amenities ~0.75 mi
Loading nearby amenities…
Taxation est. · year 1
- Rental income
- $15,672
- − Mortgage interest
- −$4,481
- − Property taxes
- −$264
- − Insurance
- −$400
- − Repairs & maintenance
- −$1,254
- − Management
- −$1,254
- − Depreciation
- −$2,327
- Taxable income
- $5,693
- Est. tax owed @ 24.0%
- −$1,366
- After-tax cash flow
- $5,317/yr
For passive investors: Depreciation is non-cash, so a rental often shows a tax loss while cash-flowing — sheltering income. Rental losses are passive: they offset passive income freely, and up to $25,000/yr can offset ordinary (W-2) income if you actively participate and your MAGI is under $100k (phasing out to $0 by $150k); unused losses carry forward. On sale, claimed depreciation is recaptured at up to 25%, and gains may owe capital-gains tax (a 1031 exchange can defer both). Figures are a year-1 estimate at your 24.0% rate — not tax advice; consult a CPA.
Schools (NCES district)
- District
- Burnet CISD
- NCES district ID
- 4812220
- Math proficiency
- 36% ▼ -3.00%
- Reading proficiency
- 38% ▬ 0.00%
- Median HH income
- $50,890
- Composite
- 32.09/100
- National rank
- #5811
- State rank
- #465 of 826 in TX
Livability — Burnet
- Score
- 76/100
- State rank
- #101
- US rank
- #3384
Category grades
Schools grade is shown separately in the Schools card above.
Census & demographics
- County
- Burnet County · 35,210 people
- City population
- 14,560
- Metro
- nan
- Population (ZIP)
- 14,560
- Household income
- $80,938
- Rent vs Own
- Severe rent burden
- 218.0
Population outlook (Burnet County) Hauer SSP2
- Today (2025)
- 50,492 people
- By 2030
- 52,995 · +5.0%
- By 2040
- 57,528 · +13.9%
- By 2050
- 61,444 · +21.7%
- By 2075
- 71,098 · +40.8%
- By 2100
- 74,634 · +47.8%
Race, ethnicity, and origin ACS 2023
- Neighborhood character
- Predominantly White (76%)
- Race & ethnicity
- White 76% Hispanic / Latino 16% Two or more races 9% Black 3%
- Hispanic origin (detail)
- Mexican 13%
- Common ancestry
- Italian 4% Slovak 3% Serbian 2%
- Foreign-born
- 6% · Canada, Vietnam
- Languages at home
- 91% English-only · Spanish 8% Vietnamese 1%
Political lean MEDSL · Burnet
- 2024 margin
- Solid R (+55.7) · D 21.7% · R 77.4%
- 2008→2024 swing
- -11.6pp toward R · 2008: -44.1pp · 2024: -55.7pp
- All cycles
- 2024: R+55.7 2020: R+53.1 2016: R+56.8 2012: R+54.6 2008: R+44.1
Not yet ingested
- Civics
- —
Market trends
- HPI YoY
- ▼ -83.25%
- Current HPI
- 253.5299
- Rent YoY
- —
- Metro
- nan
- State GDP YoY
- ▲ 3.95%
- F500 in state
- 110
Industry mix (Fortune 500 HQ in TX)
| Industry | F500 HQs | Revenue |
|---|---|---|
| Energy | 16 | $1,198B |
|
||
| Technology | 5 | $198B |
|
||
| Engineering / Construction | 4 | $72B |
|
||
| Energy Services | 3 | $60B |
|
||
| Utilities | 3 | $41B |
|
||
| Healthcare | 2 | $330B |
|
||
Price history
6 events — show timeline
- 2026-05-25 Pending — HLMLS as distributed by MLS GRID
- 2026-05-25 Relisted — HLMLS as distributed by MLS GRID
- 2026-05-21 Pending — HLMLS as distributed by MLS GRID
- 2026-04-23 Listed $80,000 HLMLS as distributed by MLS GRID
- 2024-05-01 Sold (Public Records) — Public Records
- 1996-12-20 Sold (Public Records) — Public Records
Property tax history
+9.1%/yrLatest (2026): $264 · +0.0% YoY. Source: county tax records.
Cash-flow waterfall
monthlySold comps — $/sqft
last 12 mo · ≤1 miLoading sold comps…