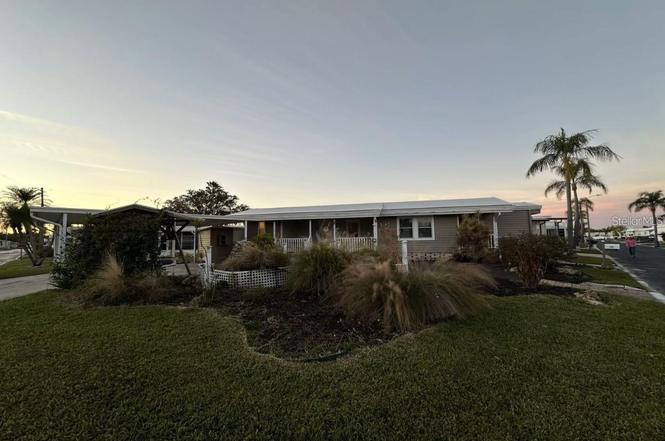
120 Oriole Rd · Largo, FL
Flood risk 6/10 · Moderate
- FEMA flood zone
- X (unshaded)
- Chance of flooding over 30 yrs
- 0.66%
- Est. flood insurance / yr
- $507 – $1,088
Fire risk 1/10 · Minimal
- Est. fire insurance / yr
- $947 – $1,759
Heat risk 10/10 · Severe
- Hot days now (above 107°F)
- 6 days/yr
- Hot days in 30 yrs
- 22 days/yr
Wind risk 10/10 · Severe
- Chance of severe wind over 30 yrs
- 99.0%
Air-quality risk 3/10 · Minor
- Unhealthy air days now
- 3 days/yr
- Unhealthy air days in 30 yrs
- 3 days/yr
Risk factors via First Street. Map © Google.
Why this score? — see what drove the B- grade
The composite is a weighted blend of 9 inputs, each scored 0–100. Each bar is that input's sub-score; the figure is the points it added to the 100-point composite (weight × sub-score).
- Cash flow +30.0/30.0
- 1% rule +10.0/10.0
- DSCR +10.0/10.0
- ARV discount +7.5/15.0
- Schools +4.3/10.0
- Livability +4.1/5.0
- Condition / age +2.5/5.0
- Rent growth +1.2/5.0
- Appreciation +0.0/10.0
$98,000
🖨 Deal sheet 📄 Offer letter ✓ Due diligence
Listing remarks
Don’t miss this incredible opportunity to own a ranch-style 2-Bed, 2-Bath mobile home in a welcoming 55+ community! Situated on a beautiful corner lot, this home boasts the only Koi pond in the park, adding a serene touch to your outdoor space. With lot ownership included and a low monthly fee of $155, this is a rare find. The home remained dry during storms, with only minor past water exposure in the shed. The seller is highly motivated, so submit your highest and best offer today! The association is easy to work with, though an application is required. Being sold as-is—act fast before it’s gone!
Key facts
- Koi pond
- Corner lot
- 4,800 sq ft lot
Tags
Property features AI
Finance
- Other: No lease restrictions indicated
- Financial info: Total annual fees: $1,860; Unfurnished
- HOA & community: Ranch Mobile association (monthly fee required); Monthly HOA: $155; Senior community; Pets allowed
Exterior
- Utilities: Public water; Public sewer; Electricity connected; Water connected
- Home design: Residential mobile home; Double wide; Single-story; Faces east; Entry level: One
- Construction: Metal frame construction; Pillar/Post/Pier foundation; Other roof type; Built as a double wide mobile home
- Exterior features: Sidewalk
Interior
- Kitchen: Dishwasher; Range; Refrigerator
- Bedrooms: 2 bedrooms
- Flooring: Laminate flooring
- Bathrooms: 2 full bathrooms
- Heating & cooling: Central heating; Central air conditioning
- Interior features: Other interior features
- Laundry & utility: Washer; Dryer; No dedicated laundry room listed
Neighborhood map
What this means for you Summary
Snapshot
- This is a 2-bed/1.0-bath manufactured listed at $98k.
Deal economics
- At list price, monthly cash flow is $749 ($9k/yr) — positive.
- The deal already cash-flows at list — no discount required.
- Meets the 1% rule at list price ($2k rent vs $98k).
- Recommended offer: $86k (12.0% below list) — sets the bar for market timing.
- Cap rate 15.5% vs local median 4.2% in Largo — top-decile yield for the area; either an underpriced asset or a hidden risk that comps aren't pricing in. Stress-test before assuming the spread holds.
Location & tenants
- Location reads 82/100 on livability (#82 in FL, #1,240 nationally) — a professional / high-income tenant draw. Strengths: commute A+, cost of living A+, housing A+; Watch: employment D+, amenities F.
- Pinellas (suburban): math 51% / reading 51% proficiency, ranked #31 of 73 in FL (top 42%) — acceptable for families but not a draw, mixed tenant base, ~2y average lease.
- Market conditions: Rents falling (-5.2%/yr); 261 active listings in the ZIP; 40 comparable units currently listed for rent nearby; rentals leasing fast (median 11d on market — plan ~1-2 weeks tenant-placement turnaround); 2,676 units permitted in Pinellas County in 2024 (1,422 in 5+ unit buildings).
- This rent runs 34% of the median local income ($67k/yr) — at the standard rent-burdened threshold; future hikes will face affordability resistance.
Forward outlook
- Local home prices are declining (-3.0%/yr); year-one equity from $678 of loan paydown is wiped out by about $3k of value loss. Plan a longer hold.
- Pinellas County population projected at +14% by 2050 — modest demand growth; plan on rents tracking national, not racing it.
- At projected returns (-3.0% appreciation + 0.0% rent growth), your $27k cash investment doubles in ~5 years — after that, you're playing with house money.
Negotiation context
- It's been on market 146 days — a 12% lower offer ($86k) is reasonable based on typical stale-listing flexibility.
- 2 sale attempts; this cycle's ask has dropped $12k (11%) from the opening price — seller is motivated, your offer sets the floor, not the list.
- Current owner paid $30k; list at $98k implies a 227% gain — meaningful room to come down on a strong offer.
Risks & watch-outs
- Climate carrying-cost: major flood risk; severe wind risk, 99% chance of damaging wind over 30y; extreme-heat days projected 6→22/yr by 2055 (HVAC capex compounding) — expect insurance premiums to compound above CPI over the hold.
Questions for the listing agent
- It's been on market 146 days. Have you received any prior offers? Is the seller open to a 12% concession, seller financing, or rate buy-down credit?
- Built in 1965 — when were the roof, HVAC, electrical panel, plumbing, and water heater last replaced?
- What does the HOA fee cover, when was the last increase, and are there any pending special assessments or reserve-fund shortfalls?
- Why hasn't it sold? Are there any deal-killer items the seller is aware of (foundation, flood, title, zoning, code violations)?
- Is there a deadline driving the sale (1031 exchange, divorce, estate, relocation)? That informs how much negotiation room exists.
- What's the average days-on-market for RENTAL listings here right now (not sales)? A rising rental-DOM trend means longer vacancies and softer asking-rent achievability than the comps imply.
- What's the recent tenant-quality profile in this submarket — average credit score on applications, eviction rate, late-payment / NSF rate, and stable-employment percentage? A property-management company in the area should have these aggregated.
- How much new for-sale + rental construction is in the pipeline within 1–3 miles? Heavy new supply typically softens prices + rents 12–24 months out; constrained supply supports both.
Investment metrics
- 1% rule
- 1.92% ✓
- Cap rate
- 15.46%
- Cash-on-cash
- 32.73%
- DSCR
- 2.46
- GRM
- 4.3
CMA / ARV
No comps found within radius.
Projected returns pro-forma
-3.0% appreciation · 0.0% rent growth · sell at horizon
- IRR
- 24.3%
- Equity multiple
- 1.96×
- Total profit
- $26,334
- Equity at exit
- $14,612
- IRR
- 30.1%
- Equity multiple
- 3.30×
- Total profit
- $63,237
- Equity at exit
- $8,473
Cash invested: $27,440 (down + closing). Projections, not guarantees.
Landlord ↔ Tenant lean methodology
- Overall (STATE)
- 87 Strongly Landlord-Friendly
- State Florida
- 87 Strongly Landlord-Friendly · R+3
- County
- — inherits STATE
- City
- — inherits STATE
ZIP-level market 33764
- Rents YoY
- -5.2%
- Active inventory
- 261
- Price-to-rent
- 4.3×
Monthly cashflow live
- Estimated rent
- $1,886 high interval (Pro) →
- Mortgage (P&I)
- −$514
- Tax from tax record
- −$31 /mo · $376/yr
- Insurance
- −$41
- HOA
- −$155
- Vacancy / Maint / Mgmt
- −$396
- Net cashflow
- $749
Break-even live
UW: 25.0% down · 7.5% · 30yr · 1.5% tax · 5.0% vac · 8.0% maint · 8.0% mgmt
Financing live
Cash to close
- Down payment
- $24,500
- Closing costs
- $2,940
- Reserves months
- —
- Total cash needed
- —
Loan-product check · same deal, 3 products live
Conventional
25% down · 7.5% · 30yr
- Down + closing
- —
- Monthly P&I
- —
- Monthly cashflow
- —
- DSCR
- —
- Eligible?
- —
Personal DTI + credit; lowest rate.
DSCR
20% down · 8.5% · 30yr
- Down + closing
- —
- Monthly P&I
- —
- Monthly cashflow
- —
- DSCR
- —
- Eligible?
- —
No personal income docs; deal must DSCR.
Hard money
10% down · 12.0% · 12mo
- Down + closing
- —
- Monthly P&I
- —
- Monthly cashflow
- —
- DSCR
- —
- Eligible?
- —
Short-term bridge; refi at stabilization.
Rent comps 40 comps
| Address | Beds | Baths | Sqft | Rent | $/sqft | DOM | Units | Dist |
|---|---|---|---|---|---|---|---|---|
| 7001 142nd Ave Largo, FL | 2.0 | 2.0 | 1100 | $1,700 | $1.55 | 24d | 1 | 0.31mi |
| 19137 US Highway 19 N Unit 2 Clearwater, FL | 2.0 | 2.0 | 1062 | $1,738 | $1.64 | 24d | 1 | 0.34mi |
| 7001 142nd Ave N Lot 179 Largo, FL | 2.0 | 2.0 | 1100 | $2,495 | $2.27 | 17d | 1 | 0.41mi |
| 14603 64th St N Clearwater, FL | 3.0 | 2.0 | 1080 | $1,900 | $1.76 | 4d | 1 | 0.43mi |
| 7001 142nd Ave N #157 Largo, FL | 2.0 | 1.0 | 800 | $1,795 | $2.24 | 18d | 1 | 0.45mi |
| 6430 142nd Ave N Clearwater, FL | 1.0–3.0 | 1.0–2.0 | 1216 | $2,860 | $2.35 | 2d | 68 | 0.58mi |
| 6262 142nd Ave N Clearwater, FL | 2.0 | 1.5–2.0 | 1183 | $1,725 | $1.46 | 24d | 2 | 0.72mi |
| 13500 Rodgers Ave Largo, FL | 1.0 | 1.0 | 700 | $1,474 | $2.11 | 2d | 5 | 0.77mi |
| 305 Glades Cir Largo, FL | 1.0–3.0 | 1.0–1.5 | 875 | $1,563 | $1.79 | 2d | 34 | 0.80mi |
| 4215 E Bay Dr Clearwater, FL | 1.0 | 1.0 | 575 | $1,775 | $3.09 | 18d | 3 | 0.90mi |
| 4215 E Bay Dr Clearwater, FL | 1.0 | 1.0 | 535 | $2,300 | $4.30 | 8d | 4 | 0.90mi |
| 4500 E Bay Dr #138 Clearwater, FL | 2.0 | 2.0 | 1050 | $1,350 | $1.29 | 24d | 1 | 0.96mi |
| 4500 E Bay Dr #149 Clearwater, FL | 2.0 | 2.0 | 1050 | $1,850 | $1.76 | 24d | 1 | 0.96mi |
| 2770 Roosevelt Blvd Clearwater, FL | 1.0–2.0 | 1.0 | 795 | $1,636 | $2.06 | 15d | 10 | 0.97mi |
| 15648 Morgan St Unit B Clearwater, FL | 2.0 | 1.0 | 825 | $1,595 | $1.93 | 11d | 1 | 1.03mi |
| 14330 58th St N Clearwater, FL | 1.0–3.0 | 1.0–2.0 | 1161 | $2,212 | $1.90 | 2d | 19 | 1.03mi |
| 16485 US Highway 19 N Clearwater, FL | 3.0 | 1.0–2.0 | 984 | $3,006 | $3.06 | 18d | 100 | 1.08mi |
| 16485 US Highway 19 N Clearwater, FL | 3.0 | 1.0–2.0 | 984 | $2,877 | $2.92 | 2d | 249 | 1.08mi |
| 500 Belcher Rd S #18 Largo, FL | 1.0 | 1.0 | 637 | $1,500 | $2.35 | 3d | 1 | 1.12mi |
| 7298 Ulmerton Rd Largo, FL | 1.0–3.0 | 1.0–2.0 | 977 | $1,750 | $1.79 | 18d | 4 | 1.12mi |
| 7298 Ulmerton Rd Largo, FL | 1.0–2.0 | 1.0–2.0 | 755 | $1,750 | $2.32 | 3d | 3 | 1.12mi |
| 7298 Ulmerton Rd Largo, FL | 1.0–2.0 | 1.0–2.0 | 755 | $1,750 | $2.32 | 2d | 4 | 1.12mi |
| 3736 141st Pl Largo, FL | 2.0 | 1.0 | 805 | $1,650 | $2.05 | 24d | 1 | 1.15mi |
| 15301 58th St N Unit A Clearwater, FL | 2.0 | 2.0 | 1000 | $1,900 | $1.90 | 17d | 1 | 1.15mi |
| 3767 138th Ave N Unit B Largo, FL | 2.0 | 1.0 | 780 | $1,495 | $1.92 | 2d | 1 | 1.22mi |
| 7360 Ulmerton Rd Unit 3C Largo, FL | 1.0 | 1.0 | 846 | $1,599 | $1.89 | 24d | 1 | 1.25mi |
| 7360 Ulmerton Rd Unit 3C Largo, FL | 1.0 | 1.0 | 846 | $1,498 | $1.77 | 8d | 1 | 1.25mi |
| 3718 138th Ave N Unit 2 Largo, FL | 2.0 | 1.0 | 750 | $1,500 | $2.00 | 24d | 1 | 1.26mi |
| 1601 Palm Way Largo, FL | 3.0 | 1.0 | 1084 | $1,950 | $1.80 | 24d | 1 | 1.26mi |
| 12700 66th St Largo, FL | 1.0–3.0 | 1.0–2.0 | 1105 | $2,191 | $1.98 | 2d | 20 | 1.27mi |
| 779 34th St SE Unit 1319966P Largo, FL | 2.0 | 1.0 | 990 | $2,941 | $2.97 | 8d | 1 | 1.29mi |
| 15414 Avalon Ave Unit 2 Clearwater, FL | 2.0 | 1.0 | 830 | $1,700 | $2.05 | 4d | 1 | 1.32mi |
| 15406 Avalon Ave Unit 3 Clearwater, FL | 2.0 | 1.0 | 850 | $1,650 | $1.94 | 3d | 1 | 1.32mi |
| 15406 Avalon Ave Unit 4 Clearwater, FL | 2.0 | 1.0 | 850 | $1,800 | $2.12 | 4d | 1 | 1.32mi |
| 15000 Westminister Ave Unit A Clearwater, FL | 2.0 | 1.0 | 840 | $1,300 | $1.55 | 24d | 1 | 1.34mi |
| 15616 Avalon Ave #1 Clearwater, FL | 2.0 | 1.0 | 804 | $1,595 | $1.98 | 2d | 1 | 1.35mi |
| 15616 Avalon Ave #1 Clearwater, FL | 2.0 | 1.0 | 850 | $1,525 | $1.79 | 3d | 1 | 1.35mi |
| 15616 Avalon Ave Unit 2 Clearwater, FL | 2.0 | 1.0 | 804 | $1,595 | $1.98 | 14d | 1 | 1.35mi |
| 15616 Avalon Ave Unit 2 Clearwater, FL | 2.0 | 1.0 | 804 | $1,595 | $1.98 | 4d | 1 | 1.35mi |
| 3331 Whispering Dr N Largo, FL | 2.0 | 2.0 | 1053 | $2,190 | $2.08 | 24d | 1 | 1.37mi |
HOA detail
- Monthly dues
- $155 · $1,860/yr
- Likely covers
- water
Listing history 24 events
-
2026-06-18days on market $98,000 Active 146 DOM
-
2026-06-17days on market $98,000 Active 145 DOM
-
2026-06-16days on market $98,000 Active 144 DOM
-
2026-06-15days on market $98,000 Active 143 DOM
-
2026-06-13days on market $98,000 Active 141 DOM
-
2026-06-09days on market $98,000 Active 137 DOM
-
2026-06-08days on market $98,000 Active 136 DOM
-
2026-06-07days on market $98,000 Active 135 DOM
-
2026-06-04days on market $98,000 Active 132 DOM
-
2026-06-03days on market $98,000 Active 131 DOM
-
2026-06-01days on market $98,000 Active 129 DOM
-
2026-05-31days on market $98,000 Active 128 DOM
-
2026-04-26price $100,000
-
2026-03-17price $105,000
-
2025-12-12$110,000 Active
-
2025-08-31historical
-
2025-07-14price $125,000
-
2025-06-02price $127,990
-
2025-04-01price $130,000
-
2025-03-28price $131,950
-
2025-02-17price $132,000
-
2025-02-17price $120,000
-
2025-02-01$132,990 Active
-
2002-04-01soldstatus $30,000
ⓘ Source: listings_history table (triggers on properties + properties_extension) + one-shot
backfill from property_details.listing_events for pre-trigger history.
Tax reassessment forecast FL · Resets to sale price
- Current annual tax
- $376 · $31/mo
- Projected year-2 tax
- $813 · $68/mo
- Expected delta
- +$437/yr (+$36/mo · 116.1%)
ⓘ Screening estimate from a state-policy table — verify with the county assessor before closing.
Climate risk First Street
- Flood 6/10 Major FEMA zone X (unshaded) · 66% chance over 30 yrs
- Wildfire 1/10 Low
- Heat 10/10 Extreme 6 d/yr ≥107°F today · 22 d/yr by 30 yrs out
- Wind 10/10 Extreme 99% chance of damaging wind over 30 yrs
- Air quality 3/10 Moderate 3 unhealthy d/yr today · 3 by 30 yrs out
Nearby sold comps map
Loading sold comps map…
Walkable amenities ~0.75 mi
Loading nearby amenities…
Taxation est. · year 1
- Rental income
- $22,627
- − Mortgage interest
- −$5,490
- − Property taxes
- −$376
- − Insurance
- −$490
- − Repairs & maintenance
- −$1,810
- − Management
- −$1,810
- − HOA
- −$1,860
- − Depreciation
- −$2,851
- Taxable income
- $7,940
- Est. tax owed @ 24.0%
- −$1,906
- After-tax cash flow
- $7,076/yr
For passive investors: Depreciation is non-cash, so a rental often shows a tax loss while cash-flowing — sheltering income. Rental losses are passive: they offset passive income freely, and up to $25,000/yr can offset ordinary (W-2) income if you actively participate and your MAGI is under $100k (phasing out to $0 by $150k); unused losses carry forward. On sale, claimed depreciation is recaptured at up to 25%, and gains may owe capital-gains tax (a 1031 exchange can defer both). Figures are a year-1 estimate at your 24.0% rate — not tax advice; consult a CPA.
Schools (NCES district)
- District
- Pinellas
- NCES district ID
- 1201560
- Math proficiency
- 51% ▼ -5.00%
- Reading proficiency
- 51% ▼ -3.00%
- Median HH income
- $46,270
- Composite
- 43.27/100
- National rank
- #3046
- State rank
- #31 of 73 in FL
Livability — Largo
- Score
- 82/100
- State rank
- #82
- US rank
- #1240
Category grades
Schools grade is shown separately in the Schools card above.
Census & demographics
- Census place
- Largo, FL
- County
- Pinellas County · 939,478 people
- City population
- 106,311
- Metro
- Tampa-St. Petersburg-Clearwater, FL
- Population (ZIP)
- 27,311
- Household income
- $67,256
- Rent vs Own
- Severe rent burden
- 1118.0
Population outlook (Pinellas County) Hauer SSP2
- Today (2025)
- 1,027,532 people
- By 2030
- 1,063,586 · +3.5%
- By 2040
- 1,125,020 · +9.5%
- By 2050
- 1,168,637 · +13.7%
- By 2075
- 1,265,188 · +23.1%
- By 2100
- 1,260,357 · +22.7%
Race, ethnicity, and origin ACS 2023
- Neighborhood character
- Predominantly White (76%)
- Race & ethnicity
- White 76% Hispanic / Latino 13% Two or more races 8% Asian 4% Black 2%
- Hispanic origin (detail)
- Mexican 2% Puerto Rican 3% Cuban 2%
- Common ancestry
- Romanian 4% Lithuanian 3% German 2%
- Foreign-born
- 14% · Canada, Jamaica, Vietnam
- Languages at home
- 80% English-only · Spanish 10% Russian/Polish/Slavic 4% Other Indo-European 2%
Political lean MEDSL · Pinellas
- 2024 margin
- Lean R (+5.2) · D 46.9% · R 52.1%
- 2008→2024 swing
- -13.5pp toward R · 2008: 8.3pp · 2024: -5.2pp
- All cycles
- 2024: R+5.2 2020: D+0.2 2016: R+1.1 2012: D+5.6 2008: D+8.3
Not yet ingested
- Civics
- —
Market trends
- HPI YoY
- ▼ -350.08%
- Current HPI
- 315.4133
- Rent YoY
- ▼ -5.24%
- Metro
- Tampa-St. Petersburg-Clearwater, FL
- State GDP YoY
- ▲ 3.28%
- F500 in state
- 36
Industry mix (Fortune 500 HQ in FL)
| Industry | F500 HQs | Revenue |
|---|---|---|
| Industrial Technology | 2 | $29B |
|
||
| Insurance | 2 | $17B |
|
||
| Retail | 1 | $60B |
|
||
| Technology Distribution | 1 | $58B |
|
||
| Homebuilding | 1 | $35B |
|
||
| Technology Manufacturing | 1 | $35B |
|
||
Price history
+233.3% since first listed12 events — show timeline
- 2026-04-26 Price Changed $100,000 Stellar MLS as Distributed by MLS Grid
- 2026-03-17 Price Changed $105,000 Stellar MLS as Distributed by MLS Grid
- 2025-12-12 Listed $110,000 Stellar MLS as Distributed by MLS Grid
- 2025-08-31 Listing Removed — Stellar MLS as Distributed by MLS Grid
- 2025-07-14 Price Changed $125,000 Stellar MLS as Distributed by MLS Grid
- 2025-06-02 Price Changed $127,990 Stellar MLS as Distributed by MLS Grid
- 2025-04-01 Price Changed $130,000 Stellar MLS as Distributed by MLS Grid
- 2025-03-28 Price Changed $131,950 Stellar MLS as Distributed by MLS Grid
- 2025-02-17 Price Changed $132,000 Stellar MLS as Distributed by MLS Grid
- 2025-02-17 Price Changed $120,000 Stellar MLS as Distributed by MLS Grid
- 2025-02-01 Listed $132,990 Stellar MLS as Distributed by MLS Grid
- 2002-04-01 Sold (Public Records) $30,000 Public Records
Property tax history
-2.3%/yrLatest (2025): $376 · -1.7% YoY. Source: county tax records.
Cash-flow waterfall
monthlySold comps — $/sqft
last 12 mo · ≤1 miLoading sold comps…