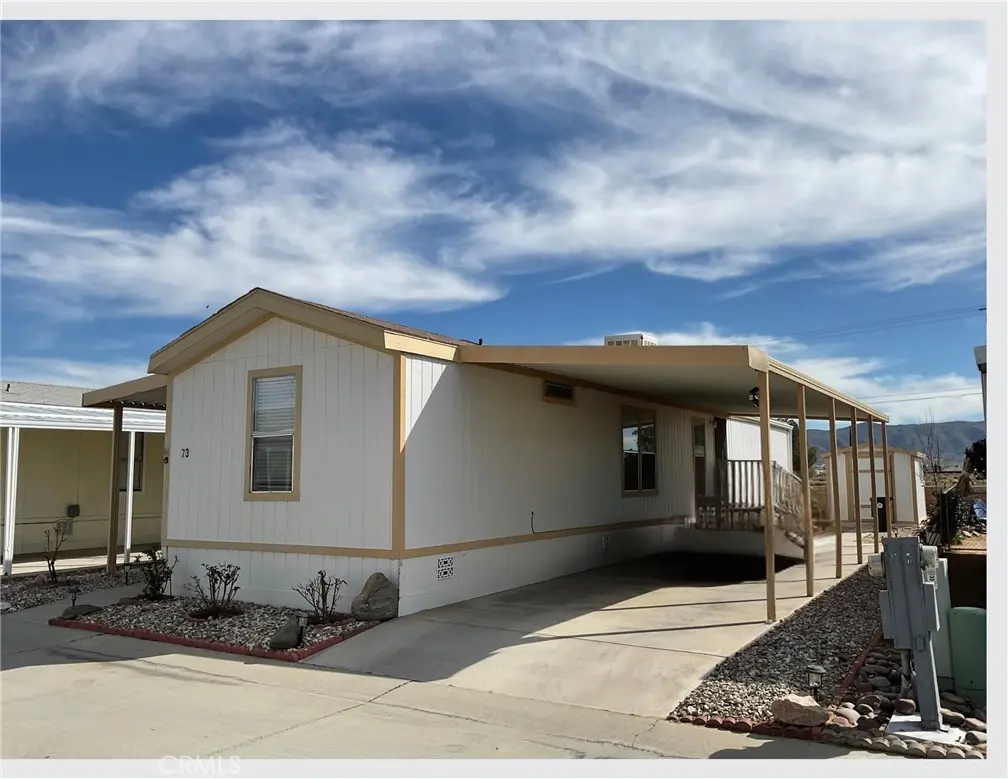
22020 Nisqually Rd #73 · Apple Valley, CA
Flood risk 1/10 · Minimal
- FEMA flood zone
- D
- Chance of flooding over 30 yrs
- 0.0%
- Est. flood insurance / yr
- $544 – $1,084
Fire risk 6/10 · Moderate
- Est. fire insurance / yr
- $659 – $1,223
Heat risk 7/10 · Major
- Hot days now (above 100°F)
- 4 days/yr
- Hot days in 30 yrs
- 9 days/yr
Wind risk 1/10 · Minimal
- Chance of severe wind over 30 yrs
- —
Air-quality risk 10/10 · Severe
- Unhealthy air days now
- 25 days/yr
- Unhealthy air days in 30 yrs
- 30 days/yr
Risk factors via First Street. Map © Google.
Why this score? — see what drove the B- grade
The composite is a weighted blend of 9 inputs, each scored 0–100. Each bar is that input's sub-score; the figure is the points it added to the 100-point composite (weight × sub-score).
- Cash flow +30.0/30.0
- 1% rule +10.0/10.0
- DSCR +10.0/10.0
- ARV discount +7.5/15.0
- Rent growth +3.6/5.0
- Schools +3.1/10.0
- Livability +3.1/5.0
- Condition / age +2.5/5.0
- Appreciation +0.0/10.0
$99,000
🖨 Deal sheet 📄 Offer letter ✓ Due diligence
Listing remarks MLS
Welcome to this charming 2-bedroom, 2 full-bath manufactured home offering approximately 924 sq ft of comfortable living space in Apple Valley. The home features a functional floor plan with bright living areas and spacious bedrooms. Enjoy the convenience of indoor washer and dryer hookups and additional storage with an outdoor shed. The property also includes a covered carport with space for two vehicles. Located in a community that offers a swimming pool for residents, this home provides both comfort and convenience. Situated near schools, shopping centers, and everyday amenities, it presents a great opportunity for buyers seeking affordable living in a well-located community.
Key facts
- Near schools
- Covered carport
- Swimming pool
Tags
Neighborhood map
What this means for you Summary
Snapshot
- This is a 2-bed/2.0-bath manufactured listed at $99k.
Deal economics
- At list price, monthly cash flow is $737 ($9k/yr) — positive.
- The deal already cash-flows at list — no discount required.
- Meets the 1% rule at list price ($2k rent vs $99k).
- Recommended offer: $90k (9.0% below list) — sets the bar for market timing.
- Cap rate 15.2% vs local median 3.5% in Apple Valley — top-decile yield for the area; either an underpriced asset or a hidden risk that comps aren't pricing in. Stress-test before assuming the spread holds.
Location & tenants
- Location reads 61/100 on livability (#532 in CA) — a middle-class / working-renter tenant base. Strengths: housing A+, commute B+; Watch: employment D+, schools F, crime D-.
- Apple Valley Unified (suburban): math 25% / reading 40% proficiency, ranked #955 of 1,400 in CA (top 68%) — families likely to look elsewhere, expect single-tenant / working-renter base with shorter leases; 60% free/reduced lunch — lower-income household profile, screen leases tightly.
- Market conditions: Rents rising fast (+4.3%/yr); 417 active listings in the ZIP; 23 comparable units currently listed for rent nearby; rentals at typical pace (median 24d on market — plan ~3-4 weeks tenant-placement turnaround); 5,458 units permitted in San Bernardino County in 2024 (1,500 in 5+ unit buildings).
- This rent runs 30% of the median local income ($67k/yr) — at the standard rent-burdened threshold; future hikes will face affordability resistance.
Forward outlook
- Local home prices are declining (-3.0%/yr); year-one equity from $684 of loan paydown is wiped out by about $3k of value loss. Plan a longer hold.
- San Bernardino County population projected at +15% by 2050 — modest demand growth; plan on rents tracking national, not racing it.
- At projected returns (-3.0% appreciation + 4.3% rent growth), your $28k cash investment doubles in ~4 years — after that, you're playing with house money.
Negotiation context
- It's been on market 97 days — a 9% lower offer ($90k) is reasonable based on typical stale-listing flexibility.
Risks & watch-outs
- Climate carrying-cost: major wildfire risk; extreme-heat days projected 4→9/yr by 2055 (HVAC capex compounding) — expect insurance premiums to compound above CPI over the hold.
Questions for the listing agent
- It's been on market 97 days. Have you received any prior offers? Is the seller open to a 9% concession, seller financing, or rate buy-down credit?
- Why hasn't it sold? Are there any deal-killer items the seller is aware of (foundation, flood, title, zoning, code violations)?
- Is there a deadline driving the sale (1031 exchange, divorce, estate, relocation)? That informs how much negotiation room exists.
- Schools are F-rated, which usually means shorter tenancies and higher turnover. Who's the typical renter profile here, and what's been the actual vacancy rate?
- Crime grade is D in this area — have there been break-ins, vandalism, or insurance claims at this property in the last 3 years? What carrier currently insures it and at what premium?
- What's the average days-on-market for RENTAL listings here right now (not sales)? A rising rental-DOM trend means longer vacancies and softer asking-rent achievability than the comps imply.
- What's the recent tenant-quality profile in this submarket — average credit score on applications, eviction rate, late-payment / NSF rate, and stable-employment percentage? A property-management company in the area should have these aggregated.
- How much new for-sale + rental construction is in the pipeline within 1–3 miles? Heavy new supply typically softens prices + rents 12–24 months out; constrained supply supports both.
Investment metrics
- 1% rule
- 1.69% ✓
- Cap rate
- 15.22%
- Cash-on-cash
- 31.89%
- DSCR
- 2.42
- GRM
- 4.9
CMA / ARV
- ARV (median comp)
- $65,000
- List price
- $99,000
- Delta
- 52.31%
- Verdict
- OVERPRICED
- Comps
- 3 within 1.0 mi
Show comp detail 3 sales within ~0.75 mi
| Address | Dist | Beds/Ba | Sqft | Sold | Price | $/sf | Match |
|---|---|---|---|---|---|---|---|
| 22020 Nisqually #11 | 0.00mi | 2/2.0 | 1,056 (+14%) | 5mo | $80,000 | $76 | 72 |
| 22241 Nisqually Rd #18 | 0.25mi | 3/2.0 (+1) | 960 (+4%) | 15mo | $110,000 | $115 | 64 |
| 22020 Nisqually Road #50 | 0.00mi | 3/2.0 (+1) | 1,056 (+14%) | 12mo | $129,000 | $122 | 61 |
Match score weights: distance 35% · size 25% · config 20% · recency 20%. Top-matched comps best support the ARV.
Projected returns pro-forma
-3.0% appreciation · 4.3% rent growth · sell at horizon
- IRR
- 28.2%
- Equity multiple
- 2.19×
- Total profit
- $33,059
- Equity at exit
- $14,761
- IRR
- 36.3%
- Equity multiple
- 4.55×
- Total profit
- $98,388
- Equity at exit
- $8,560
Cash invested: $27,720 (down + closing). Projections, not guarantees.
Landlord ↔ Tenant lean methodology
- Overall (STATE)
- 18 Strongly Tenant-Friendly
- State California
- 18 Strongly Tenant-Friendly · D+13
- County
- — inherits STATE
- City
- — inherits STATE
ZIP-level market 92308
- Home prices YoY
- -28.8%
- Rents YoY
- 4.3%
- Active inventory
- 417
- Price-to-rent
- 4.9×
Monthly cashflow live
- Estimated rent
- $1,671 high interval (Pro) →
- Mortgage (P&I)
- −$519
- Tax from tax record
- −$23 /mo · $274/yr
- Insurance
- −$41
- HOA
- −$0
- Vacancy / Maint / Mgmt
- −$351
- Net cashflow
- $737
Break-even live
UW: 25.0% down · 7.5% · 30yr · 1.5% tax · 5.0% vac · 8.0% maint · 8.0% mgmt
Financing live
Cash to close
- Down payment
- $24,750
- Closing costs
- $2,970
- Reserves months
- —
- Total cash needed
- —
Loan-product check · same deal, 3 products live
Conventional
25% down · 7.5% · 30yr
- Down + closing
- —
- Monthly P&I
- —
- Monthly cashflow
- —
- DSCR
- —
- Eligible?
- —
Personal DTI + credit; lowest rate.
DSCR
20% down · 8.5% · 30yr
- Down + closing
- —
- Monthly P&I
- —
- Monthly cashflow
- —
- DSCR
- —
- Eligible?
- —
No personal income docs; deal must DSCR.
Hard money
10% down · 12.0% · 12mo
- Down + closing
- —
- Monthly P&I
- —
- Monthly cashflow
- —
- DSCR
- —
- Eligible?
- —
Short-term bridge; refi at stabilization.
Rent comps 23 comps
| Address | Beds | Baths | Sqft | Rent | $/sqft | DOM | Units | Dist |
|---|---|---|---|---|---|---|---|---|
| 13073 Navajo Rd Unit A Apple Valley, CA | 2.0 | 2.0 | 1000 | $1,695 | $1.70 | 24d | 1 | 0.42mi |
| 13193 Navajo Rd Unit 3 Apple Valley, CA | 1.0 | 1.0 | 614 | $1,350 | $2.20 | 43d | 1 | 0.48mi |
| 13192 Navajo Rd Apple Valley, CA | 3.0 | 2.0 | 944 | $1,850 | $1.96 | 43d | 1 | 0.53mi |
| 13192 Navajo Rd #3 Apple Valley, CA | 3.0 | 2.0 | 944 | $1,795 | $1.90 | 24d | 1 | 0.55mi |
| 21601 Powhatan Rd Unit 10 Apple Valley, CA | 2.0 | 1.0 | 840 | $1,550 | $1.85 | 43d | 1 | 0.92mi |
| 13116 Mohawk Rd Apt 2 Apple Valley, CA | 2.0 | 1.0 | 875 | $1,800 | $2.06 | 5d | 1 | 0.92mi |
| 13583 Algonquin Rd Unit 4 Apple Valley, CA | 2.0 | 1.0 | 840 | $1,195 | $1.42 | 43d | 1 | 0.93mi |
| 22544 Sioux Rd Unit 21 Apple Valley, CA | 1.0 | 1.0 | 660 | $1,195 | $1.81 | 1d | 1 | 1.01mi |
| 22544 Sioux Rd Unit 21 Apple Valley, CA | 1.0 | 1.0 | 660 | $1,195 | $1.81 | 10d | 1 | 1.01mi |
| 13584 Yakima Rd Unit 1 Apple Valley, CA | 2.0 | 1.0 | 930 | $1,568 | $1.69 | 24d | 1 | 1.01mi |
| 22526 Sioux Rd Unit 12 Apple Valley, CA | 2.0 | 1.5 | 930 | $1,495 | $1.61 | 1d | 1 | 1.02mi |
| 22462 Miramot Rd Unit 3 Apple Valley, CA | 2.0 | 1.0 | 800 | $1,400 | $1.75 | 1d | 1 | 1.03mi |
| 19142 California 18 Apple Valley, CA | 2.0 | 2.0 | 1000 | $1,650 | $1.65 | 43d | 1 | 1.08mi |
| 13464 Mohawk Rd Apple Valley, CA | 2.0 | 1.0 | 937 | $1,799 | $1.92 | 18d | 1 | 1.09mi |
| 21061 Nisqually Rd Unit C Apple Valley, CA | 2.0 | 2.0 | 1024 | $1,750 | $1.71 | 43d | 1 | 1.21mi |
| 21490 Bear Valley Rd Apt A Apple Valley, CA | 2.0 | 1.0 | 875 | $1,595 | $1.82 | 20d | 1 | 1.22mi |
| 20955 Little Beaver Rd Unit 2 Apple Valley, CA | 2.0 | 1.0 | 896 | $1,600 | $1.79 | 24d | 1 | 1.38mi |
| 13191 Kiowa Rd Unit 3 Apple Valley, CA | 3.0 | 2.0 | 975 | $1,895 | $1.94 | 24d | 1 | 1.42mi |
| 13191 Kiowa Rd Unit 1 Apple Valley, CA | 2.0 | 1.0 | 875 | $1,650 | $1.89 | 24d | 1 | 1.42mi |
| 13191 Kiowa Rd Unit 2 Apple Valley, CA | 2.0 | 1.0 | 833 | $1,650 | $1.98 | 43d | 1 | 1.42mi |
| 14080 Mohawk Rd Apple Valley, CA | 2.0 | 2.0 | 748 | $1,850 | $2.47 | 24d | 1 | 1.48mi |
| 14080 Mohawk Rd Apple Valley, CA | 2.0 | 2.0 | 748 | $1,849 | $2.47 | 5d | 1 | 1.48mi |
| 12525 Kiowa Rd Unit 3 Apple Valley, CA | 2.0 | 1.0 | 799 | $1,675 | $2.10 | 43d | 1 | 1.49mi |
Listing history 15 events
-
2026-06-18days on market $99,000 Active 97 DOM
-
2026-06-17days on market $99,000 Active 96 DOM
-
2026-06-16days on market $99,000 Active 95 DOM
-
2026-06-15days on market $99,000 Active 94 DOM
-
2026-06-13days on market $99,000 Active 92 DOM
-
2026-06-13days on market $99,000 Active 91 DOM
-
2026-06-09days on market $99,000 Active 88 DOM
-
2026-06-08days on market $99,000 Active 87 DOM
-
2026-06-07days on market $99,000 Active 86 DOM
-
2026-06-04days on market $99,000 Active 83 DOM
-
2026-06-03days on market $99,000 Active 82 DOM
-
2026-06-02days on market $99,000 Active 81 DOM
-
2026-06-01days on market $99,000 Active 80 DOM
-
2026-05-31days on market $99,000 Active 79 DOM
-
2026-03-13$99,000 Active 687-char remark
Show marketing remark (687 chars)
Welcome to this charming 2-bedroom, 2 full-bath manufactured home offering approximately 924 sq ft of comfortable living space in Apple Valley. The home features a functional floor plan with bright living areas and spacious bedrooms. Enjoy the convenience of indoor washer and dryer hookups and additional storage with an outdoor shed. The property also includes a covered carport with space for two vehicles. Located in a community that offers a swimming pool for residents, this home provides both comfort and convenience. Situated near schools, shopping centers, and everyday amenities, it presents a great opportunity for buyers seeking affordable living in a well-located community.
ⓘ Source: listings_history table (triggers on properties + properties_extension) + one-shot
backfill from property_details.listing_events for pre-trigger history.
Tax reassessment forecast CA · Resets to sale price
- Current annual tax
- $274 · $23/mo
- Projected year-2 tax
- $752 · $63/mo
- Expected delta
- +$478/yr (+$40/mo · 174.2%)
ⓘ Screening estimate from a state-policy table — verify with the county assessor before closing.
Climate risk First Street
- Flood 1/10 Low FEMA zone D · 0% chance over 30 yrs
- Wildfire 6/10 Major
- Heat 7/10 Severe 4 d/yr ≥100°F today · 9 d/yr by 30 yrs out
- Wind 1/10 Low
- Air quality 10/10 Extreme 25 unhealthy d/yr today · 30 by 30 yrs out
Nearby sold comps map
Loading sold comps map…
Walkable amenities ~0.75 mi
Loading nearby amenities…
Taxation est. · year 1
- Rental income
- $20,051
- − Mortgage interest
- −$5,546
- − Property taxes
- −$274
- − Insurance
- −$495
- − Repairs & maintenance
- −$1,604
- − Management
- −$1,604
- − Depreciation
- −$2,880
- Taxable income
- $7,648
- Est. tax owed @ 24.0%
- −$1,836
- After-tax cash flow
- $7,005/yr
For passive investors: Depreciation is non-cash, so a rental often shows a tax loss while cash-flowing — sheltering income. Rental losses are passive: they offset passive income freely, and up to $25,000/yr can offset ordinary (W-2) income if you actively participate and your MAGI is under $100k (phasing out to $0 by $150k); unused losses carry forward. On sale, claimed depreciation is recaptured at up to 25%, and gains may owe capital-gains tax (a 1031 exchange can defer both). Figures are a year-1 estimate at your 24.0% rate — not tax advice; consult a CPA.
Schools (NCES district)
- District
- Apple Valley Unified
- NCES district ID
- 0600017
- Math proficiency
- 25% ▬ 0.00%
- Reading proficiency
- 40% ▬ 0.00%
- Median HH income
- $49,264
- Composite
- 30.91/100
- National rank
- #11351
- State rank
- #955 of 1400 in CA
Livability — Apple Valley
- Score
- 61/100
- State rank
- #532
- US rank
- #17800
Category grades
Schools grade is shown separately in the Schools card above.
Census & demographics
- Census place
- Apple Valley, CA
- County
- San Bernardino County · 2,030,291 people
- City population
- 83,889
- Metro
- Riverside-San Bernardino-Ontario, CA
- Population (ZIP)
- 42,709
- Household income
- $66,568
- Rent vs Own
- Severe rent burden
- 1389.0
Population outlook (San Bernardino County) Hauer SSP2
- Today (2025)
- 2,300,329 people
- By 2030
- 2,378,907 · +3.4%
- By 2040
- 2,523,137 · +9.7%
- By 2050
- 2,642,388 · +14.9%
- By 2075
- 2,880,769 · +25.2%
- By 2100
- 2,909,436 · +26.5%
Race, ethnicity, and origin ACS 2023
- Neighborhood character
- Diverse neighborhood (Simpson 0.65)
- Race & ethnicity
- White 44% Hispanic / Latino 38% Two or more races 19% Black 9% Asian 3%
- Hispanic origin (detail)
- Mexican 34%
- Common ancestry
- Italian 1% Iranian 1% Slovak 1%
- Foreign-born
- 11% · Canada, South Korea
- Languages at home
- 75% English-only · Spanish 20% Tagalog/Filipino 1% Other Asian/Pacific 1%
Political lean MEDSL · San Bernardino
- 2024 margin
- Toss-up / Even · D 47.5% · R 49.7% · Other 2.8%
- 2008→2024 swing
- -8.5pp toward R · 2008: 6.3pp · 2024: -2.1pp
- All cycles
- 2024: R+2.1 2020: D+10.7 2016: D+9.8 2012: D+5.4 2008: D+6.3
Not yet ingested
- Civics
- —
Market trends
- HPI YoY
- ▼ -145.60%
- Current HPI
- 359.2305
- Rent YoY
- ▲ 4.30%
- Metro
- Riverside-San Bernardino-Ontario, CA
- State GDP YoY
- ▲ 3.21%
- F500 in state
- 116
Industry mix (Fortune 500 HQ in CA)
| Industry | F500 HQs | Revenue |
|---|---|---|
| Technology | 27 | $1,492B |
|
||
| Financial Services | 3 | $174B |
|
||
| Retail | 3 | $44B |
|
||
| Insurance | 3 | $26B |
|
||
| Media / Entertainment | 2 | $115B |
|
||
| Pharmaceuticals / Biotech | 2 | $62B |
|
||
Price history
1 event — show timeline
- 2026-03-13 Listed $99,000 CRMLS
Property tax history
+2.8%/yrLatest (2025): $274 · +1.5% YoY. Source: county tax records.
Cash-flow waterfall
monthlySold comps — $/sqft
last 12 mo · ≤1 miLoading sold comps…