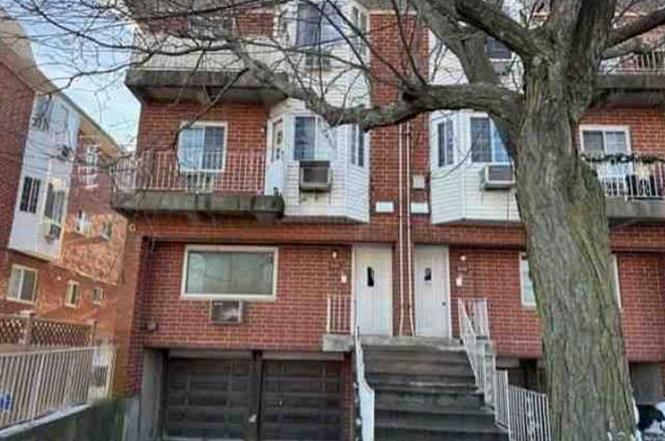
1116 Bergen Ave #85 · New York, NY
Flood risk 7/10 · Major
- FEMA flood zone
- X (unshaded)
- Chance of flooding over 30 yrs
- 0.77%
- Est. flood insurance / yr
- $507 – $1,088
Fire risk 1/10 · Minimal
- Est. fire insurance / yr
- $691 – $1,283
Heat risk 7/10 · Major
- Hot days now (above 97°F)
- 7 days/yr
- Hot days in 30 yrs
- 16 days/yr
Wind risk 6/10 · Moderate
- Chance of severe wind over 30 yrs
- 66.0%
Air-quality risk 5/10 · Moderate
- Unhealthy air days now
- 6 days/yr
- Unhealthy air days in 30 yrs
- 8 days/yr
Risk factors via First Street. Map © Google.
Why this score? — see what drove the C grade
The composite is a weighted blend of 9 inputs, each scored 0–100. Each bar is that input's sub-score; the figure is the points it added to the 100-point composite (weight × sub-score).
- Cash flow +22.3/30.0
- ARV discount +7.5/15.0
- DSCR +7.1/10.0
- 1% rule +6.8/10.0
- Rent growth +5.0/5.0
- Schools +5.0/10.0
- Livability +3.8/5.0
- Condition / age +2.5/5.0
- Appreciation +0.0/10.0
$288,900
🖨 Deal sheet 📄 Offer letter ✓ Due diligence
Listing remarks
Looking for a great opportunity? Current list price is: $360,400. This property has tons of potential and is average in living space size for the neighborhood. It is located close to main roads with easy access to local amenities, such as shopping, banking, schools, and various eateries. Per our APPRAISAL describes the property as a CONDOMINIUM (GARDEN APT) built in 1986. It has a GLA of approx. 933 and has 3 bedrooms and 2.5baths, NO basement and 1-built In Garage. Seller cannot guarantee access at any given time.
Key facts
- Close to main roads
- $225 HOA
- Garage
Tags
Property features AI
Finance
- HOA & community: Homeowners association with a $225 monthly fee; Association fee covers: other (see association details)
Exterior
- Parking: Assigned parking; One parking space; One-car garage
- Utilities: Public sewer; Utilities: see remarks
- Home design: Condominium
- Construction: Frame construction
- Exterior features: Frame construction; Not waterfront
Interior
- Bathrooms: Two full bathrooms; One half bathroom
- Heating & cooling: Baseboard heating; Natural gas heating; No cooling
- Interior features: No central cooling; Baseboard and natural gas heating; No basement; Entry on level 1; No appliance package included; Pets allowed with no restrictions; Six total rooms
Neighborhood map
What this means for you Summary
Snapshot
- This is a 3-bed/2.5-bath condo listed at $289k.
Deal economics
- At list price, monthly cash flow is $407 ($5k/yr) — positive.
- The deal already cash-flows at list — no discount required.
- Meets the 1% rule at list price ($3k rent vs $289k).
- Recommended offer: $263k (9.0% below list) — sets the bar for market timing.
- Cap rate 8.3% vs local median 2.6% in New York — top-decile yield for the area; either an underpriced asset or a hidden risk that comps aren't pricing in. Stress-test before assuming the spread holds.
Location & tenants
- Location reads 75/100 on livability (#268 in NY, #4,188 nationally) — a middle-class / working-renter tenant base. Strengths: amenities A+, commute A+, health & safety A; Watch: crime F, cost of living F.
- Market conditions: Rents rising fast (+16.2%/yr); 459 active listings in the ZIP; 1 comparable units currently listed for rent nearby; solid renter incomes; 10,063 units permitted in Kings County in 2024 (9,789 in 5+ unit buildings).
- This rent runs 42% of the median local income ($97k/yr) — at the standard rent-burdened threshold; future hikes will face affordability resistance.
Forward outlook
- Local home prices are declining (-3.0%/yr); year-one equity from $2k of loan paydown is wiped out by about $9k of value loss. Plan a longer hold.
- Kings County population projected at +13% by 2050 — modest demand growth; plan on rents tracking national, not racing it.
- At projected returns (-3.0% appreciation + 8.0% rent growth), your $81k cash investment doubles in ~9 years — after that, you're playing with house money.
Negotiation context
- It's been on market 106 days — a 9% lower offer ($263k) is reasonable based on typical stale-listing flexibility.
- Current owner paid $500; list at $289k implies a 57680% gain — meaningful room to come down on a strong offer.
Risks & watch-outs
- Watch-outs: flood insurance adds $66/mo.
- Climate carrying-cost: major flood risk; major wind risk, 66% chance of damaging wind over 30y; extreme-heat days projected 7→16/yr by 2055 (HVAC capex compounding) — expect insurance premiums to compound above CPI over the hold.
Questions for the listing agent
- It's been on market 106 days. Have you received any prior offers? Is the seller open to a 9% concession, seller financing, or rate buy-down credit?
- What's the actual annual flood-insurance premium (NFIP or private), and is the property in a SFHA with mandatory coverage?
- What does the HOA fee cover, when was the last increase, and are there any pending special assessments or reserve-fund shortfalls?
- Any open or pending special assessments — roof, HVAC, plumbing, elevator, façade? What's the per-unit balance and payoff schedule, and is the seller paying it off at close or rolling it to the buyer?
- Why hasn't it sold? Are there any deal-killer items the seller is aware of (foundation, flood, title, zoning, code violations)?
- Is there a deadline driving the sale (1031 exchange, divorce, estate, relocation)? That informs how much negotiation room exists.
- Schools are B-rated — typically a magnet for longer-tenancy family renters. What's the average tenant stay here, and is there a school-zone premium baked into asking?
- Crime grade is F in this area — have there been break-ins, vandalism, or insurance claims at this property in the last 3 years? What carrier currently insures it and at what premium?
- What's the average days-on-market for RENTAL listings here right now (not sales)? A rising rental-DOM trend means longer vacancies and softer asking-rent achievability than the comps imply.
- What's the recent tenant-quality profile in this submarket — average credit score on applications, eviction rate, late-payment / NSF rate, and stable-employment percentage? A property-management company in the area should have these aggregated.
- How much new apartment / multifamily construction is in the pipeline within 1–3 miles? Heavy new supply (>2% of stock underway) typically softens rents 12–24 months out; light construction supports rent growth.
Investment metrics
- 1% rule
- 1.18% ✓
- Cap rate
- 8.26%
- Cash-on-cash
- 7.03%
- DSCR
- 1.31
- GRM
- 7.1
CMA / ARV
No comps found within radius.
Projected returns pro-forma
-3.0% appreciation · 8.0% rent growth · sell at horizon
- IRR
- -0.8%
- Equity multiple
- 0.97×
- Total profit
- $-2,717
- Equity at exit
- $43,076
- IRR
- 13.9%
- Equity multiple
- 2.40×
- Total profit
- $113,604
- Equity at exit
- $24,979
Cash invested: $80,892 (down + closing). Projections, not guarantees.
Landlord ↔ Tenant lean methodology
- Overall (CITY)
- 0 Strongly Tenant-Friendly
- State New York
- 15 Strongly Tenant-Friendly · D+10
- County
- — inherits STATE
- City New York
- 0 Strongly Tenant-Friendly · D+34
ZIP-level market 11234
- Rents YoY
- 16.2%
- Active inventory
- 459
- Price-to-rent
- 7.1×
Monthly cashflow live
- Estimated rent
- $3,396 medium interval (Pro) →
- Mortgage (P&I)
- −$1,515
- Tax from tax record
- −$349 /mo · $4,183/yr
- Insurance
- −$120
- Flood insurance flood zone
- −$66 /mo · $798/yr
- HOA
- −$225
- Vacancy / Maint / Mgmt
- −$713
- Net cashflow
- $407
Break-even live
UW: 25.0% down · 7.5% · 30yr · 1.5% tax · 5.0% vac · 8.0% maint · 8.0% mgmt
Financing live
Cash to close
- Down payment
- $72,225
- Closing costs
- $8,667
- Reserves months
- —
- Total cash needed
- —
Loan-product check · same deal, 3 products live
Conventional
25% down · 7.5% · 30yr
- Down + closing
- —
- Monthly P&I
- —
- Monthly cashflow
- —
- DSCR
- —
- Eligible?
- —
Personal DTI + credit; lowest rate.
DSCR
20% down · 8.5% · 30yr
- Down + closing
- —
- Monthly P&I
- —
- Monthly cashflow
- —
- DSCR
- —
- Eligible?
- —
No personal income docs; deal must DSCR.
Hard money
10% down · 12.0% · 12mo
- Down + closing
- —
- Monthly P&I
- —
- Monthly cashflow
- —
- DSCR
- —
- Eligible?
- —
Short-term bridge; refi at stabilization.
Rent comps 1 comps
| Address | Beds | Baths | Sqft | Rent | $/sqft | DOM | Units | Dist |
|---|---|---|---|---|---|---|---|---|
| 1455 Royce St Unit 1H Brooklyn, NY | 3.0 | 2.0 | 1113 | $3,700 | $3.32 | 24d | 1 | 0.48mi |
HOA detail condo
- Monthly dues
- $225 · $2,700/yr
- Assessments
- None detected in remarks — confirm with the listing agent.
Listing history 10 events
-
2026-04-14status Pending
-
2026-03-13price $288,900
-
2026-02-25price $296,700
-
2026-02-09price $321,600
-
2026-01-16price $358,500
-
2025-12-29$360,400 Active
-
2025-08-20soldstatus $500
-
2024-02-27soldstatus $140,000
-
2004-10-19soldstatus $323,300
-
1986-12-08soldstatus $190,000
ⓘ Source: listings_history table (triggers on properties + properties_extension) + one-shot
backfill from property_details.listing_events for pre-trigger history.
Tax reassessment forecast NY · Partial reset (capped growth)
- Current annual tax
- $4,183 · $349/mo
- Projected year-2 tax
- $4,533 · $378/mo
- Expected delta
- +$350/yr (+$29/mo · 8.4%)
ⓘ Screening estimate from a state-policy table — verify with the county assessor before closing.
Climate risk First Street
- Flood 7/10 Severe FEMA zone X (unshaded) · 77% chance over 30 yrs
- Wildfire 1/10 Low
- Heat 7/10 Severe 7 d/yr ≥97°F today · 16 d/yr by 30 yrs out
- Wind 6/10 Major 66% chance of damaging wind over 30 yrs
- Air quality 5/10 Major 6 unhealthy d/yr today · 8 by 30 yrs out
Nearby sold comps map
Loading sold comps map…
Walkable amenities ~0.75 mi
Loading nearby amenities…
Taxation est. · year 1
- Rental income
- $40,748
- − Mortgage interest
- −$16,183
- − Property taxes
- −$4,183
- − Insurance
- −$2,242
- − Repairs & maintenance
- −$3,260
- − Management
- −$3,260
- − HOA
- −$2,700
- − Depreciation
- −$8,404
- Taxable income
- $516
- Est. tax owed @ 24.0%
- −$124
- After-tax cash flow
- $4,762/yr
For passive investors: Depreciation is non-cash, so a rental often shows a tax loss while cash-flowing — sheltering income. Rental losses are passive: they offset passive income freely, and up to $25,000/yr can offset ordinary (W-2) income if you actively participate and your MAGI is under $100k (phasing out to $0 by $150k); unused losses carry forward. On sale, claimed depreciation is recaptured at up to 25%, and gains may owe capital-gains tax (a 1031 exchange can defer both). Figures are a year-1 estimate at your 24.0% rate — not tax advice; consult a CPA.
Schools (NCES district)
No district data.
Livability — New York
- Score
- 75/100
- State rank
- #268
- US rank
- #4188
Category grades
Schools grade is shown separately in the Schools card above.
Census & demographics
- Census place
- New York, NY
- County
- Kings County · 2,614,986 people
- City population
- 7,731,280
- Metro
- New York-Newark-Jersey City, NY-NJ-PA
- Population (ZIP)
- 83,187
- Household income
- $97,479
- Rent vs Own
- Severe rent burden
- 2384.0
Population outlook (Kings County) Hauer SSP2
- Today (2025)
- 2,847,441 people
- By 2030
- 2,937,006 · +3.1%
- By 2040
- 3,095,491 · +8.7%
- By 2050
- 3,228,968 · +13.4%
- By 2075
- 3,321,723 · +16.7%
- By 2100
- 3,111,387 · +9.3%
Race, ethnicity, and origin ACS 2023
- Neighborhood character
- Diverse neighborhood (Simpson 0.69)
- Race & ethnicity
- Black 42% White 35% Hispanic / Latino 10% Asian 8% Two or more races 7%
- Hispanic origin (detail)
- Mexican 1% Puerto Rican 4%
- Common ancestry
- Hispanic 8% Scotch-Irish 3% Romanian 2%
- Foreign-born
- 35% · Canada, China, Mexico
- Languages at home
- 65% English-only · French/Haitian/Cajun 9% Spanish 7% Russian/Polish/Slavic 6%
Political lean MEDSL · Kings
- 2024 margin
- Solid D (+44.0) · D 72.0% · R 28.0%
- 2008→2024 swing
- -15.5pp toward R · 2008: 59.4pp · 2024: 44.0pp
- All cycles
- 2024: D+44.0 2020: D+54.8 2016: D+61.8 2012: D+63.9 2008: D+59.4
Not yet ingested
- Civics
- —
Market trends
- HPI YoY
- ▼ -667.47%
- Current HPI
- 318.0416
- Rent YoY
- ▲ 16.21%
- Metro
- New York-Newark-Jersey City, NY-NJ-PA
- State GDP YoY
- ▲ 2.60%
- F500 in state
- 92
Industry mix (Fortune 500 HQ in NY)
| Industry | F500 HQs | Revenue |
|---|---|---|
| Financial Services | 10 | $950B |
|
||
| Consumer Goods | 9 | $162B |
|
||
| Insurance | 4 | $225B |
|
||
| Telecommunications | 2 | $144B |
|
||
| Pharmaceuticals | 2 | $112B |
|
||
| Media / Entertainment | 2 | $69B |
|
||
Price history
+52.1% since first listed10 events — show timeline
- 2026-04-14 Pending — OneKey® MLS as Distributed by MLS Grid
- 2026-03-13 Price Changed $288,900 OneKey® MLS as Distributed by MLS Grid
- 2026-02-25 Price Changed $296,700 OneKey® MLS as Distributed by MLS Grid
- 2026-02-09 Price Changed $321,600 OneKey® MLS as Distributed by MLS Grid
- 2026-01-16 Price Changed $358,500 OneKey® MLS as Distributed by MLS Grid
- 2025-12-29 Listed $360,400 OneKey® MLS as Distributed by MLS Grid
- 2025-08-20 Sold (Public Records) $500 Public Records
- 2024-02-27 Sold (Public Records) $140,000 Public Records
- 2004-10-19 Sold (Public Records) $323,300 Public Records
- 1986-12-08 Sold (Public Records) $190,000 Public Records
Property tax history
+3.5%/yrLatest (2025): $4,183 · -1.7% YoY. Source: county tax records.
Cash-flow waterfall
monthlySold comps — $/sqft
last 12 mo · ≤1 miLoading sold comps…