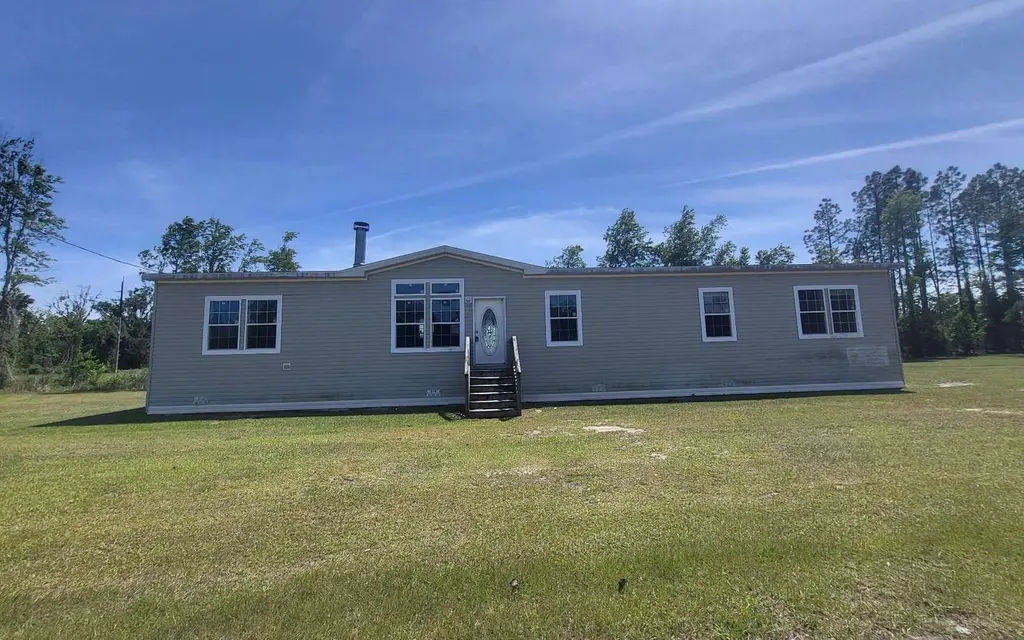
192 SE Ashe Way · Madison, FL
Flood risk 7/10 · Major
- FEMA flood zone
- X (unshaded)
- Chance of flooding over 30 yrs
- 0.99%
- Est. flood insurance / yr
- $507 – $1,088
Fire risk 8/10 · Major
- Est. fire insurance / yr
- $947 – $1,759
Heat risk 8/10 · Major
- Hot days now (above 108°F)
- 7 days/yr
- Hot days in 30 yrs
- 21 days/yr
Wind risk 9/10 · Severe
- Chance of severe wind over 30 yrs
- 99.0%
Air-quality risk 6/10 · Moderate
- Unhealthy air days now
- 11 days/yr
- Unhealthy air days in 30 yrs
- 12 days/yr
Risk factors via First Street. Map © Google.
Why this score? — see what drove the C+ grade
The composite is a weighted blend of 9 inputs, each scored 0–100. Each bar is that input's sub-score; the figure is the points it added to the 100-point composite (weight × sub-score).
- Cash flow +22.7/30.0
- Appreciation +10.0/10.0
- ARV discount +7.5/15.0
- DSCR +7.3/10.0
- 1% rule +5.7/10.0
- Livability +3.5/5.0
- Schools +3.3/10.0
- Rent growth +2.5/5.0
- Condition / age +2.5/5.0
$130,000
🖨 Deal sheet (PDF) 📄 Offer letter ✓ Due diligence
Listing remarks
Large manufactured home with 5 bedrooms, 3 full bathrooms AND a massive bonus room. Property is fully cleared giving you plenty of room for outdoor activities. Features include: glass cooktop with range in kitchen, large pantry, open floor plan, cozy electric fireplace in living room, all with a perfectly laid out floor plan offering 4 bedrooms and bonus room on one side and primary bedroom on the other end. Soaker tub and dual vanities in primary bathroom. This property offers loads of potential and just needs some TLC to shine once again. Call today for more details!
Key facts
- 0.9 acre lot
- 3 garage spots
- Built 2015
Property features AI
Exterior
- Parking: 3-car garage
- Utilities: Private well water
- Home design: Manufactured home; Residential property; Zoned SF
- Construction: Frame construction
- Exterior features: Shingle roof; Gravel road access
Interior
- Kitchen: Dishwasher; Microwave
- Flooring: Vinyl flooring
- Bathrooms: 3 full bathrooms
- Heating & cooling: Central heating (electric); Central air conditioning
- Interior features: Dishwasher; Microwave
Neighborhood map
What this means for you Summary
Snapshot
- This is a 5-bed/3.0-bath single-family listed at $130k.
Deal economics
- At list price, monthly cash flow is $158 ($2k/yr) — positive.
- The deal already cash-flows at list — no discount required.
- Meets the 1% rule at list price ($1k rent vs $130k).
- Recommended offer: $126k (3.0% below list) — sets the bar for market timing.
- Cap rate 8.4% vs local median 2.6% in Madison — top-decile yield for the area; either an underpriced asset or a hidden risk that comps aren't pricing in. Stress-test before assuming the spread holds.
Location & tenants
- Location reads 70/100 on livability (#437 in FL) — a middle-class / working-renter tenant base. Strengths: cost of living A+, health & safety A+, crime A; Watch: housing D+, amenities F, commute F.
- Madison (rural): math 39% / reading 40% proficiency, ranked #64 of 73 in FL (top 88%) — families likely to look elsewhere, expect single-tenant / working-renter base with shorter leases; 75% free/reduced lunch — lower-income household profile, screen leases tightly.
- Zoned schools: Madison County Central School (math 26% / reading 29%, grade F, #1,962 of 2,144 statewide, top 92%, 846 students, 80% FRL); Madison County High School (math 27% / reading 32%, grade F, #447 of 667 statewide, top 68%, 468 students, 59% FRL) — zoned schools at 70% FRL track the district average.
- Market conditions: 97 active listings in the ZIP; 31 units permitted in Madison County in 2024 (0 in 5+ unit buildings).
Forward outlook
- In year one you build about $14k of equity ($899 loan paydown + $13k appreciation (10.0% local appreciation)).
- Madison County population projected at -29% by 2050 — secular population decline; favor cash flow + early exit over multi-decade hold.
- At projected returns (10.0% appreciation + 3.0% rent growth), your $36k cash investment doubles in ~3 years — after that, you're playing with house money.
- By year 3, paydown + projected appreciation supports a ~$35k cash-out refi (75% LTV) — recoverable capital for the next deal without selling this one.
Negotiation context
- It's been on market 41 days — a 3% lower offer ($126k) is reasonable based on typical stale-listing flexibility.
- 3 sale attempts; this cycle's ask has dropped $10k (7%) from the opening price — seller is motivated, your offer sets the floor, not the list.
Risks & watch-outs
- Watch-outs: flood insurance adds $66/mo.
- Climate carrying-cost: major flood risk; severe wind risk, 99% chance of damaging wind over 30y; severe wildfire risk; extreme-heat days projected 7→21/yr by 2055 (HVAC capex compounding) — expect insurance premiums to compound above CPI over the hold.
Questions for the listing agent
- It's been on market 41 days. Have you received any prior offers? Is the seller open to a 3% concession, seller financing, or rate buy-down credit?
- What's the actual annual flood-insurance premium (NFIP or private), and is the property in a SFHA with mandatory coverage?
- Is there a deadline driving the sale (1031 exchange, divorce, estate, relocation)? That informs how much negotiation room exists.
- What's the average days-on-market for RENTAL listings here right now (not sales)? A rising rental-DOM trend means longer vacancies and softer asking-rent achievability than the comps imply.
- What's the recent tenant-quality profile in this submarket — average credit score on applications, eviction rate, late-payment / NSF rate, and stable-employment percentage? A property-management company in the area should have these aggregated.
- How much new for-sale + rental construction is in the pipeline within 1–3 miles? Heavy new supply typically softens prices + rents 12–24 months out; constrained supply supports both.
Investment metrics
- 1% rule
- 1.07% ✓
- Cap rate
- 8.36%
- Cash-on-cash
- 7.39%
- DSCR
- 1.33
- GRM
- 7.8
CMA / ARV
No comps found within radius.
Projected returns pro-forma
10.0% appreciation · 3.0% rent growth · sell at horizon
- IRR
- 28.1%
- Equity multiple
- 3.22×
- Total profit
- $80,888
- Equity at exit
- $117,114
- IRR
- 24.5%
- Equity multiple
- 7.33×
- Total profit
- $230,409
- Equity at exit
- $252,561
Cash invested: $36,400 (down + closing). Projections, not guarantees.
Landlord ↔ Tenant lean methodology
- Overall (STATE)
- 87 Strongly Landlord-Friendly
- State Florida
- 87 Strongly Landlord-Friendly · R+3
- County
- — inherits STATE
- City
- — inherits STATE
ZIP-level market 32340
- Home prices YoY
- 32.0%
- Active inventory
- 97
- Price-to-rent
- 7.8×
Monthly cashflow live
- Estimated rent
- $1,397 medium interval (Pro) →
- Mortgage (P&I)
- −$682
- Tax from tax record
- −$143 /mo · $1,720/yr
- Insurance
- −$54
- Flood insurance flood zone
- −$66 /mo · $798/yr
- HOA
- −$0
- Vacancy / Maint / Mgmt
- −$293
- Net cashflow
- $158
Break-even live
Sensitivity live
| Price | -10% $231 | -5% $194 | +0% $158 | +5% $121 | +10% $84 |
|---|---|---|---|---|---|
| Rent | -10% $47 | -5% $102 | +0% $158 | +5% $213 | +10% $268 |
| Rate | -1.0pp $223 | -0.5pp $191 | base $158 | +0.5pp $124 | +1.0pp $90 |
UW: 25.0% down · 7.5% · 30yr · 1.5% tax · 5.0% vac · 8.0% maint · 8.0% mgmt
Financing live
Cash to close
- Down payment
- $32,500
- Closing costs
- $3,900
- Reserves months
- —
- Total cash needed
- —
Loan-product check · same deal, 3 products live
Conventional
25% down · 7.5% · 30yr
- Down + closing
- —
- Monthly P&I
- —
- Monthly cashflow
- —
- DSCR
- —
- Eligible?
- —
Personal DTI + credit; lowest rate.
DSCR
20% down · 8.5% · 30yr
- Down + closing
- —
- Monthly P&I
- —
- Monthly cashflow
- —
- DSCR
- —
- Eligible?
- —
No personal income docs; deal must DSCR.
Hard money
10% down · 12.0% · 12mo
- Down + closing
- —
- Monthly P&I
- —
- Monthly cashflow
- —
- DSCR
- —
- Eligible?
- —
Short-term bridge; refi at stabilization.
Listing history 23 events
-
2026-06-22days on market $130,000 Active 41 DOM
-
2026-06-19days on market $130,000 Active 39 DOM
-
2026-06-18days on market $130,000 Active 38 DOM
-
2026-06-17days on market $130,000 Active 37 DOM
-
2026-06-16days on market $130,000 Active 36 DOM
-
2026-06-15days on market $130,000 Active 35 DOM
-
2026-06-14days on market $130,000 Active 33 DOM
-
2026-06-13pricedays on market $130,000 Active 32 DOM
-
2026-06-10days on market $140,000 Active 30 DOM
-
2026-06-09days on market $140,000 Active 29 DOM
-
2026-06-08days on market $140,000 Active 28 DOM
-
2026-06-07days on market $140,000 Active 27 DOM
-
2026-06-05days on market $140,000 Active 24 DOM
-
2026-06-03days on market $140,000 Active 23 DOM
-
2026-06-02days on market $140,000 Active 22 DOM
-
2026-06-01days on market $140,000 Active 21 DOM
-
2026-05-31days on market $140,000 Active 20 DOM
-
2026-05-30days on market $140,000 Active 19 DOM
-
2026-05-11$140,000 Active
-
2026-01-12historical Active Under Contract
-
2026-01-06$149,000 Active
-
2026-01-06historical
-
2025-01-30$95,000 Active
ⓘ Source: listings_history table (triggers on properties + properties_extension) + one-shot
backfill from property_details.listing_events for pre-trigger history.
Tax reassessment forecast FL · Resets to sale price
- Current annual tax
- $1,720 · $143/mo
- Projected year-2 tax
- $1,720 · $143/mo
- Expected delta
- $0/yr ($0/mo · 0.0%)
ⓘ Screening estimate from a state-policy table — verify with the county assessor before closing.
Climate risk First Street
- Flood 7/10 Severe FEMA zone X (unshaded) · 99% chance over 30 yrs
- Wildfire 8/10 Severe
- Heat 8/10 Severe 7 d/yr ≥108°F today · 21 d/yr by 30 yrs out
- Wind 9/10 Extreme 99% chance of damaging wind over 30 yrs
- Air quality 6/10 Major 11 unhealthy d/yr today · 12 by 30 yrs out
Nearby sold comps map
Loading sold comps map…
Walkable amenities ~0.75 mi
Loading nearby amenities…
Taxation est. · year 1
- Rental income
- $16,758
- − Mortgage interest
- −$7,282
- − Property taxes
- −$1,720
- − Insurance
- −$1,448
- − Repairs & maintenance
- −$1,341
- − Management
- −$1,341
- − Depreciation
- −$3,782
- Taxable loss
- −$154
- Est. tax savings @ 24.0%
- +$37
- After-tax cash flow
- $1,928/yr
For passive investors: Depreciation is non-cash, so a rental often shows a tax loss while cash-flowing — sheltering income. Rental losses are passive: they offset passive income freely, and up to $25,000/yr can offset ordinary (W-2) income if you actively participate and your MAGI is under $100k (phasing out to $0 by $150k); unused losses carry forward. On sale, claimed depreciation is recaptured at up to 25%, and gains may owe capital-gains tax (a 1031 exchange can defer both). Figures are a year-1 estimate at your 24.0% rate — not tax advice; consult a CPA.
Schools (NCES district)
- District
- Madison
- NCES district ID
- 1201200
- Math proficiency
- 39% ▼ -5.00%
- Reading proficiency
- 40% ▼ -2.00%
- Median HH income
- $33,925
- Composite
- 32.54/100
- National rank
- #5693
- State rank
- #64 of 73 in FL
Livability — Madison
- Score
- 70/100
- State rank
- #437
- US rank
- #7819
Category grades
Schools grade is shown separately in the Schools card above.
Census & demographics
- Population (ZIP)
- 10,424
Population outlook (Madison County) Hauer SSP2
- Today (2025)
- 16,849 people
- By 2030
- 15,883 · -5.7%
- By 2040
- 13,861 · -17.7%
- By 2050
- 11,918 · -29.3%
- By 2075
- 7,810 · -53.6%
- By 2100
- 4,684 · -72.2%
Race, ethnicity, and origin ACS 2023
- Neighborhood character
- Diverse neighborhood (Simpson 0.56)
- Race & ethnicity
- White 50% Black 43% Two or more races 5% Hispanic / Latino 3%
- Common ancestry
- Slovak 1% Iranian 1% Serbian 1%
- Foreign-born
- 2% · Canada
- Languages at home
- 97% English-only · Spanish 2%
Political lean MEDSL · Madison
- 2024 margin
- Strong R (+28.9) · D 35.3% · R 64.2%
- 2008→2024 swing
- -25.8pp toward R · 2008: -3.1pp · 2024: -28.9pp
- All cycles
- 2024: R+28.9 2020: R+19.5 2016: R+15.6 2012: R+3.4 2008: R+3.1
Not yet ingested
- Civics
- —
Market trends
- HPI YoY
- ▲ 65.13%
- Current HPI
- 268.8459
- Rent YoY
- —
- Metro
- —
- State GDP YoY
- ▲ 3.28%
- F500 in state
- 36
Industry mix (Fortune 500 HQ in FL)
| Industry | F500 HQs | Revenue |
|---|---|---|
| Industrial Technology | 2 | $29B |
|
||
| Insurance | 2 | $17B |
|
||
| Retail | 1 | $60B |
|
||
| Technology Distribution | 1 | $58B |
|
||
| Homebuilding | 1 | $35B |
|
||
| Technology Manufacturing | 1 | $35B |
|
||
Price history
+47.4% since first listed5 events — show timeline
- 2026-05-11 Listed $140,000 NFMLS
- 2026-01-12 Contingent — CATRS
- 2026-01-06 Listing Removed — CATRS
- 2026-01-06 Listed $149,000 CATRS
- 2025-01-30 Listed $95,000 BEARMLS
Property tax history
+1.8%/yrLatest (2025): $1,720 · +1.7% YoY. Source: county tax records.
Cash-flow waterfall
monthlySold comps — $/sqft
last 12 mo · ≤1 miLoading sold comps…