 Duplex
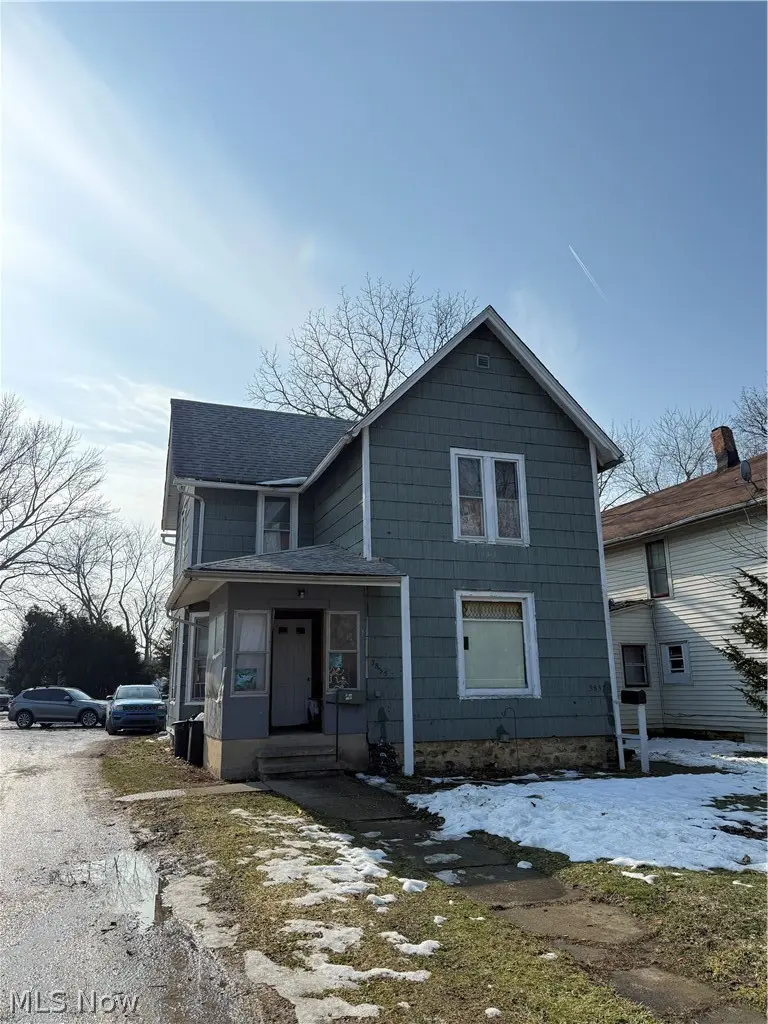
3835 Lake Ave · Ashtabula, OH
Flood risk 1/10 · Minimal
- FEMA flood zone
- X (unshaded)
- Chance of flooding over 30 yrs
- 0.0%
- Est. flood insurance / yr
- $473 – $860
Fire risk 1/10 · Minimal
- Est. fire insurance / yr
- $713 – $1,323
Heat risk 2/10 · Minimal
- Hot days now (above 93°F)
- 7 days/yr
- Hot days in 30 yrs
- 17 days/yr
Wind risk 1/10 · Minimal
- Chance of severe wind over 30 yrs
- —
Air-quality risk 3/10 · Minor
- Unhealthy air days now
- 2 days/yr
- Unhealthy air days in 30 yrs
- 5 days/yr
Risk factors via First Street. Map © Google.
Why this score? — see what drove the C+ grade
The composite is a weighted blend of 9 inputs, each scored 0–100. Each bar is that input's sub-score; the figure is the points it added to the 100-point composite (weight × sub-score).
- Cash flow +30.0/30.0
- 1% rule +10.0/10.0
- DSCR +10.0/10.0
- Livability +3.6/5.0
- Rent growth +2.5/5.0
- Condition / age +2.5/5.0
- Schools +2.4/10.0
- ARV discount +0.0/15.0
- Appreciation +0.0/10.0
$144,000
🖨 Deal sheet 📄 Offer letter ✓ Due diligence
Multi-family units
County records classify this as Multi-Family (2-4 Unit). Listing-text estimate: 2 units. confirmed
Listing remarks MLS
Income-Producing Duplex in Ashtabula City – Investor Opportunity! Located close to shopping, restaurants, schools, parks, and all the everyday amenities Ashtabula City has to offer, this duplex is a solid addition to any investment portfolio. This property features two units: A spacious 3-bedroom, 1-bath A comfortable 1-bedroom, 1-bath Both units are currently rented, providing immediate cash flow from day one. The property does need a little TLC, making it a great opportunity for an investor ready to add value and build equity. The big-ticket item? The roof is only 5 years old, giving peace of mind and saving on major upfront expenses. Outside you’ll find a detached garage and a large driveway with plenty of parking — a huge bonus for tenants. If you’re looking for steady rental income with upside potential in a convenient Ashtabula City location, this one is full of opportunity. Bring your vision and make it your next smart investment!
Key facts
- Large driveway
- Plenty of parking
- Detached garage
Tags
Neighborhood map
What this means for you Summary
Snapshot
- This is a 1×3bd/1.0ba + 1×1bd/1.0ba units multifamily listed at $144k.
Deal economics
- At list price, monthly cash flow is $858 ($10k/yr) — positive. Per door: $429/mo.
- The deal already cash-flows at list — no discount required.
- Meets the 1% rule at list price ($2k rent vs $144k).
- Recommended offer: $127k (12.0% below list) — sets the bar for market timing.
- Cap rate 13.4% vs local median 8.2% in Ashtabula — top-decile yield for the area; either an underpriced asset or a hidden risk that comps aren't pricing in. Stress-test before assuming the spread holds.
Location & tenants
- Location reads 71/100 on livability (#420 in OH) — a middle-class / working-renter tenant base. Strengths: cost of living A+, health & safety A+, housing A; Watch: schools C-, amenities F, commute F.
- Ashtabula Area City (town): math 24% / reading 35% proficiency, ranked #588 of 656 in OH (top 90%) — low school quality limits family demand, transient renter base, plan for 1-2y turnover; 63% free/reduced lunch — lower-income household profile, screen leases tightly.
- Market conditions: 162 active listings in the ZIP; 155 units permitted in Ashtabula County in 2024 (0 in 5+ unit buildings).
- At $2,163/mo this rent would consume 52% of the median local household income ($50k/yr) — very limited rent-growth headroom before tenants either downsize or default.
Forward outlook
- Local home prices are declining (-3.0%/yr); year-one equity from $996 of loan paydown is wiped out by about $4k of value loss. Plan a longer hold.
- Ashtabula County population projected at -22% by 2050 — secular population decline; favor cash flow + early exit over multi-decade hold.
- At projected returns (-3.0% appreciation + 3.0% rent growth), your $40k cash investment doubles in ~5 years — after that, you're playing with house money.
Negotiation context
- It's been on market 121 days — a 12% lower offer ($127k) is reasonable based on typical stale-listing flexibility.
- Current owner paid $16k; list at $144k implies a 800% gain — meaningful room to come down on a strong offer.
Risks & watch-outs
- Watch-outs: built in 1890 — expect roof / HVAC / electrical / plumbing capex.
Questions for the listing agent
- It's been on market 121 days. Have you received any prior offers? Is the seller open to a 12% concession, seller financing, or rate buy-down credit?
- Can we see the unit-by-unit rent roll, current vacancy, and any below-market leases? What's the average tenancy length?
- What capital expenditures (roof, boiler, parking lot, exteriors) have been made in the last 5 years, and what's planned in the next 2?
- Built in 1890 — when were the roof, HVAC, electrical panel, plumbing, and water heater last replaced?
- Why hasn't it sold? Are there any deal-killer items the seller is aware of (foundation, flood, title, zoning, code violations)?
- Is there a deadline driving the sale (1031 exchange, divorce, estate, relocation)? That informs how much negotiation room exists.
- What's the average days-on-market for RENTAL listings here right now (not sales)? A rising rental-DOM trend means longer vacancies and softer asking-rent achievability than the comps imply.
- What's the recent tenant-quality profile in this submarket — average credit score on applications, eviction rate, late-payment / NSF rate, and stable-employment percentage? A property-management company in the area should have these aggregated.
- How much new apartment / multifamily construction is in the pipeline within 1–3 miles? Heavy new supply (>2% of stock underway) typically softens rents 12–24 months out; light construction supports rent growth.
Investment metrics
- 1% rule
- 1.50% ✓
- Cap rate
- 13.45%
- Cash-on-cash
- 25.54%
- DSCR
- 2.14
- GRM
- 5.5
CMA / ARV
- ARV (median comp)
- $96,694
- List price
- $144,000
- Delta
- 48.92%
- Verdict
- OVERPRICED
- Comps
- 15 within 1.0 mi
Show comp detail 1 sale within ~0.75 mi
| Address | Dist | Beds/Ba | Sqft | Sold | Price | $/sf | Match |
|---|---|---|---|---|---|---|---|
| 3825 Lake Ave | 0.02mi | 4/2.0 | 1,590 (-8%) | 15mo | $80,000 | $50 | 74 |
Match score weights: distance 35% · size 25% · config 20% · recency 20%. Top-matched comps best support the ARV.
Projected returns pro-forma
-3.0% appreciation · 3.0% rent growth · sell at horizon
- IRR
- 19.1%
- Equity multiple
- 1.78×
- Total profit
- $31,273
- Equity at exit
- $21,471
- IRR
- 27.4%
- Equity multiple
- 3.42×
- Total profit
- $97,392
- Equity at exit
- $12,450
Cash invested: $40,320 (down + closing). Projections, not guarantees.
Landlord ↔ Tenant lean methodology
- Overall (STATE)
- 73 Landlord-Friendly
- State Ohio
- 73 Landlord-Friendly · R+6
- County
- — inherits STATE
- City
- — inherits STATE
ZIP-level market 44004
- Home prices YoY
- -30.5%
- Active inventory
- 162
- Price-to-rent
- 9.3×
Monthly cashflow live
- Estimated rent
- $2,163 medium interval (Pro) →
- Mortgage (P&I)
- −$755
- Tax from tax record
- −$35 /mo · $424/yr
- Insurance
- −$60
- HOA
- −$0
- Vacancy / Maint / Mgmt
- −$454
- Net cashflow
- $858
Break-even live
2-unit breakdown (identical units grouped — click to expand)
| Units | Beds | Baths | Est. rent |
|---|---|---|---|
| 1× unit | 3 | 1 | $1,288 |
| 1× unit | 1 | 1 | $875 |
| Total (2 units) | $2,163 | ||
UW: 25.0% down · 7.5% · 30yr · 1.5% tax · 5.0% vac · 8.0% maint · 8.0% mgmt
Financing live
Cash to close
- Down payment
- $36,000
- Closing costs
- $4,320
- Reserves months
- —
- Total cash needed
- —
Loan-product check · same deal, 3 products live
Conventional
25% down · 7.5% · 30yr
- Down + closing
- —
- Monthly P&I
- —
- Monthly cashflow
- —
- DSCR
- —
- Eligible?
- —
Personal DTI + credit; lowest rate.
DSCR
20% down · 8.5% · 30yr
- Down + closing
- —
- Monthly P&I
- —
- Monthly cashflow
- —
- DSCR
- —
- Eligible?
- —
No personal income docs; deal must DSCR.
Hard money
10% down · 12.0% · 12mo
- Down + closing
- —
- Monthly P&I
- —
- Monthly cashflow
- —
- DSCR
- —
- Eligible?
- —
Short-term bridge; refi at stabilization.
Listing history 17 events
-
2026-06-18days on market $144,000 Active 121 DOM
-
2026-06-17days on market $144,000 Active 120 DOM
-
2026-06-16days on market $144,000 Active 119 DOM
-
2026-06-15days on market $144,000 Active 118 DOM
-
2026-06-13days on market $144,000 Active 116 DOM
-
2026-06-12days on market $144,000 Active 115 DOM
-
2026-06-09days on market $144,000 Active 112 DOM
-
2026-06-08days on market $144,000 Active 111 DOM
-
2026-06-07days on market $144,000 Active 110 DOM
-
2026-06-07days on market $144,000 Active 109 DOM
-
2026-06-04days on market $144,000 Active 106 DOM
-
2026-06-02days on market $144,000 Active 105 DOM
-
2026-06-01days on market $144,000 Active 104 DOM
-
2026-05-31days on market $144,000 Active 103 DOM
-
2026-04-08price $144,000 983-char remark
Show marketing remark (983 chars)
Income-Producing Duplex in Ashtabula City – Investor Opportunity! Located close to shopping, restaurants, schools, parks, and all the everyday amenities Ashtabula City has to offer, this duplex is a solid addition to any investment portfolio. This property features two units: A spacious 3-bedroom, 1-bath A comfortable 1-bedroom, 1-bath Both units are currently rented, providing immediate cash flow from day one. The property does need a little TLC, making it a great opportunity for an investor ready to add value and build equity. The big-ticket item? The roof is only 5 years old, giving peace of mind and saving on major upfront expenses. Outside you’ll find a detached garage and a large driveway with plenty of parking — a huge bonus for tenants. If you’re looking for steady rental income with upside potential in a convenient Ashtabula City location, this one is full of opportunity. Bring your vision and make it your next smart investment!
-
2026-02-18$153,000 Active 983-char remark
Show marketing remark (983 chars)
Income-Producing Duplex in Ashtabula City – Investor Opportunity! Located close to shopping, restaurants, schools, parks, and all the everyday amenities Ashtabula City has to offer, this duplex is a solid addition to any investment portfolio. This property features two units: A spacious 3-bedroom, 1-bath A comfortable 1-bedroom, 1-bath Both units are currently rented, providing immediate cash flow from day one. The property does need a little TLC, making it a great opportunity for an investor ready to add value and build equity. The big-ticket item? The roof is only 5 years old, giving peace of mind and saving on major upfront expenses. Outside you’ll find a detached garage and a large driveway with plenty of parking — a huge bonus for tenants. If you’re looking for steady rental income with upside potential in a convenient Ashtabula City location, this one is full of opportunity. Bring your vision and make it your next smart investment!
-
1990-07-25soldstatus $16,000
ⓘ Source: listings_history table (triggers on properties + properties_extension) + one-shot
backfill from property_details.listing_events for pre-trigger history.
Tax reassessment forecast OH · Partial reset (capped growth)
- Current annual tax
- $424 · $35/mo
- Projected year-2 tax
- $1,335 · $111/mo
- Expected delta
- +$911/yr (+$76/mo · 214.8%)
ⓘ Screening estimate from a state-policy table — verify with the county assessor before closing.
Climate risk First Street
- Flood 1/10 Low FEMA zone X (unshaded) · 0% chance over 30 yrs
- Wildfire 1/10 Low
- Heat 2/10 Low 7 d/yr ≥93°F today · 17 d/yr by 30 yrs out
- Wind 1/10 Low
- Air quality 3/10 Moderate 2 unhealthy d/yr today · 5 by 30 yrs out
Nearby sold comps map
Loading sold comps map…
Walkable amenities ~0.75 mi
Loading nearby amenities…
Taxation est. · year 1
- Rental income
- $25,956
- − Mortgage interest
- −$8,066
- − Property taxes
- −$424
- − Insurance
- −$720
- − Repairs & maintenance
- −$2,076
- − Management
- −$2,076
- − Depreciation
- −$4,189
- Taxable income
- $8,404
- Est. tax owed @ 24.0%
- −$2,017
- After-tax cash flow
- $8,282/yr
For passive investors: Depreciation is non-cash, so a rental often shows a tax loss while cash-flowing — sheltering income. Rental losses are passive: they offset passive income freely, and up to $25,000/yr can offset ordinary (W-2) income if you actively participate and your MAGI is under $100k (phasing out to $0 by $150k); unused losses carry forward. On sale, claimed depreciation is recaptured at up to 25%, and gains may owe capital-gains tax (a 1031 exchange can defer both). Figures are a year-1 estimate at your 24.0% rate — not tax advice; consult a CPA.
Schools (NCES district)
- District
- Ashtabula Area City
- NCES district ID
- 3904351
- Math proficiency
- 24% ▼ -27.00%
- Reading proficiency
- 35% ▼ -13.00%
- Median HH income
- $34,812
- Composite
- 24.3/100
- National rank
- #7712
- State rank
- #588 of 656 in OH
Livability — Ashtabula
- Score
- 71/100
- State rank
- #420
- US rank
- #6883
Category grades
Schools grade is shown separately in the Schools card above.
Census & demographics
- Census place
- Ashtabula, OH
- County
- Ashtabula · 97,617 people
- City population
- 31,076
- Metro
- Cleveland, OH
- Population (ZIP)
- 31,076
- Household income
- $49,507
- Rent vs Own
- Severe rent burden
- 14.1
Population outlook (Ashtabula County) Hauer SSP2
- Today (2025)
- 92,950 people
- By 2030
- 89,146 · -4.1%
- By 2040
- 80,715 · -13.2%
- By 2050
- 72,270 · -22.2%
- By 2075
- 55,780 · -40.0%
- By 2100
- 40,928 · -56.0%
Race, ethnicity, and origin ACS 2023
- Neighborhood character
- Predominantly White (79%)
- Race & ethnicity
- White 79% Hispanic / Latino 9% Two or more races 7% Black 6%
- Hispanic origin (detail)
- Mexican 3% Puerto Rican 5%
- Common ancestry
- Romanian 4% Iranian 2% Slovak 1%
- Foreign-born
- 3% · Canada
- Languages at home
- 94% English-only · Spanish 4%
Political lean MEDSL · Ashtabula
- 2024 margin
- Strong R (+28.4) · D 35.4% · R 63.8%
- 2008→2024 swing
- -41.9pp toward R · 2008: 13.5pp · 2024: -28.4pp
- All cycles
- 2024: R+28.4 2020: R+23.5 2016: R+19.0 2012: D+12.1 2008: D+13.5
Not yet ingested
- Civics
- —
Market trends
- HPI YoY
- ▼ -114.51%
- Current HPI
- 260.7146
- Rent YoY
- —
- Metro
- —
- State GDP YoY
- ▲ 1.98%
- F500 in state
- 48
Industry mix (Fortune 500 HQ in OH)
| Industry | F500 HQs | Revenue |
|---|---|---|
| Insurance | 3 | $145B |
|
||
| Industrial Machinery | 3 | $49B |
|
||
| Financial Services | 3 | $24B |
|
||
| Consumer Goods | 2 | $93B |
|
||
| Aerospace / Defense | 2 | $47B |
|
||
| Utilities | 2 | $33B |
|
||
Price history
+800.0% since first listed3 events — show timeline
- 2026-04-08 Price Changed $144,000 MLSNOW
- 2026-02-18 Listed $153,000 MLSNOW
- 1990-07-25 Sold (Public Records) $16,000 Public Records
Property tax history
-9.1%/yrLatest (2025): $424 · -0.2% YoY. Source: county tax records.
Cash-flow waterfall
monthlySold comps — $/sqft
last 12 mo · ≤1 miLoading sold comps…