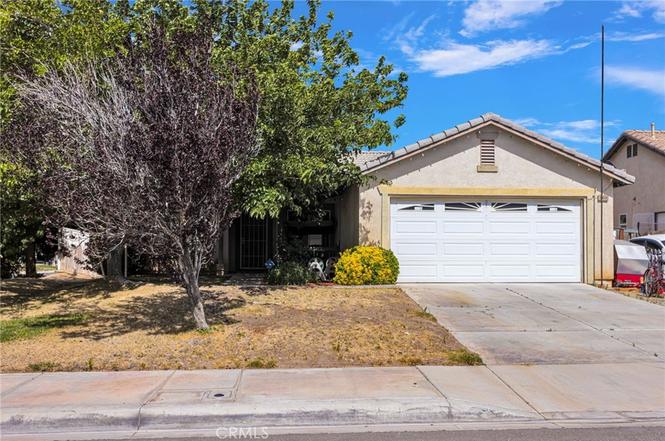
15449 Lassen · Adelanto, CA
Flood risk 1/10 · Minimal
- FEMA flood zone
- D
- Chance of flooding over 30 yrs
- 0.0%
- Est. flood insurance / yr
- $544 – $1,084
Fire risk 5/10 · Moderate
- Est. fire insurance / yr
- $659 – $1,223
Heat risk 7/10 · Major
- Hot days now (above 99°F)
- 3 days/yr
- Hot days in 30 yrs
- 9 days/yr
Wind risk 1/10 · Minimal
- Chance of severe wind over 30 yrs
- —
Air-quality risk 8/10 · Major
- Unhealthy air days now
- 18 days/yr
- Unhealthy air days in 30 yrs
- 23 days/yr
Risk factors via First Street. Map © Google.
Why this score? — see what drove the D grade
The composite is a weighted blend of 9 inputs, each scored 0–100. Each bar is that input's sub-score; the figure is the points it added to the 100-point composite (weight × sub-score).
- ARV discount +11.7/15.0
- Appreciation +10.0/10.0
- Cash flow +7.9/30.0
- Rent growth +3.7/5.0
- Condition / age +2.5/5.0
- Livability +2.4/5.0
- Schools +2.2/10.0
- DSCR +1.9/10.0
- 1% rule +1.5/10.0
$379,999
🖨 Deal sheet (PDF) 📄 Offer letter ✓ Due diligence
Listing remarks
Charming 4-Bedroom Home with Sidewalk-Lined Streets and No HOA! Welcome to this 4-bedroom, 2-bath home offering 1,564 sq. ft. of living space in a desirable neighborhood with sidewalks and no HOA fees. This well-loved home is ready for its next chapter. While it could use a little TLC, it presents a wonderful opportunity for buyers to add their personal touches and make it truly their own. The functional floor plan provides comfortable living spaces, generous bedrooms, and plenty of potential to update and customize to your style. Primary Bedroom Offers His and Hers Walk in Closets. This home also offers an Indoor Laundry area and a spa that is included with the home. Whether you're a firs
Key facts
- Indoor laundry
- No hoa
- 7,200 sq ft lot
Tags
Property features AI
Finance
- Other: Single-unit property; No accessory dwelling unit (ADU)
- HOA & community: Curbs in the community
Exterior
- Parking: Attached garage (2-car) with a single garage door; 4 uncovered parking spaces, total of 6 parking spaces
- Utilities: Public sewer; District/public water; Natural gas connected; Electricity connected; Sewer connected; Water connected
- Home design: House; Single-story; Entry at front; Year built from public records
- Construction: Frame construction; Tile roof; Permanent foundation; Property listed in need of cosmetic repairs
- Exterior features: Screened porch; Front porch; Rear porch; Patio; Paved lot; Front yard; Gentle slope; Has view; No pool
Interior
- Kitchen: Gas range; Gas oven; Dishwasher
- Bedrooms: Four bedrooms on the main level
- Flooring: Tile flooring; Carpet flooring
- Bathrooms: Two full bathrooms
- Heating & cooling: Central cooling; Central furnace heating; Fireplace heating
- Interior features: One-level home with front entry; Main level has 4 bedrooms and 2 bathrooms; Walk-in closet; Family room fireplace; Above-ground spa
- Laundry & utility: Laundry inside the home
Neighborhood map
What this means for you Summary
Snapshot
- This is a 4-bed/2.0-bath single-family listed at $380k.
Deal economics
- At list price, monthly cash flow is $-412 ($-5k/yr) — negative.
- To cash-flow at today's rent, offer at most $307k (19.2% below list).
- To meet the 1% rule (rent ≥ 1% of price), the offer needs to be $249k (34.5% below list).
- Recommended offer: $249k (34.5% below list) — sets the bar for 1% rule.
Location & tenants
- Location reads 47/100 on livability (#1,250 in CA) — a working-class tenant base; expect higher turnover. Strengths: housing A+; Watch: crime D, schools F, amenities F.
- Victor Valley Union High (urban): math 25% / reading 25% proficiency, ranked #407 of 517 in CA (top 79%) — low school quality limits family demand, transient renter base, plan for 1-2y turnover; 72% free/reduced lunch — lower-income household profile, screen leases tightly.
- Market conditions: Rents rising fast (+4.7%/yr); 631 active listings in the ZIP; 4 comparable units currently listed for rent nearby; rentals leasing fast (median 0d on market — plan ~1-2 weeks tenant-placement turnaround); 5,458 units permitted in San Bernardino County in 2024 (1,500 in 5+ unit buildings).
- This rent runs 43% of the median local income ($69k/yr) — at the standard rent-burdened threshold; future hikes will face affordability resistance.
Forward outlook
- In year one you build about $41k of equity ($3k loan paydown + $38k appreciation (10.0% local appreciation)).
- San Bernardino County population projected at +15% by 2050 — modest demand growth; plan on rents tracking national, not racing it.
- By year 2, paydown + projected appreciation supports a ~$65k cash-out refi (75% LTV) — recoverable capital for the next deal without selling this one.
Negotiation context
- Only 11 days on market — expect competitive offers; lowballing is unlikely to land.
Risks & watch-outs
- Climate carrying-cost: moderate wildfire risk; extreme-heat days projected 3→9/yr by 2055 (HVAC capex compounding) — expect insurance premiums to compound above CPI over the hold.
Questions for the listing agent
- What do current leases actually rent for vs. the listed asking? Can we see a recent rent roll and the last 12 months of T-12 income?
- Is there a deadline driving the sale (1031 exchange, divorce, estate, relocation)? That informs how much negotiation room exists.
- Schools are F-rated, which usually means shorter tenancies and higher turnover. Who's the typical renter profile here, and what's been the actual vacancy rate?
- Crime grade is D in this area — have there been break-ins, vandalism, or insurance claims at this property in the last 3 years? What carrier currently insures it and at what premium?
- The area grade is low — what's the realistic commute time and amenity access for the typical tenant pool here? Any planned neighborhood developments (good or bad) we should know about?
- What's the average days-on-market for RENTAL listings here right now (not sales)? A rising rental-DOM trend means longer vacancies and softer asking-rent achievability than the comps imply.
- What's the recent tenant-quality profile in this submarket — average credit score on applications, eviction rate, late-payment / NSF rate, and stable-employment percentage? A property-management company in the area should have these aggregated.
- How much new for-sale + rental construction is in the pipeline within 1–3 miles? Heavy new supply typically softens prices + rents 12–24 months out; constrained supply supports both.
Investment metrics
- 1% rule
- 0.65% ✗
- Cap rate
- 4.99%
- Cash-on-cash
- -4.65%
- DSCR
- 0.79
- GRM
- 12.7
CMA / ARV
- ARV (on-the-fly)
- $419,152
- Comps found
- 12
Show comp detail 12 sales within ~0.75 mi
| Address | Dist | Beds/Ba | Sqft | Sold | Price | $/sf | Match |
|---|---|---|---|---|---|---|---|
| 11840 Marshall | 0.08mi | 4/2.0 | 1,564 (0%) | 1mo | $395,000 | $253 | 95 |
| 11843 Desert Gln | 0.46mi | 3/2.0 (-1) | 1,549 (-1%) | 1mo | $389,000 | $251 | 71 |
| 11771 Dana Dr | 0.26mi | 4/2.0 | 1,728 (+10%) | 1mo | $463,000 | $268 | 69 |
| 11537 Winter Pl | 0.51mi | 4/2.0 | 1,647 (+5%) | 1mo | $425,000 | $258 | 66 |
| 11461 Charlotte | 0.74mi | 3/2.0 (-1) | 1,556 (-0%) | 2mo | $415,000 | $267 | 58 |
| 11504 Star St | 0.54mi | 4/2.0 | 1,400 (-10%) | 3mo | $390,000 | $279 | 54 |
| 11493 Golden St | 0.47mi | 3/2.5 (-1) | 1,403 (-10%) | 2mo | $447,500 | $319 | 52 |
| 11660 Desert Fls | 0.57mi | 3/2.0 (-1) | 1,425 (-9%) | 3mo | $390,000 | $274 | 51 |
| 11843 Broad Oak Ct | 0.61mi | 4/2.0 | 1,756 (+12%) | 2mo | $433,000 | $247 | 50 |
| 11534 Charm Ln | 0.63mi | 3/2.0 (-1) | 1,416 (-10%) | 4mo | $405,000 | $286 | 47 |
| 11780 Poppy Rd | 0.58mi | 3/2.0 (-1) | 1,756 (+12%) | 3mo | $425,000 | $242 | 45 |
| 11721 Virginia | 0.61mi | 4/2.0 | 1,338 (-14%) | 3mo | $400,000 | $299 | 44 |
Match score weights: distance 35% · size 25% · config 20% · recency 20%. Top-matched comps best support the ARV.
Projected returns pro-forma
10.0% appreciation · 4.68% rent growth · sell at horizon
- IRR
- 21.4%
- Equity multiple
- 2.74×
- Total profit
- $184,883
- Equity at exit
- $342,333
- IRR
- 19.7%
- Equity multiple
- 6.40×
- Total profit
- $574,147
- Equity at exit
- $738,254
Cash invested: $106,400 (down + closing). Projections, not guarantees.
Landlord ↔ Tenant lean methodology
- Overall (STATE)
- 18 Strongly Tenant-Friendly
- State California
- 18 Strongly Tenant-Friendly · D+13
- County
- — inherits STATE
- City
- — inherits STATE
ZIP-level market 92301
- Home prices YoY
- 10.0%
- Rents YoY
- 4.7%
- Active inventory
- 631
- Price-to-rent
- 12.7×
Monthly cashflow live
- Estimated rent
- $2,489 medium interval (Pro) →
- Mortgage (P&I)
- −$1,993
- Tax from tax record
- −$227 /mo · $2,723/yr
- Insurance
- −$158
- HOA
- −$0
- Vacancy / Maint / Mgmt
- −$523
- Net cashflow
- $-412
Break-even live
Sensitivity live
| Price | -10% $-197 | -5% $-304 | +0% $-412 | +5% $-519 | +10% $-627 |
|---|---|---|---|---|---|
| Rent | -10% $-609 | -5% $-510 | +0% $-412 | +5% $-314 | +10% $-215 |
| Rate | -1.0pp $-221 | -0.5pp $-315 | base $-412 | +0.5pp $-510 | +1.0pp $-611 |
UW: 25.0% down · 7.5% · 30yr · 1.5% tax · 5.0% vac · 8.0% maint · 8.0% mgmt
Financing live
Cash to close
- Down payment
- $95,000
- Closing costs
- $11,400
- Reserves months
- —
- Total cash needed
- —
Loan-product check · same deal, 3 products live
Conventional
25% down · 7.5% · 30yr
- Down + closing
- —
- Monthly P&I
- —
- Monthly cashflow
- —
- DSCR
- —
- Eligible?
- —
Personal DTI + credit; lowest rate.
DSCR
20% down · 8.5% · 30yr
- Down + closing
- —
- Monthly P&I
- —
- Monthly cashflow
- —
- DSCR
- —
- Eligible?
- —
No personal income docs; deal must DSCR.
Hard money
10% down · 12.0% · 12mo
- Down + closing
- —
- Monthly P&I
- —
- Monthly cashflow
- —
- DSCR
- —
- Eligible?
- —
Short-term bridge; refi at stabilization.
Rent comps 4 comps
| Address | Beds | Baths | Sqft | Rent | $/sqft | DOM | Units | Dist |
|---|---|---|---|---|---|---|---|---|
| 11860 Lupin Rd Adelanto, CA | 4.0 | 2.0 | 1902 | $2,350 | $1.24 | 21d | 1 | 0.12mi |
| 11739 Galewood St Adelanto, CA | 3.0 | 2.0 | 1756 | $2,250 | $1.28 | 0d | 1 | 0.68mi |
| 11028 Pemberton Way Adelanto, CA | 3.0 | 2.0 | 1126 | $2,000 | $1.78 | 0d | 1 | 1.23mi |
| 14513 Palm St Adelanto, CA | 3.0 | 2.0 | 1500 | $2,300 | $1.53 | 0d | 1 | 1.27mi |
Listing history 7 events
-
2026-06-21days on market $379,999 Active 11 DOM
-
2026-06-18days on market $379,999 Active 8 DOM
-
2026-06-17days on market $379,999 Active 7 DOM
-
2026-06-16days on market $379,999 Active 6 DOM
-
2026-06-15days on market $379,999 Active 5 DOM
-
2026-06-13remarks 699-char remark
-
2026-06-13$379,999 Active 3 DOM
ⓘ Source: listings_history table (triggers on properties + properties_extension) + one-shot
backfill from property_details.listing_events for pre-trigger history.
Tax reassessment forecast CA · Resets to sale price
- Current annual tax
- $2,723 · $227/mo
- Projected year-2 tax
- $2,888 · $241/mo
- Expected delta
- +$165/yr (+$14/mo · 6.1%)
ⓘ Screening estimate from a state-policy table — verify with the county assessor before closing.
Climate risk First Street
- Flood 1/10 Low FEMA zone D · 0% chance over 30 yrs
- Wildfire 5/10 Major
- Heat 7/10 Severe 3 d/yr ≥99°F today · 9 d/yr by 30 yrs out
- Wind 1/10 Low
- Air quality 8/10 Severe 18 unhealthy d/yr today · 23 by 30 yrs out
Nearby sold comps map
Loading sold comps map…
Walkable amenities ~0.75 mi
Loading nearby amenities…
Taxation est. · year 1
- Rental income
- $29,864
- − Mortgage interest
- −$21,286
- − Property taxes
- −$2,723
- − Insurance
- −$1,900
- − Repairs & maintenance
- −$2,389
- − Management
- −$2,389
- − Depreciation
- −$11,055
- Taxable loss
- −$11,877
- Est. tax savings @ 24.0%
- +$2,851
- After-tax cash flow
- $-2,093/yr
For passive investors: Depreciation is non-cash, so a rental often shows a tax loss while cash-flowing — sheltering income. Rental losses are passive: they offset passive income freely, and up to $25,000/yr can offset ordinary (W-2) income if you actively participate and your MAGI is under $100k (phasing out to $0 by $150k); unused losses carry forward. On sale, claimed depreciation is recaptured at up to 25%, and gains may owe capital-gains tax (a 1031 exchange can defer both). Figures are a year-1 estimate at your 24.0% rate — not tax advice; consult a CPA.
Schools (NCES district)
- District
- Victor Valley Union High
- NCES district ID
- 0636972
- Math proficiency
- 25% ▲ 6.00%
- Reading proficiency
- 25% ▼ -12.00%
- Median HH income
- $45,112
- Composite
- 21.6/100
- National rank
- #8296
- State rank
- #407 of 517 in CA
Livability — Adelanto
- Score
- 47/100
- State rank
- #1250
- US rank
- #26338
Category grades
Schools grade is shown separately in the Schools card above.
Census & demographics
- Census place
- Adelanto, CA
- County
- San Bernardino County · 2,030,291 people
- City population
- 38,577
- Metro
- Riverside-San Bernardino-Ontario, CA
- Population (ZIP)
- 38,577
- Household income
- $68,676
- Rent vs Own
- Severe rent burden
- 1345.0
Population outlook (San Bernardino County) Hauer SSP2
- Today (2025)
- 2,300,329 people
- By 2030
- 2,378,907 · +3.4%
- By 2040
- 2,523,137 · +9.7%
- By 2050
- 2,642,388 · +14.9%
- By 2075
- 2,880,769 · +25.2%
- By 2100
- 2,909,436 · +26.5%
Race, ethnicity, and origin ACS 2023
- Neighborhood character
- Predominantly Hispanic (69%)
- Race & ethnicity
- Hispanic / Latino 69% Two or more races 34% Black 15% White 9% Asian 2% Native American 1%
- Hispanic origin (detail)
- Mexican 58%
- Foreign-born
- 18% · Canada
- Languages at home
- 52% English-only · Spanish 46%
Political lean MEDSL · San Bernardino
- 2024 margin
- Toss-up / Even · D 47.5% · R 49.7% · Other 2.8%
- 2008→2024 swing
- -8.5pp toward R · 2008: 6.3pp · 2024: -2.1pp
- All cycles
- 2024: R+2.1 2020: D+10.7 2016: D+9.8 2012: D+5.4 2008: D+6.3
Not yet ingested
- Civics
- —
Market trends
- HPI YoY
- ▲ 41.09%
- Current HPI
- 453.6071
- Rent YoY
- ▲ 4.68%
- Metro
- Riverside-San Bernardino-Ontario, CA
- State GDP YoY
- ▲ 3.21%
- F500 in state
- 116
Industry mix (Fortune 500 HQ in CA)
| Industry | F500 HQs | Revenue |
|---|---|---|
| Technology | 27 | $1,492B |
|
||
| Financial Services | 3 | $174B |
|
||
| Retail | 3 | $44B |
|
||
| Insurance | 3 | $26B |
|
||
| Media / Entertainment | 2 | $115B |
|
||
| Pharmaceuticals / Biotech | 2 | $62B |
|
||
Price history
1 event — show timeline
- 2026-06-10 Listed $379,999 CRMLS
Property tax history
+2.8%/yrLatest (2025): $2,723 · +8.3% YoY. Source: county tax records.
Cash-flow waterfall
monthlySold comps — $/sqft
last 12 mo · ≤1 miLoading sold comps…