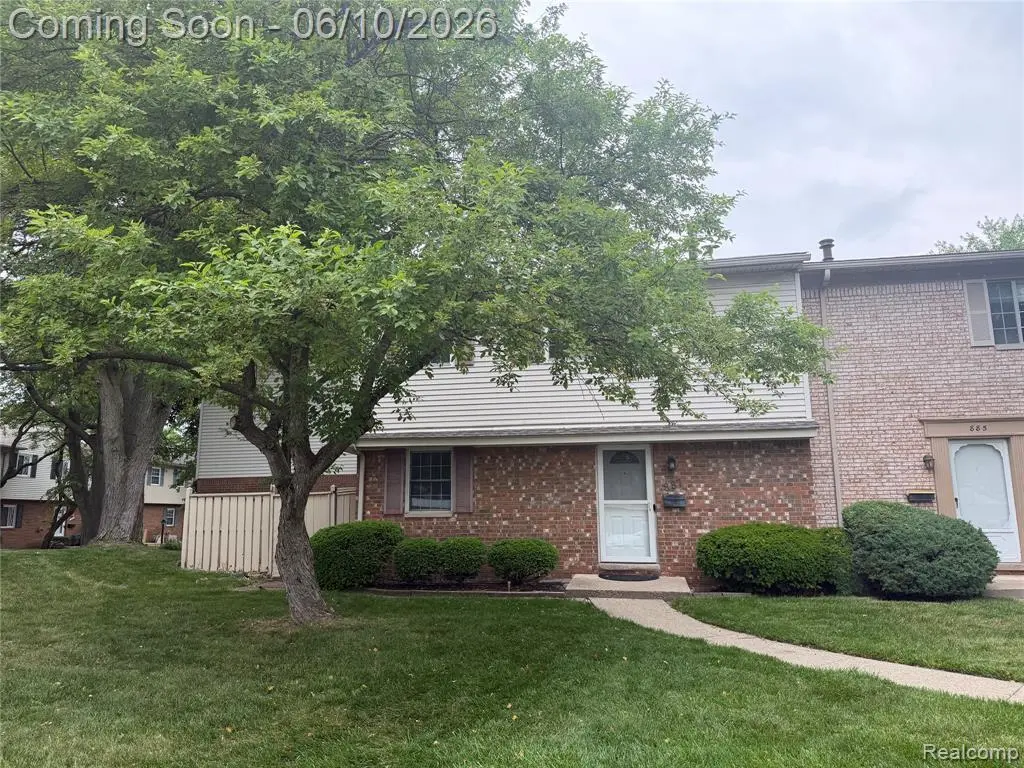
877 Kirts Blvd · Troy, MI
Flood risk 6/10 · Moderate
- FEMA flood zone
- AE
- Chance of flooding over 30 yrs
- 0.72%
- Est. flood insurance / yr
- $2,026 – $9,024
Fire risk 1/10 · Minimal
- Est. fire insurance / yr
- $784 – $1,456
Heat risk 3/10 · Minor
- Hot days now (above 97°F)
- 7 days/yr
- Hot days in 30 yrs
- 15 days/yr
Wind risk 2/10 · Minimal
- Chance of severe wind over 30 yrs
- —
Air-quality risk 3/10 · Minor
- Unhealthy air days now
- 2 days/yr
- Unhealthy air days in 30 yrs
- 5 days/yr
Risk factors via First Street. Map © Google.
Why this score? — see what drove the C grade
The composite is a weighted blend of 9 inputs, each scored 0–100. Each bar is that input's sub-score; the figure is the points it added to the 100-point composite (weight × sub-score).
- Cash flow +17.5/30.0
- ARV discount +7.5/15.0
- Schools +6.5/10.0
- 1% rule +5.6/10.0
- DSCR +5.4/10.0
- Appreciation +5.0/10.0
- Livability +3.9/5.0
- Rent growth +2.5/5.0
- Condition / age +2.5/5.0
$249,900
🖨 Deal sheet (PDF) 📄 Offer letter ✓ Due diligence
Listing remarks MLS
SPECTACULAR CONDO IN AWSOME LOCATION FOR EASYACCES TO I-75. HOME HAS 2 VERY SPACIOUS BD RMS. BOTH INCL. PRIVATE BTH RMS. FIN. BSMNT. UPDATESINCLUDE:A/C-99,HWTH-00,NEWER CARP. THROUGHOUT3 CEILING FANS AND APPL.
Key facts
- $350 HOA
- 2 parking spots
- Pool
Property features AI
Finance
- Other: Pets allowed; Located in the city of Troy (Courtwood Villa subdivision); Directions: South of Big Beaver, between Crooks and Livernois
- HOA & community: Monthly association fee of $350; Association covers lawn maintenance, snow removal, trash removal, water/sewer, exterior maintenance; Community clubhouse available; Association phone available
Exterior
- Parking: Carport; Space for 2 vehicles
- Utilities: Public water; Public sewer (included in association fee); Electric service (standard); Natural gas
- Home design: Condominium; 2-story structure; Built in 1973
- Construction: Basement foundation
- Exterior features: Brick and wood exterior; Fenced yard; Patio; Private paved road access; Outdoor pool on property
Interior
- Kitchen: Entry-level kitchen (16 x 7) with ceramic flooring; Includes dishwasher, microwave, refrigerator
- Bedrooms: Primary bedroom on second floor (15 x 14) with carpet; Second bedroom on second floor (15 x 11) with carpet
- Flooring: Carpet in family room and living room; Carpet in bedrooms; Ceramic flooring in kitchen and bathrooms
- Bathrooms: Two full bathrooms (both on second floor) and one entry-level lavatory; Ceramic flooring in bathrooms and lavatory
- Heating & cooling: Forced air heating; Natural gas fuel; Central air conditioning and ceiling fans; Gas water heater
- Interior features: Total of 8 rooms; Finished basement
- Laundry & utility: Washer and dryer included
Neighborhood map
What this means for you Summary
Snapshot
- This is a 2-bed/2.5-bath condo listed at $250k.
Deal economics
- At list price, monthly cash flow is $-270 ($-3k/yr) — negative.
- To cash-flow at today's rent, offer at most $202k (19.1% below list).
- Meets the 1% rule at list price ($3k rent vs $250k).
- Recommended offer: $202k (19.1% below list) — sets the bar for cash-flow.
- Cap rate 7.2% vs local median 3.6% in Troy — top-decile yield for the area; either an underpriced asset or a hidden risk that comps aren't pricing in. Stress-test before assuming the spread holds.
Location & tenants
- Location reads 78/100 on livability (#113 in MI, #2,684 nationally) — a middle-class / working-renter tenant base. Strengths: employment A+, housing A+, crime A; Watch: health & safety D+, amenities F, commute F.
- Troy School District (urban): math 68% / reading 75% proficiency, ranked #8 of 540 in MI (top 2%) — strong family-tenant draw, lease renewals of 3-5y typical; only 10% free/reduced lunch — higher-income household profile.
- Zoned schools: Morse Elementary School (math 42% / reading 42%, grade F, #547 of 1,397 statewide, top 41%, 405 students, 42% FRL); Baker Middle School (math 65% / reading 83%, grade A, #17 of 493 statewide, top 3%, 626 students, 26% FRL); Troy High School (math 77% / reading 87%, grade A, #4 of 713 statewide, top 1%, 2,094 students, 13% FRL) — zoned schools average 27% FRL vs 10% district-wide (17 pts higher); higher-poverty schools than district average — tighter screening recommended.
- Market conditions: 1 active listings in the ZIP; 11 comparable units currently listed for rent nearby; rentals leasing fast (median 4d on market — plan ~1-2 weeks tenant-placement turnaround); 2,614 units permitted in Oakland County in 2024 (721 in 5+ unit buildings).
Forward outlook
- In year one you build about $9k of equity ($2k loan paydown + $7k appreciation (3.0% local appreciation)).
- Oakland County population projected at +10% by 2050 — modest demand growth; plan on rents tracking national, not racing it.
- By year 4, paydown + projected appreciation supports a ~$31k cash-out refi (75% LTV) — recoverable capital for the next deal without selling this one.
Negotiation context
- Only 1 days on market — expect competitive offers; lowballing is unlikely to land.
- Current owner paid $150k; list at $250k implies a 67% gain — meaningful room to come down on a strong offer.
Risks & watch-outs
- Watch-outs: flood insurance adds $460/mo.
- Climate carrying-cost: in FEMA flood zone AE (mandatory federal flood insurance) — expect insurance premiums to compound above CPI over the hold.
Questions for the listing agent
- What do current leases actually rent for vs. the listed asking? Can we see a recent rent roll and the last 12 months of T-12 income?
- Built in 1973 — when were the roof, HVAC, electrical panel, plumbing, and water heater last replaced?
- What's the actual annual flood-insurance premium (NFIP or private), and is the property in a SFHA with mandatory coverage?
- What does the HOA fee cover, when was the last increase, and are there any pending special assessments or reserve-fund shortfalls?
- Any open or pending special assessments — roof, HVAC, plumbing, elevator, façade? What's the per-unit balance and payoff schedule, and is the seller paying it off at close or rolling it to the buyer?
- Is there a deadline driving the sale (1031 exchange, divorce, estate, relocation)? That informs how much negotiation room exists.
- Schools are A-rated — typically a magnet for longer-tenancy family renters. What's the average tenant stay here, and is there a school-zone premium baked into asking?
- What's the average days-on-market for RENTAL listings here right now (not sales)? A rising rental-DOM trend means longer vacancies and softer asking-rent achievability than the comps imply.
- What's the recent tenant-quality profile in this submarket — average credit score on applications, eviction rate, late-payment / NSF rate, and stable-employment percentage? A property-management company in the area should have these aggregated.
- How much new apartment / multifamily construction is in the pipeline within 1–3 miles? Heavy new supply (>2% of stock underway) typically softens rents 12–24 months out; light construction supports rent growth.
Investment metrics
- 1% rule
- 1.06% ✓
- Cap rate
- 7.21%
- Cash-on-cash
- 3.26%
- DSCR
- 1.14
- GRM
- 7.9
CMA / ARV
No comps found within radius.
Projected returns pro-forma
3.0% appreciation · 3.0% rent growth · sell at horizon
- IRR
- 3.3%
- Equity multiple
- 1.19×
- Total profit
- $13,302
- Equity at exit
- $112,366
- IRR
- 6.7%
- Equity multiple
- 2.03×
- Total profit
- $72,119
- Equity at exit
- $173,169
Cash invested: $69,972 (down + closing). Projections, not guarantees.
Landlord ↔ Tenant lean methodology
- Overall (STATE)
- 62 Landlord-Friendly
- State Michigan
- 62 Landlord-Friendly · EVEN
- County
- — inherits STATE
- City
- — inherits STATE
ZIP-level market 48084 4857
- Active inventory
- 1
- Price-to-rent
- 7.9×
Monthly cashflow live
- Estimated rent
- $2,637 high interval (Pro) →
- Mortgage (P&I)
- −$1,311
- Tax from tax record
- −$128 /mo · $1,541/yr
- Insurance
- −$104
- Flood insurance flood zone
- −$460 /mo · $5,525/yr
- HOA
- −$350
- Vacancy / Maint / Mgmt
- −$554
- Net cashflow
- $-270
Break-even live
Sensitivity live
| Price | -10% $-129 | -5% $-200 | +0% $-270 | +5% $-341 | +10% $-412 |
|---|---|---|---|---|---|
| Rent | -10% $-479 | -5% $-375 | +0% $-270 | +5% $-166 | +10% $-62 |
| Rate | -1.0pp $-145 | -0.5pp $-207 | base $-270 | +0.5pp $-335 | +1.0pp $-401 |
UW: 25.0% down · 7.5% · 30yr · 1.5% tax · 5.0% vac · 8.0% maint · 8.0% mgmt
Financing live
Cash to close
- Down payment
- $62,475
- Closing costs
- $7,497
- Reserves months
- —
- Total cash needed
- —
Loan-product check · same deal, 3 products live
Conventional
25% down · 7.5% · 30yr
- Down + closing
- —
- Monthly P&I
- —
- Monthly cashflow
- —
- DSCR
- —
- Eligible?
- —
Personal DTI + credit; lowest rate.
DSCR
20% down · 8.5% · 30yr
- Down + closing
- —
- Monthly P&I
- —
- Monthly cashflow
- —
- DSCR
- —
- Eligible?
- —
No personal income docs; deal must DSCR.
Hard money
10% down · 12.0% · 12mo
- Down + closing
- —
- Monthly P&I
- —
- Monthly cashflow
- —
- DSCR
- —
- Eligible?
- —
Short-term bridge; refi at stabilization.
Rent comps 11 comps
| Address | Beds | Baths | Sqft | Rent | $/sqft | DOM | Units | Dist |
|---|---|---|---|---|---|---|---|---|
| 2690 Crooks Rd Troy, MI | 1.0–2.0 | 1.0–2.0 | 1259 | $2,635 | $2.09 | 0d | 1 | 0.38mi |
| 2751 Melcombe Cir Troy, MI | 1.0–3.0 | 1.0–2.5 | 1687 | $2,644 | $1.57 | 0d | 31 | 0.62mi |
| 1911 Golfview Dr Troy, MI | 1.0–3.0 | 1.0–2.0 | 1300 | $1,910 | $1.47 | 0d | 18 | 0.66mi |
| 2845 Summers Pl Troy, MI | 3.0 | 2.5 | 1665 | $3,600 | $2.16 | 45d | 1 | 0.70mi |
| 173 Algansee Dr Troy, MI | 3.0 | 2.0 | 1290 | $2,200 | $1.71 | 19d | 1 | 0.83mi |
| 3165 Alpine Rd Troy, MI | 3.0 | 1.5 | 2154 | $2,300 | $1.07 | 26d | 1 | 1.01mi |
| 3668 Old Creek Rd Unit 0 Troy, MI | 3.0 | 3.0 | 1600 | $2,700 | $1.69 | 26d | 1 | 1.08mi |
| 3965 Westcreek Dr Troy, MI | 2.0 | 2.0 | 1150 | $2,360 | $2.05 | 4d | 6 | 1.38mi |
| 1976 Ridge Ct Royal Oak, MI | 2.0 | 1.5 | 1929 | $2,500 | $1.30 | 3d | 1 | 1.40mi |
| 516 N Main St Clawson, MI | 2.0 | 2.0 | 1515 | $2,986 | $1.97 | 0d | 1 | 1.45mi |
| 710 Hartland Dr Troy, MI | 3.0 | 2.0 | 1760 | $2,875 | $1.63 | 7d | 1 | 1.49mi |
HOA detail condo
- Monthly dues
- $350 · $4,200/yr
- Assessments
- None detected in remarks — confirm with the listing agent.
Listing history 2 events
-
2026-06-08remarks 691-char remark
-
2026-06-08$249,900 Coming Soon 1 DOM
ⓘ Source: listings_history table (triggers on properties + properties_extension) + one-shot
backfill from property_details.listing_events for pre-trigger history.
Tax reassessment forecast MI · Partial reset (capped growth)
- Current annual tax
- $1,541 · $128/mo
- Projected year-2 tax
- $2,695 · $225/mo
- Expected delta
- +$1,154/yr (+$96/mo · 74.9%)
ⓘ Screening estimate from a state-policy table — verify with the county assessor before closing.
Climate risk First Street
- Flood 6/10 Major FEMA zone AE · 72% chance over 30 yrs
- Wildfire 1/10 Low
- Heat 3/10 Moderate 7 d/yr ≥97°F today · 15 d/yr by 30 yrs out
- Wind 2/10 Low
- Air quality 3/10 Moderate 2 unhealthy d/yr today · 5 by 30 yrs out
Nearby sold comps map
Loading sold comps map…
Walkable amenities ~0.75 mi
Loading nearby amenities…
Taxation est. · year 1
- Rental income
- $31,640
- − Mortgage interest
- −$13,998
- − Property taxes
- −$1,541
- − Insurance
- −$6,775
- − Repairs & maintenance
- −$2,531
- − Management
- −$2,531
- − HOA
- −$4,200
- − Depreciation
- −$7,270
- Taxable loss
- −$7,206
- Est. tax savings @ 24.0%
- +$1,729
- After-tax cash flow
- $-1,516/yr
For passive investors: Depreciation is non-cash, so a rental often shows a tax loss while cash-flowing — sheltering income. Rental losses are passive: they offset passive income freely, and up to $25,000/yr can offset ordinary (W-2) income if you actively participate and your MAGI is under $100k (phasing out to $0 by $150k); unused losses carry forward. On sale, claimed depreciation is recaptured at up to 25%, and gains may owe capital-gains tax (a 1031 exchange can defer both). Figures are a year-1 estimate at your 24.0% rate — not tax advice; consult a CPA.
Schools (NCES district)
- District
- Troy School District
- NCES district ID
- 2634260
- Math proficiency
- 68% ▼ -3.00%
- Reading proficiency
- 75% ▼ -2.00%
- Median HH income
- $90,920
- Composite
- 64.5/100
- National rank
- #539
- State rank
- #8 of 540 in MI
Livability — Troy
- Score
- 78/100
- State rank
- #113
- US rank
- #2684
Category grades
Schools grade is shown separately in the Schools card above.
Census & demographics
- Census place
- Troy, MI
Population outlook (Oakland County) Hauer SSP2
- Today (2025)
- 1,335,747 people
- By 2030
- 1,375,100 · +2.9%
- By 2040
- 1,435,385 · +7.5%
- By 2050
- 1,469,250 · +10.0%
- By 2075
- 1,531,946 · +14.7%
- By 2100
- 1,450,485 · +8.6%
Not yet ingested
- Political lean
- —
- Race & ethnicity
- —
- Common origin
- —
- Civics
- —
Market trends
- HPI YoY
- —
- Current HPI
- —
- Rent YoY
- —
- Metro
- —
- State GDP YoY
- ▲ 1.37%
- F500 in state
- 28
Industry mix (Fortune 500 HQ in MI)
| Industry | F500 HQs | Revenue |
|---|---|---|
| Automotive Parts | 3 | $48B |
|
||
| Automotive | 2 | $372B |
|
||
| Chemicals | 1 | $45B |
|
||
| Automotive Retail | 1 | $29B |
|
||
| Healthcare / Medical Devices | 1 | $23B |
|
||
| Automotive Technology | 1 | $20B |
|
||
Price history
+216.3% since first listed8 events — show timeline
- 2026-06-09 Price Changed $249,900 MiRealSource-MiMLS
- 2026-06-08 Price Changed $249,900 REALCOMP
- 2026-06-08 Coming Soon $245,000 MiRealSource-MiMLS
- 2002-01-23 Sold (Public Records) $150,000 Public Records
- 2001-11-30 Sold (MLS) $150,000 MiRealSource-MiMLS
- 2001-10-29 Listing Removed — MiRealSource-MiMLS
- 2001-05-24 Listed $152,900 MiRealSource-MiMLS
- 1993-07-12 Sold (Public Records) $79,000 Public Records
Property tax history
+2.1%/yrLatest (2025): $1,541 · +2.3% YoY. Source: county tax records.
Cash-flow waterfall
monthlySold comps — $/sqft
last 12 mo · ≤1 miLoading sold comps…