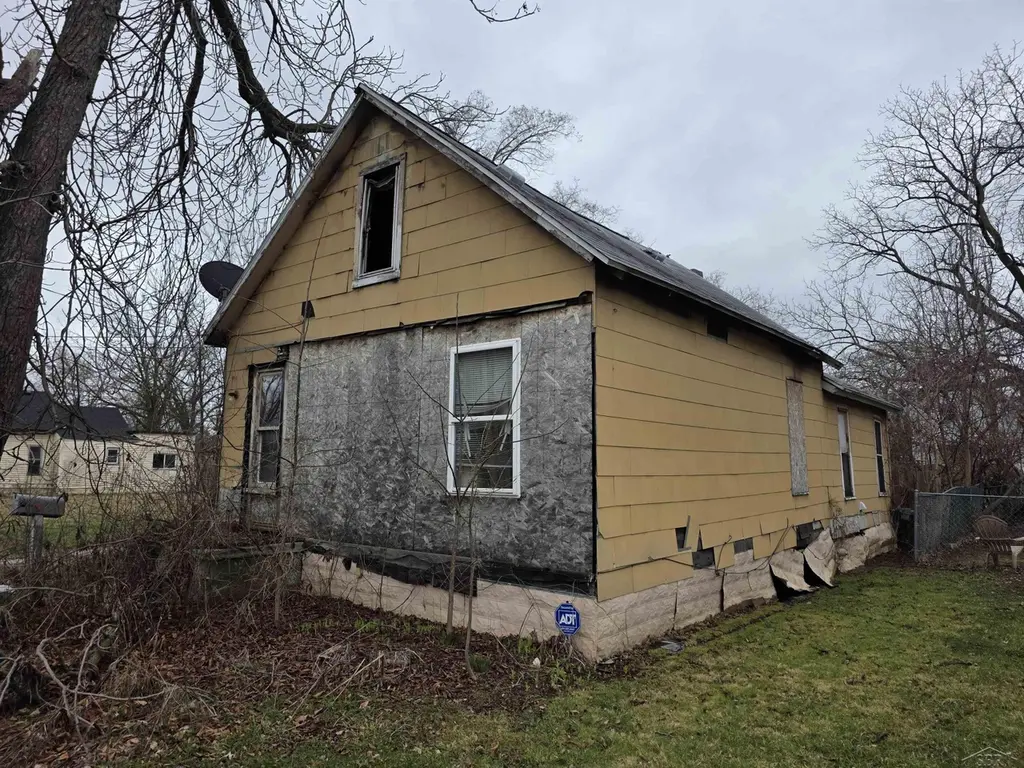
2617 Eddy St · Saginaw, MI
Flood risk 1/10 · Minimal
- FEMA flood zone
- X (unshaded)
- Chance of flooding over 30 yrs
- 0.0%
- Est. flood insurance / yr
- $507 – $1,088
Fire risk 1/10 · Minimal
- Est. fire insurance / yr
- $784 – $1,456
Heat risk 2/10 · Minimal
- Hot days now (above 99°F)
- 7 days/yr
- Hot days in 30 yrs
- 14 days/yr
Wind risk 1/10 · Minimal
- Chance of severe wind over 30 yrs
- —
Air-quality risk 2/10 · Minimal
- Unhealthy air days now
- 1 days/yr
- Unhealthy air days in 30 yrs
- 2 days/yr
Risk factors via First Street. Map © Google.
Why this score? — see what drove the D grade
The composite is a weighted blend of 9 inputs, each scored 0–100. Each bar is that input's sub-score; the figure is the points it added to the 100-point composite (weight × sub-score).
- Cash flow +15.0/30.0
- ARV discount +7.5/15.0
- 1% rule +5.0/10.0
- DSCR +5.0/10.0
- Rent growth +3.5/5.0
- Livability +3.2/5.0
- Condition / age +2.5/5.0
- Schools +2.0/10.0
- Appreciation +0.0/10.0
$9,995
🖨 Deal sheet (PDF) 📄 Offer letter ✓ Due diligence
Listing remarks MLS
City of Saginaw bungalow in need of total renovation. Conveniently located near the highway and upcoming Riverfront developments.
Key facts
- Total renovation
- Near the highway
- 3,485 sq ft lot
Tags
Property features AI
Finance
- HOA & community: Homeowners association present
Exterior
- Utilities: Public water available; Public sewer available
- Home design: Single-family residence; One level
- Construction: Asbestos construction material
- Exterior features: Lot dimensions approximately 30 x 120
Interior
- Bathrooms: 1 full bathroom
- Heating & cooling: No heating; No cooling
- Interior features: 4 total rooms; Basement present
Neighborhood map
What this means for you Summary
Snapshot
- This is a 3-bed/1.0-bath single-family listed at $10k.
Deal economics
- At list price, monthly cash flow is $756 ($9k/yr) — positive.
- The deal already cash-flows at list — no discount required.
- Meets the 1% rule at list price ($1k rent vs $10k).
- Recommended offer: $9k (6.0% below list) — sets the bar for market timing.
- Cap rate 97.0% vs local median 7.8% in Saginaw — top-decile yield for the area; either an underpriced asset or a hidden risk that comps aren't pricing in. Stress-test before assuming the spread holds.
Location & tenants
- Location reads 63/100 on livability (#521 in MI) — a middle-class / working-renter tenant base. Strengths: cost of living A+, housing A+, health & safety A+; Watch: crime F, amenities F, commute F.
- Saginaw School District (urban): math 20% / reading 29% proficiency, ranked #444 of 540 in MI (top 82%) — low school quality limits family demand, transient renter base, plan for 1-2y turnover; 76% free/reduced lunch — lower-income household profile, screen leases tightly.
- Zoned schools: Thompson Middle School (math 6% / reading 13%, grade F, #479 of 493 statewide, top 97%, 397 students, 93% FRL) — zoned schools average 93% FRL vs 76% district-wide (17 pts higher); higher-poverty schools than district average — tighter screening recommended.
- Zoned-school proficiency averages 10% at this address vs 24% district-wide (-15 pts) — the specific schools serving this property underperform the Saginaw School District average; the district grade overstates school quality for this exact location.
- Market conditions: Rents rising (+4.0%/yr); 250 active listings in the ZIP; 154 units permitted in Saginaw County in 2024 (0 in 5+ unit buildings).
Forward outlook
- Local home prices are declining (-3.0%/yr); year-one equity from $69 of loan paydown is wiped out by about $300 of value loss. Plan a longer hold.
- Saginaw County population projected at -25% by 2050 — secular population decline; favor cash flow + early exit over multi-decade hold.
- At projected returns (-3.0% appreciation + 4.0% rent growth), your $3k cash investment doubles in ~1 year — after that, you're playing with house money.
Negotiation context
- It's been on market 77 days — a 6% lower offer ($9k) is reasonable based on typical stale-listing flexibility.
- 4 sale attempts since 16y ago; this cycle's ask has dropped $5k (33%) from the opening price — seller is motivated, your offer sets the floor, not the list.
- Current owner paid $6k; list at $10k implies a 67% gain — meaningful room to come down on a strong offer.
Risks & watch-outs
- Watch-outs: built in 1894 — expect roof / HVAC / electrical / plumbing capex.
Questions for the listing agent
- It's been on market 77 days. Have you received any prior offers? Is the seller open to a 6% concession, seller financing, or rate buy-down credit?
- Built in 1894 — when were the roof, HVAC, electrical panel, plumbing, and water heater last replaced?
- Why hasn't it sold? Are there any deal-killer items the seller is aware of (foundation, flood, title, zoning, code violations)?
- Is there a deadline driving the sale (1031 exchange, divorce, estate, relocation)? That informs how much negotiation room exists.
- Schools are F-rated, which usually means shorter tenancies and higher turnover. Who's the typical renter profile here, and what's been the actual vacancy rate?
- Crime grade is F in this area — have there been break-ins, vandalism, or insurance claims at this property in the last 3 years? What carrier currently insures it and at what premium?
- The area grade is low — what's the realistic commute time and amenity access for the typical tenant pool here? Any planned neighborhood developments (good or bad) we should know about?
- What's the average days-on-market for RENTAL listings here right now (not sales)? A rising rental-DOM trend means longer vacancies and softer asking-rent achievability than the comps imply.
- What's the recent tenant-quality profile in this submarket — average credit score on applications, eviction rate, late-payment / NSF rate, and stable-employment percentage? A property-management company in the area should have these aggregated.
- How much new for-sale + rental construction is in the pipeline within 1–3 miles? Heavy new supply typically softens prices + rents 12–24 months out; constrained supply supports both.
Investment metrics
- 1% rule
- 10.44% ✓
- Cap rate
- 97.03%
- Cash-on-cash
- 324.07%
- DSCR
- 15.42
- GRM
- 0.8
CMA / ARV
- ARV (on-the-fly)
- $76,330
- Comps found
- 12
Show comp detail 12 sales within ~0.75 mi
| Address | Dist | Beds/Ba | Sqft | Sold | Price | $/sf | Match |
|---|---|---|---|---|---|---|---|
| 2558 N Bond St | 0.41mi | 3/1.0 | 888 (-1%) | 14mo | $80,000 | $90 | 68 |
| 626 Stoker Dr | 0.34mi | 3/1.0 | 1,012 (+13%) | 1mo | $65,000 | $64 | 62 |
| 2312 Durand St | 0.59mi | 2/1.0 (-1) | 849 (-6%) | 4mo | $24,750 | $29 | 55 |
| 587 Meadowlawn St | 0.74mi | 3/1.0 | 925 (+3%) | 7mo | $127,000 | $137 | 55 |
| 2222 Benjamin St | 0.47mi | 2/1.0 (-1) | 944 (+5%) | 12mo | $83,000 | $88 | 54 |
| 2439 Hermansau St | 0.24mi | 3/1.5 | 1,030 (+15%) | 10mo | $33,000 | $32 | 54 |
| 3034 N Michigan Ave | 0.47mi | 2/2.0 (-1) | 848 (-6%) | 10mo | $105,000 | $124 | 52 |
| 2918 Jackson St | 0.39mi | 2/1.0 (-1) | 810 (-10%) | 14mo | $39,000 | $48 | 49 |
| 2022 Benjamin St | 0.57mi | 3/1.0 | 1,016 (+13%) | 4mo | $35,000 | $34 | 48 |
| 2459 Benjamin St | 0.39mi | 2/1.0 (-1) | 1,023 (+14%) | 8mo | $50,000 | $49 | 47 |
| 2408 N Mason St | 0.61mi | 3/1.0 | 987 (+10%) | 11mo | $129,900 | $132 | 46 |
| 2529 N BOND St | 0.43mi | 2/1.0 (-1) | 763 (-15%) | 6mo | $65,000 | $85 | 44 |
Match score weights: distance 35% · size 25% · config 20% · recency 20%. Top-matched comps best support the ARV.
Projected returns pro-forma
-3.0% appreciation · 3.98% rent growth · sell at horizon
- IRR
- —
- Equity multiple
- 18.00×
- Total profit
- $47,572
- Equity at exit
- $1,490
- IRR
- —
- Equity multiple
- 39.53×
- Total profit
- $107,821
- Equity at exit
- $864
Cash invested: $2,799 (down + closing). Projections, not guarantees.
Landlord ↔ Tenant lean methodology
- Overall (STATE)
- 62 Landlord-Friendly
- State Michigan
- 62 Landlord-Friendly · EVEN
- County
- — inherits STATE
- City
- — inherits STATE
ZIP-level market 48602
- Home prices YoY
- -19.7%
- Rents YoY
- 4.0%
- Active inventory
- 250
- Price-to-rent
- 0.8×
Monthly cashflow live
- Estimated rent
- $1,044 medium interval (Pro) →
- Mortgage (P&I)
- −$52
- Tax from tax record
- −$12 /mo · $144/yr
- Insurance
- −$4
- HOA
- −$0
- Vacancy / Maint / Mgmt
- −$219
- Net cashflow
- $756
Break-even live
Sensitivity live
| Price | -10% $761 | -5% $759 | +0% $756 | +5% $753 | +10% $750 |
|---|---|---|---|---|---|
| Rent | -10% $673 | -5% $715 | +0% $756 | +5% $797 | +10% $838 |
| Rate | -1.0pp $761 | -0.5pp $758 | base $756 | +0.5pp $753 | +1.0pp $751 |
UW: 25.0% down · 7.5% · 30yr · 1.5% tax · 5.0% vac · 8.0% maint · 8.0% mgmt
Financing live
Cash to close
- Down payment
- $2,499
- Closing costs
- $300
- Reserves months
- —
- Total cash needed
- —
Loan-product check · same deal, 3 products live
Conventional
25% down · 7.5% · 30yr
- Down + closing
- —
- Monthly P&I
- —
- Monthly cashflow
- —
- DSCR
- —
- Eligible?
- —
Personal DTI + credit; lowest rate.
DSCR
20% down · 8.5% · 30yr
- Down + closing
- —
- Monthly P&I
- —
- Monthly cashflow
- —
- DSCR
- —
- Eligible?
- —
No personal income docs; deal must DSCR.
Hard money
10% down · 12.0% · 12mo
- Down + closing
- —
- Monthly P&I
- —
- Monthly cashflow
- —
- DSCR
- —
- Eligible?
- —
Short-term bridge; refi at stabilization.
Listing history 31 events
-
2026-06-19days on market $9,995 Active 77 DOM
-
2026-06-18days on market $9,995 Active 76 DOM
-
2026-06-17days on market $9,995 Active 75 DOM
-
2026-06-16days on market $9,995 Active 74 DOM
-
2026-06-15days on market $9,995 Active 73 DOM
-
2026-06-14days on market $9,995 Active 71 DOM
-
2026-06-12days on market $9,995 Active 70 DOM
-
2026-06-09days on market $9,995 Active 67 DOM
-
2026-06-08days on market $9,995 Active 66 DOM
-
2026-06-07days on market $9,995 Active 65 DOM
-
2026-06-05pricedays on market $9,995 Active 62 DOM
-
2026-06-03days on market $11,000 Active 61 DOM
-
2026-06-02days on market $11,000 Active 60 DOM
-
2026-06-01days on market $11,000 Active 59 DOM
-
2026-05-31days on market $11,000 Active 58 DOM
-
2026-05-30days on market $11,000 Active 57 DOM
-
2026-05-23price $11,000 129-char remark
Show marketing remark (129 chars)
City of Saginaw bungalow in need of total renovation. Conveniently located near the highway and upcoming Riverfront developments.
-
2026-05-22price $11,000
-
2026-05-07price $12,500 129-char remark
Show marketing remark (129 chars)
City of Saginaw bungalow in need of total renovation. Conveniently located near the highway and upcoming Riverfront developments.
-
2026-05-06price $12,500
-
2026-04-23price $13,500 129-char remark
Show marketing remark (129 chars)
City of Saginaw bungalow in need of total renovation. Conveniently located near the highway and upcoming Riverfront developments.
-
2026-04-22price $13,500
-
2026-04-03$15,000 Active 129-char remark
Show marketing remark (129 chars)
City of Saginaw bungalow in need of total renovation. Conveniently located near the highway and upcoming Riverfront developments.
-
2026-04-03$15,000 Active
Show marketing remark (129 chars)
City of Saginaw bungalow in need of total renovation. Conveniently located near the highway and upcoming Riverfront developments.
-
2010-04-23soldstatus $6,000 83-char remark
Show marketing remark (83 chars)
3 Bedroom Saginaw Home. Sold 'as is'. Verification of funds needed with all offers.
-
2010-04-23soldstatus $6,000
Show marketing remark (83 chars)
3 Bedroom Saginaw Home. Sold 'as is'. Verification of funds needed with all offers.
-
2010-04-21historical 83-char remark
Show marketing remark (83 chars)
3 Bedroom Saginaw Home. Sold 'as is'. Verification of funds needed with all offers.
-
2010-03-01$6,000 83-char remark
Show marketing remark (83 chars)
3 Bedroom Saginaw Home. Sold 'as is'. Verification of funds needed with all offers.
-
2010-03-01$6,000
Show marketing remark (83 chars)
3 Bedroom Saginaw Home. Sold 'as is'. Verification of funds needed with all offers.
-
2006-02-22soldstatus $34,874
-
2006-02-22soldstatus $24,274
ⓘ Source: listings_history table (triggers on properties + properties_extension) + one-shot
backfill from property_details.listing_events for pre-trigger history.
Tax reassessment forecast MI · Partial reset (capped growth)
- Current annual tax
- $144 · $12/mo
- Projected year-2 tax
- $149 · $12/mo
- Expected delta
- +$5/yr ($0/mo · 3.4%)
ⓘ Screening estimate from a state-policy table — verify with the county assessor before closing.
Climate risk First Street
- Flood 1/10 Low FEMA zone X (unshaded) · 0% chance over 30 yrs
- Wildfire 1/10 Low
- Heat 2/10 Low 7 d/yr ≥99°F today · 14 d/yr by 30 yrs out
- Wind 1/10 Low
- Air quality 2/10 Low 1 unhealthy d/yr today · 2 by 30 yrs out
Nearby sold comps map
Loading sold comps map…
Walkable amenities ~0.75 mi
Loading nearby amenities…
Taxation est. · year 1
- Rental income
- $12,522
- − Mortgage interest
- −$560
- − Property taxes
- −$144
- − Insurance
- −$50
- − Repairs & maintenance
- −$1,002
- − Management
- −$1,002
- − Depreciation
- −$291
- Taxable income
- $9,474
- Est. tax owed @ 24.0%
- −$2,274
- After-tax cash flow
- $6,796/yr
For passive investors: Depreciation is non-cash, so a rental often shows a tax loss while cash-flowing — sheltering income. Rental losses are passive: they offset passive income freely, and up to $25,000/yr can offset ordinary (W-2) income if you actively participate and your MAGI is under $100k (phasing out to $0 by $150k); unused losses carry forward. On sale, claimed depreciation is recaptured at up to 25%, and gains may owe capital-gains tax (a 1031 exchange can defer both). Figures are a year-1 estimate at your 24.0% rate — not tax advice; consult a CPA.
Schools (NCES district)
- District
- Saginaw School District
- NCES district ID
- 2630390
- Math proficiency
- 20% ▼ -5.00%
- Reading proficiency
- 29% ▼ -3.00%
- Median HH income
- $28,940
- Composite
- 19.6/100
- National rank
- #8755
- State rank
- #444 of 540 in MI
Livability — Saginaw
- Score
- 63/100
- State rank
- #521
- US rank
- #15424
Category grades
Schools grade is shown separately in the Schools card above.
Census & demographics
- Census place
- Saginaw, MI
- County
- Saginaw County · 54,884 people
- City population
- 54,884
- Metro
- Saginaw, MI
- Population (ZIP)
- 27,127
- Household income
- $46,984
- Rent vs Own
- Severe rent burden
- 1416.0
Population outlook (Saginaw County) Hauer SSP2
- Today (2025)
- 180,568 people
- By 2030
- 172,302 · -4.6%
- By 2040
- 153,919 · -14.8%
- By 2050
- 135,519 · -24.9%
- By 2075
- 97,199 · -46.2%
- By 2100
- 65,037 · -64.0%
Race, ethnicity, and origin ACS 2023
- Neighborhood character
- Diverse neighborhood (Simpson 0.64)
- Race & ethnicity
- White 50% Black 27% Hispanic / Latino 17% Two or more races 12%
- Hispanic origin (detail)
- Mexican 14% Puerto Rican 1%
- Common ancestry
- Romanian 4% Lithuanian 3% Italian 2%
- Foreign-born
- 1% · Canada
- Languages at home
- 96% English-only · Spanish 3%
Political lean MEDSL · Saginaw
- 2024 margin
- Toss-up / Even · D 47.7% · R 51.0% · Other 1.4%
- 2008→2024 swing
- -20.6pp toward R · 2008: 17.3pp · 2024: -3.3pp
- All cycles
- 2024: R+3.3 2020: D+0.3 2016: R+1.1 2012: D+11.9 2008: D+17.3
Not yet ingested
- Civics
- —
Market trends
- HPI YoY
- ▼ -39.15%
- Current HPI
- 159.8807
- Rent YoY
- ▲ 3.98%
- Metro
- Saginaw, MI
- State GDP YoY
- ▲ 1.37%
- F500 in state
- 28
Industry mix (Fortune 500 HQ in MI)
| Industry | F500 HQs | Revenue |
|---|---|---|
| Automotive Parts | 3 | $48B |
|
||
| Automotive | 2 | $372B |
|
||
| Chemicals | 1 | $45B |
|
||
| Automotive Retail | 1 | $29B |
|
||
| Healthcare / Medical Devices | 1 | $23B |
|
||
| Automotive Technology | 1 | $20B |
|
||
Price history
-68.5% since first listed15 events — show timeline
- 2026-05-23 Price Changed $11,000 MiRealSource-MiMLS
- 2026-05-22 Price Changed $11,000 REALCOMP
- 2026-05-07 Price Changed $12,500 MiRealSource-MiMLS
- 2026-05-06 Price Changed $12,500 REALCOMP
- 2026-04-23 Price Changed $13,500 MiRealSource-MiMLS
- 2026-04-22 Price Changed $13,500 REALCOMP
- 2026-04-03 Listed $15,000 REALCOMP
- 2026-04-03 Listed $15,000 MiRealSource-MiMLS
- 2010-04-23 Sold (MLS) $6,000 REALCOMP
- 2010-04-23 Sold (MLS) $6,000 MiRealSource-MiMLS
- 2010-04-21 Listing Removed — MiRealSource-MiMLS
- 2010-03-01 Listed $6,000 REALCOMP
- 2010-03-01 Listed $6,000 MiRealSource-MiMLS
- 2006-02-22 Sold (Public Records) $24,274 Public Records
- 2006-02-22 Sold (Public Records) $34,874 Public Records
Property tax history
-9.1%/yrLatest (2025): $144 · -16.3% YoY. Source: county tax records.
Cash-flow waterfall
monthlySold comps — $/sqft
last 12 mo · ≤1 miLoading sold comps…