 🔨 Auction
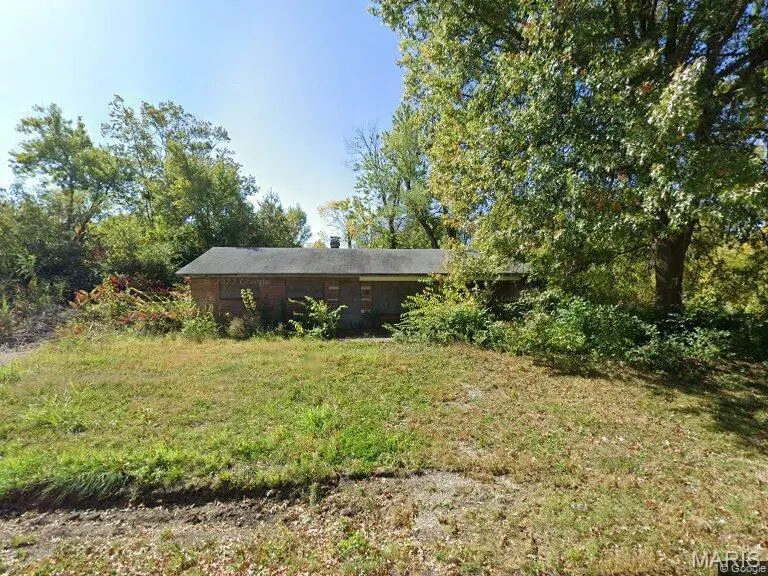
11 Gladys Dr · Sauget, IL
Flood risk 1/10 · Minimal
- FEMA flood zone
- X (shaded)
- Chance of flooding over 30 yrs
- 0.0%
- Est. flood insurance / yr
- $507 – $1,088
Fire risk 1/10 · Minimal
- Est. fire insurance / yr
- $804 – $1,492
Heat risk 5/10 · Moderate
- Hot days now (above 107°F)
- 7 days/yr
- Hot days in 30 yrs
- 21 days/yr
Wind risk 2/10 · Minimal
- Chance of severe wind over 30 yrs
- 1.0%
Air-quality risk 3/10 · Minor
- Unhealthy air days now
- 3 days/yr
- Unhealthy air days in 30 yrs
- 4 days/yr
Risk factors via First Street. Map © Google.
Why this score? — see what drove the B- grade
The composite is a weighted blend of 9 inputs, each scored 0–100. Each bar is that input's sub-score; the figure is the points it added to the 100-point composite (weight × sub-score).
- Cash flow +30.0/30.0
- 1% rule +10.0/10.0
- DSCR +10.0/10.0
- ARV discount +7.5/15.0
- Livability +3.2/5.0
- Rent growth +2.5/5.0
- Condition / age +2.5/5.0
- Schools +0.6/10.0
- Appreciation +0.0/10.0
$12,000
🖨 Deal sheet 📄 Offer letter ✓ Due diligence
Listing remarks MLS
This Property will be auctioned on Auction.com - please go to the website, register an account and submit your offer(s). Listed as "11 Gladys Dr Sauget, IL 62206" on Auction.com CAHOKIA RANCH! Estimated as 3 Beds & 2 Full Baths - huge advantage in this price range! 1,560 sq ft. Two full baths maximize appeal and support premium rental rates. Cahokia shows consistently strong median values for renovated homes. Built 1957 in established neighborhood with municipal services. Perfect for flippers targeting Cahokia market, buy-and-hold rental investors seeking strong amenity packages, contractors. The 2-bathroom configuration differentiates this property and accelerates sales timeline. Exterior showing (curb viewing) only. NO inside showings available, no more inside pictures available. No contingencies will be accepted. Cash sale only. Sold "where is and as is" No Survey or Keys Provided. Interior Access for Home Inspections Will Not Be Granted. Listing Information May Not Be Accurate. Buyers Must Do Their Own Due Diligence to Verify Number of Beds, Baths, Square Footage, Room Sizes, Lot Size & Any Other Property Details. Photos, Marketing Comments, and Due Diligence Items are Provided for Guidance Purposes Only. By Making an Offer on This Property, the Buyer Represents They Have Independently Verified All Information and Have Made the Decision to Make an Offer Based Upon Their Own Investigation.
Key facts
- Two full baths
- Renovated homes
- Cahokia ranch
Tags
Neighborhood map
What this means for you Summary
Snapshot
- This is a 3-bed/2.0-bath land listed at $12k.
Deal economics
- At list price, monthly cash flow is $842 ($10k/yr) — positive.
- The deal already cash-flows at list — no discount required.
- Meets the 1% rule at list price ($2k rent vs $12k).
- Recommended offer: $11k (12.0% below list) — sets the bar for market timing.
Location & tenants
- Location reads 63/100 on livability (#774 in IL) — a middle-class / working-renter tenant base. Strengths: commute A+, cost of living A+, housing A+; Watch: schools F, crime F, amenities F.
- Cahokia CUSD 187 (suburban): math 3% / reading 5% proficiency, ranked #864 of 919 in IL (top 94%) — low school quality limits family demand, transient renter base, plan for 1-2y turnover; 85% free/reduced lunch — lower-income household profile, screen leases tightly.
- Market conditions: 153 active listings in the ZIP; 2 comparable units currently listed for rent nearby; lower-income renter base — watch delinquency; 783 units permitted in St. Clair County in 2024 (378 in 5+ unit buildings).
- At $1,608/mo this rent would consume 57% of the median local household income ($34k/yr) (locally 729% of renters already pay >50% of income on rent) — very limited rent-growth headroom before tenants either downsize or default.
Forward outlook
- Local home prices are declining (-3.0%/yr); year-one equity from $476 of loan paydown is wiped out by about $2k of value loss. Plan a longer hold.
- St. Clair County population projected at -23% by 2050 — secular population decline; favor cash flow + early exit over multi-decade hold.
- At projected returns (-3.0% appreciation + 3.0% rent growth), your $19k cash investment doubles in ~3 years — after that, you're playing with house money.
Negotiation context
- It's been on market 147 days — a 12% lower offer ($11k) is reasonable based on typical stale-listing flexibility.
Risks & watch-outs
- Watch-outs: property tax is 3.8% of price; built in 1957 — expect roof / HVAC / electrical / plumbing capex.
- Climate carrying-cost: extreme-heat days projected 7→21/yr by 2055 (HVAC capex compounding) — expect insurance premiums to compound above CPI over the hold.
Questions for the listing agent
- It's been on market 147 days. Have you received any prior offers? Is the seller open to a 12% concession, seller financing, or rate buy-down credit?
- Built in 1957 — when were the roof, HVAC, electrical panel, plumbing, and water heater last replaced?
- Property tax is high relative to price — has the assessment been appealed recently, and will the sale trigger a re-assessment?
- Why hasn't it sold? Are there any deal-killer items the seller is aware of (foundation, flood, title, zoning, code violations)?
- Is there a deadline driving the sale (1031 exchange, divorce, estate, relocation)? That informs how much negotiation room exists.
- Schools are F-rated, which usually means shorter tenancies and higher turnover. Who's the typical renter profile here, and what's been the actual vacancy rate?
- Crime grade is F in this area — have there been break-ins, vandalism, or insurance claims at this property in the last 3 years? What carrier currently insures it and at what premium?
- What's the average days-on-market for RENTAL listings here right now (not sales)? A rising rental-DOM trend means longer vacancies and softer asking-rent achievability than the comps imply.
- What's the recent tenant-quality profile in this submarket — average credit score on applications, eviction rate, late-payment / NSF rate, and stable-employment percentage? A property-management company in the area should have these aggregated.
- How much new for-sale + rental construction is in the pipeline within 1–3 miles? Heavy new supply typically softens prices + rents 12–24 months out; constrained supply supports both.
Investment metrics
- 1% rule
- 2.33% ✓
- Cap rate
- 20.94%
- Cash-on-cash
- 52.31%
- DSCR
- 3.33
- GRM
- 3.6
CMA / ARV
- ARV (median comp)
- $68,953
- List price
- $12,000
- Delta
- -82.60%
- Verdict
- UNDERPRICED
- Comps
- 20 within 1.0 mi
Projected returns pro-forma
-3.0% appreciation · 3.0% rent growth · sell at horizon
- IRR
- 50.3%
- Equity multiple
- 3.20×
- Total profit
- $42,429
- Equity at exit
- $10,281
- IRR
- 55.7%
- Equity multiple
- 6.49×
- Total profit
- $105,953
- Equity at exit
- $5,962
Cash invested: $19,307 (down + closing). Projections, not guarantees.
Landlord ↔ Tenant lean methodology
- Overall (STATE)
- 43 Moderately Tenant-Leaning
- State Illinois
- 43 Moderately Tenant-Leaning · D+7
- County
- — inherits STATE
- City
- — inherits STATE
ZIP-level market 62206
- Home prices YoY
- -20.2%
- Active inventory
- 153
- Price-to-rent
- 0.6×
Monthly cashflow live
- Estimated rent
- $1,608 medium interval (Pro) →
- Mortgage (P&I)
- −$362
- Tax from tax record
- −$38 /mo · $456/yr
- Insurance
- −$29
- HOA
- −$0
- Vacancy / Maint / Mgmt
- −$338
- Net cashflow
- $842
Break-even live
UW: 25.0% down · 7.5% · 30yr · 1.5% tax · 5.0% vac · 8.0% maint · 8.0% mgmt
Financing live
Cash to close
- Down payment
- $17,238
- Closing costs
- $2,069
- Reserves months
- —
- Total cash needed
- —
Loan-product check · same deal, 3 products live
Conventional
25% down · 7.5% · 30yr
- Down + closing
- —
- Monthly P&I
- —
- Monthly cashflow
- —
- DSCR
- —
- Eligible?
- —
Personal DTI + credit; lowest rate.
DSCR
20% down · 8.5% · 30yr
- Down + closing
- —
- Monthly P&I
- —
- Monthly cashflow
- —
- DSCR
- —
- Eligible?
- —
No personal income docs; deal must DSCR.
Hard money
10% down · 12.0% · 12mo
- Down + closing
- —
- Monthly P&I
- —
- Monthly cashflow
- —
- DSCR
- —
- Eligible?
- —
Short-term bridge; refi at stabilization.
Rent comps 2 comps
| Address | Beds | Baths | Sqft | Rent | $/sqft | DOM | Units | Dist |
|---|---|---|---|---|---|---|---|---|
| 8 Louise Ln East Saint Louis, IL | 3.0 | 1.0 | 1150 | $1,275 | $1.11 | 17d | 1 | 0.65mi |
| 32 Drexel Dr East Saint Louis, IL | 4.0 | 1.0 | 1362 | $1,675 | $1.23 | 16d | 1 | 1.13mi |
Listing history 15 events
-
2026-06-18days on market $12,000 Active 147 DOM
-
2026-06-17days on market $12,000 Active 146 DOM
-
2026-06-16days on market $12,000 Active 145 DOM
-
2026-06-15days on market $12,000 Active 144 DOM
-
2026-06-13days on market $12,000 Active 142 DOM
-
2026-06-13days on market $12,000 Active 141 DOM
-
2026-06-09days on market $12,000 Active 138 DOM
-
2026-06-08days on market $12,000 Active 137 DOM
-
2026-06-07days on market $12,000 Active 136 DOM
-
2026-06-05days on market $12,000 Active 133 DOM
-
2026-06-03days on market $12,000 Active 132 DOM
-
2026-06-02days on market $12,000 Active 131 DOM
-
2026-06-01days on market $12,000 Active 130 DOM
-
2026-05-31days on market $12,000 Active 129 DOM
-
2026-01-22$12,000 Active 1443-char remark
Show marketing remark (1443 chars)
This Property will be auctioned on Auction.com - please go to the website, register an account and submit your offer(s). Listed as "11 Gladys Dr Sauget, IL 62206" on Auction.com CAHOKIA RANCH! Estimated as 3 Beds & 2 Full Baths - huge advantage in this price range! 1,560 sq ft. Two full baths maximize appeal and support premium rental rates. Cahokia shows consistently strong median values for renovated homes. Built 1957 in established neighborhood with municipal services. Perfect for flippers targeting Cahokia market, buy-and-hold rental investors seeking strong amenity packages, contractors. The 2-bathroom configuration differentiates this property and accelerates sales timeline. Exterior showing (curb viewing) only. NO inside showings available, no more inside pictures available. No contingencies will be accepted. Cash sale only. Sold "where is and as is" No Survey or Keys Provided. Interior Access for Home Inspections Will Not Be Granted. Listing Information May Not Be Accurate. Buyers Must Do Their Own Due Diligence to Verify Number of Beds, Baths, Square Footage, Room Sizes, Lot Size & Any Other Property Details. Photos, Marketing Comments, and Due Diligence Items are Provided for Guidance Purposes Only. By Making an Offer on This Property, the Buyer Represents They Have Independently Verified All Information and Have Made the Decision to Make an Offer Based Upon Their Own Investigation.
ⓘ Source: listings_history table (triggers on properties + properties_extension) + one-shot
backfill from property_details.listing_events for pre-trigger history.
Tax reassessment forecast IL · Partial reset (capped growth)
- Current annual tax
- $456 · $38/mo
- Projected year-2 tax
- $456 · $38/mo
- Expected delta
- $0/yr ($0/mo · 0.0%)
ⓘ Screening estimate from a state-policy table — verify with the county assessor before closing.
Climate risk First Street
- Flood 1/10 Low FEMA zone X (shaded) · 0% chance over 30 yrs
- Wildfire 1/10 Low
- Heat 5/10 Major 7 d/yr ≥107°F today · 21 d/yr by 30 yrs out
- Wind 2/10 Low 100% chance of damaging wind over 30 yrs
- Air quality 3/10 Moderate 3 unhealthy d/yr today · 4 by 30 yrs out
Nearby sold comps map
Loading sold comps map…
Walkable amenities ~0.75 mi
Loading nearby amenities…
Taxation est. · year 1
- Rental income
- $19,292
- − Mortgage interest
- −$3,862
- − Property taxes
- −$456
- − Insurance
- −$345
- − Repairs & maintenance
- −$1,543
- − Management
- −$1,543
- − Depreciation
- −$2,006
- Taxable income
- $9,536
- Est. tax owed @ 24.0%
- −$2,289
- After-tax cash flow
- $7,812/yr
For passive investors: Depreciation is non-cash, so a rental often shows a tax loss while cash-flowing — sheltering income. Rental losses are passive: they offset passive income freely, and up to $25,000/yr can offset ordinary (W-2) income if you actively participate and your MAGI is under $100k (phasing out to $0 by $150k); unused losses carry forward. On sale, claimed depreciation is recaptured at up to 25%, and gains may owe capital-gains tax (a 1031 exchange can defer both). Figures are a year-1 estimate at your 24.0% rate — not tax advice; consult a CPA.
Schools (NCES district)
- District
- Cahokia CUSD 187
- NCES district ID
- 1708040
- Math proficiency
- 3% ▼ -2.00%
- Reading proficiency
- 5% ▬ 0.00%
- Median HH income
- $28,028
- Composite
- 6.44/100
- National rank
- #14827
- State rank
- #864 of 919 in IL
Livability — Sauget
- Score
- 63/100
- State rank
- #774
- US rank
- #15488
Category grades
Schools grade is shown separately in the Schools card above.
Census & demographics
- County
- Saint Clair County · 169,691 people
- City population
- 19,956
- Metro
- St. Louis, MO-IL
- Population (ZIP)
- 12,959
- Household income
- $33,838
- Rent vs Own
- Severe rent burden
- 729.0
Population outlook (St. Clair County) Hauer SSP2
- Today (2025)
- 250,366 people
- By 2030
- 240,511 · -3.9%
- By 2040
- 217,391 · -13.2%
- By 2050
- 192,699 · -23.0%
- By 2075
- 140,637 · -43.8%
- By 2100
- 100,499 · -59.9%
Race, ethnicity, and origin ACS 2023
- Neighborhood character
- Diverse neighborhood (Simpson 0.56)
- Race & ethnicity
- Black 59% White 29% Two or more races 6% Hispanic / Latino 3% Asian 2%
- Common ancestry
- Romanian 2% Lithuanian 1% Iranian 1%
- Foreign-born
- 2% · China
- Languages at home
- 95% English-only · Spanish 3% Other Indo-European 1% Chinese 1%
Political lean MEDSL · St. Clair
- 2024 margin
- Lean D (+7.9) · D 53.0% · R 45.1% · Other 1.8%
- 2008→2024 swing
- -14.6pp toward R · 2008: 22.4pp · 2024: 7.9pp
- All cycles
- 2024: D+7.9 2020: D+8.7 2016: D+5.6 2012: D+14.5 2008: D+22.4
Not yet ingested
- Civics
- —
Market trends
- HPI YoY
- ▼ -33.26%
- Current HPI
- 131.5144
- Rent YoY
- —
- Metro
- St. Louis, MO-IL
- State GDP YoY
- ▲ 1.59%
- F500 in state
- 60
Industry mix (Fortune 500 HQ in IL)
| Industry | F500 HQs | Revenue |
|---|---|---|
| Insurance | 4 | $201B |
|
||
| Consumer Goods | 4 | $87B |
|
||
| Industrial Machinery | 3 | $64B |
|
||
| Healthcare | 2 | $55B |
|
||
| Retail / Pharmacy | 1 | $148B |
|
||
| Agriculture / Food | 1 | $86B |
|
||
Price history
1 event — show timeline
- 2026-01-22 Listed $12,000 MARIS as Distributed by MLS Grid
Property tax history
+13.8%/yrLatest (2023): $456 · +16.7% YoY. Source: county tax records.
Cash-flow waterfall
monthlySold comps — $/sqft
last 12 mo · ≤1 miLoading sold comps…