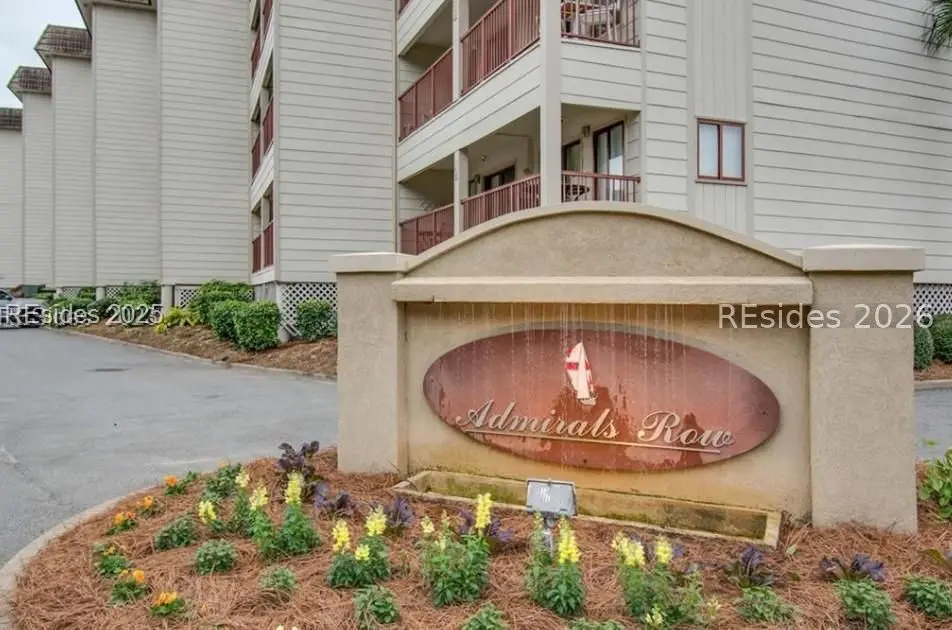
40 Folly Field Rd #330 · Hilton Head Island, SC
Flood risk No data
- FEMA flood zone
- —
- Chance of flooding over 30 yrs
- —
- Est. flood insurance / yr
- —
Fire risk No data
- Est. fire insurance / yr
- —
Heat risk No data
- Hot days now (above threshold)
- —
- Hot days in 30 yrs
- —
Wind risk No data
- Chance of severe wind over 30 yrs
- —
Air-quality risk No data
- Unhealthy air days now
- —
- Unhealthy air days in 30 yrs
- —
Risk factors via First Street. Map © Google.
Why this score? — see what drove the F grade
The composite is a weighted blend of 9 inputs, each scored 0–100. Each bar is that input's sub-score; the figure is the points it added to the 100-point composite (weight × sub-score).
- ARV discount +7.0/15.0
- Appreciation +6.6/10.0
- Cash flow +4.2/30.0
- Schools +4.1/10.0
- Rent growth +3.3/5.0
- Livability +3.2/5.0
- Condition / age +2.5/5.0
- 1% rule +2.3/10.0
- DSCR +0.0/10.0
$399,000
🖨 Deal sheet (PDF) 📄 Offer letter ✓ Due diligence
Listing remarks MLS
330 Admirals Rοw iѕ the bеѕt-priсеd 2-bedroom oceanview сοndo currently available on all of Hilton Head Island - period. Not just in Admirals Row, but island-wide. If you've been waiting for the right oceanview opportunity at the right price, this is it. Used exclusively as a private beach getaway for the past 25 years. The villa shows minimal wear and has been well cared for throughout. Move in and enjoy immediately, or take advantage of the thoughtful pricing to make updates over time and create your own coastal retreat. Located in a premier oceanfront resort with multiple pools, tennis courts, 12 brand-new pickleball courts, restaurants, playground, fitness center, and 24-hour security.
Key facts
- Pickleball courts
- Tennis courts
- Oceanview condo
Tags
Neighborhood map
What this means for you Summary
Snapshot
- This is a 2-bed/2.0-bath condo listed at $399k.
Deal economics
- At list price, monthly cash flow is $-1k ($-13k/yr) — negative.
- To cash-flow at today's rent, offer at most $351k (11.9% below list).
- To meet the 1% rule (rent ≥ 1% of price), the offer needs to be $292k (26.8% below list).
- Recommended offer: $292k (26.8% below list) — sets the bar for 1% rule.
Location & tenants
- Location reads 64/100 on livability (#157 in SC) — a middle-class / working-renter tenant base. Strengths: employment A+, crime A-; Watch: amenities F, commute F, cost of living F.
- Beaufort 01 (town): math 42% / reading 51% proficiency, ranked #17 of 80 in SC (top 21%) — families likely to look elsewhere, expect single-tenant / working-renter base with shorter leases.
- Zoned schools: Hilton Head Island Elementary (math 50% / reading 49%, grade D, #168 of 597 statewide, top 31%, 709 students, 56% FRL); Hilton Head Island Middle (math 33% / reading 42%, grade F, #90 of 229 statewide, top 42%, 856 students, 52% FRL); Hilton Head Island High (math 70% / reading 82%, grade A-, #34 of 196 statewide, top 17%, 1,345 students, 40% FRL) — zoned schools at 49% FRL track the district average.
- Market conditions: Rents rising (+3.2%/yr); 845 active listings in the ZIP; 8 comparable units currently listed for rent nearby; rentals at typical pace (median 23d on market — plan ~3-4 weeks tenant-placement turnaround); solid renter incomes; 1,824 units permitted in Beaufort County in 2024 (618 in 5+ unit buildings).
- This rent runs 36% of the median local income ($98k/yr) — at the standard rent-burdened threshold; future hikes will face affordability resistance.
Forward outlook
- In year one you build about $16k of equity ($3k loan paydown + $13k appreciation (3.2% local appreciation)).
- Beaufort County population projected at +30% by 2050 — long-run rental-demand tailwind backs the buy-and-hold thesis.
- By year 3, paydown + projected appreciation supports a ~$39k cash-out refi (75% LTV) — recoverable capital for the next deal without selling this one.
Negotiation context
- It's been on market 107 days — a 9% lower offer ($363k) is reasonable based on typical stale-listing flexibility.
- Current owner paid $150k; list at $399k implies a 166% gain — meaningful room to come down on a strong offer.
Risks & watch-outs
- Watch-outs: HOA is 28% of rent.
Questions for the listing agent
- What do current leases actually rent for vs. the listed asking? Can we see a recent rent roll and the last 12 months of T-12 income?
- It's been on market 107 days. Have you received any prior offers? Is the seller open to a 27% concession, seller financing, or rate buy-down credit?
- What does the HOA fee cover, when was the last increase, and are there any pending special assessments or reserve-fund shortfalls?
- Any open or pending special assessments — roof, HVAC, plumbing, elevator, façade? What's the per-unit balance and payoff schedule, and is the seller paying it off at close or rolling it to the buyer?
- Why hasn't it sold? Are there any deal-killer items the seller is aware of (foundation, flood, title, zoning, code violations)?
- Is there a deadline driving the sale (1031 exchange, divorce, estate, relocation)? That informs how much negotiation room exists.
- Schools are B-rated — typically a magnet for longer-tenancy family renters. What's the average tenant stay here, and is there a school-zone premium baked into asking?
- The area grade is low — what's the realistic commute time and amenity access for the typical tenant pool here? Any planned neighborhood developments (good or bad) we should know about?
- What's the average days-on-market for RENTAL listings here right now (not sales)? A rising rental-DOM trend means longer vacancies and softer asking-rent achievability than the comps imply.
- What's the recent tenant-quality profile in this submarket — average credit score on applications, eviction rate, late-payment / NSF rate, and stable-employment percentage? A property-management company in the area should have these aggregated.
- How much new apartment / multifamily construction is in the pipeline within 1–3 miles? Heavy new supply (>2% of stock underway) typically softens rents 12–24 months out; light construction supports rent growth.
Investment metrics
- 1% rule
- 0.73% ✗
- Cap rate
- 3.03%
- Cash-on-cash
- -11.65%
- DSCR
- 0.48
- GRM
- 11.4
CMA / ARV
- ARV (median comp)
- $394,322
- List price
- $399,000
- Delta
- 1.19%
- Verdict
- FAIR
- Comps
- 20 within 1.0 mi
Projected returns pro-forma
3.21% appreciation · 3.23% rent growth · sell at horizon
- IRR
- -2.4%
- Equity multiple
- 0.86×
- Total profit
- $-15,519
- Equity at exit
- $184,086
- IRR
- 2.1%
- Equity multiple
- 1.34×
- Total profit
- $37,810
- Equity at exit
- $287,390
Cash invested: $111,720 (down + closing). Projections, not guarantees.
Landlord ↔ Tenant lean methodology
- Overall (STATE)
- 90 Strongly Landlord-Friendly
- State South Carolina
- 90 Strongly Landlord-Friendly · R+6
- County
- — inherits STATE
- City
- — inherits STATE
ZIP-level market 29928
- Home prices YoY
- 1.3%
- Rents YoY
- 3.2%
- Active inventory
- 845
- Price-to-rent
- 11.4×
Monthly cashflow live
- Estimated rent
- $2,922 high interval (Pro) →
- Mortgage (P&I)
- −$2,092
- Tax from tax record
- −$319 /mo · $3,832/yr
- Insurance
- −$166
- HOA est. from 17 same-building comps
- −$815
- Vacancy / Maint / Mgmt
- −$614
- Net cashflow
- $-1,085
Break-even live
Sensitivity live
| Price | -10% $-859 | -5% $-972 | +0% $-1,085 | +5% $-1,198 | +10% $-1,311 |
|---|---|---|---|---|---|
| Rent | -10% $-1,316 | -5% $-1,200 | +0% $-1,085 | +5% $-969 | +10% $-854 |
| Rate | -1.0pp $-884 | -0.5pp $-983 | base $-1,085 | +0.5pp $-1,188 | +1.0pp $-1,293 |
UW: 25.0% down · 7.5% · 30yr · 1.5% tax · 5.0% vac · 8.0% maint · 8.0% mgmt
Financing live
Cash to close
- Down payment
- $99,750
- Closing costs
- $11,970
- Reserves months
- —
- Total cash needed
- —
Loan-product check · same deal, 3 products live
Conventional
25% down · 7.5% · 30yr
- Down + closing
- —
- Monthly P&I
- —
- Monthly cashflow
- —
- DSCR
- —
- Eligible?
- —
Personal DTI + credit; lowest rate.
DSCR
20% down · 8.5% · 30yr
- Down + closing
- —
- Monthly P&I
- —
- Monthly cashflow
- —
- DSCR
- —
- Eligible?
- —
No personal income docs; deal must DSCR.
Hard money
10% down · 12.0% · 12mo
- Down + closing
- —
- Monthly P&I
- —
- Monthly cashflow
- —
- DSCR
- —
- Eligible?
- —
Short-term bridge; refi at stabilization.
Rent comps 8 comps
| Address | Beds | Baths | Sqft | Rent | $/sqft | DOM | Units | Dist |
|---|---|---|---|---|---|---|---|---|
| 3 Burkes Beach Rd Unit B Hilton Head Island, SC | 2.0 | 2.0 | 1100 | $2,500 | $2.27 | 15d | 1 | 0.46mi |
| 663 William Hilton Pkwy #2121 Hilton Head Island, SC | 2.0 | 2.0 | 900 | $2,200 | $2.44 | 45d | 1 | 0.96mi |
| 96 Mathews Dr #87 Hilton Head Island, SC | 2.0 | 2.0 | 1000 | $2,500 | $2.50 | 45d | 1 | 1.03mi |
| 96 Mathews Dr Hilton Head Island, SC | 2.0 | 2.0–2.5 | 1000 | $2,500 | $2.50 | 22d | 2 | 1.05mi |
| 96 Mathews Dr Hilton Head Island, SC | 2.0 | 2.0 | 1012 | $2,400 | $2.37 | 15d | 2 | 1.05mi |
| 662 William Hilton Pkwy Unit 1468397P Hilton Head Island, SC | 2.0 | 2.0 | 828 | $2,632 | $3.18 | 22d | 1 | 1.10mi |
| 55 Gardner Dr Hilton Head Island, SC | 1.0–3.0 | 1.0–2.0 | 1175 | $2,902 | $2.47 | 15d | 9 | 1.29mi |
| 112 Union Cemetery Rd Hilton Head Island, SC | 2.0 | 2.0 | 1025 | $2,125 | $2.07 | 15d | 1 | 1.49mi |
HOA detail condo
- Monthly dues
- $0 · $0/yr
- Likely covers
- poolgymsecurity
- Assessments
- None detected in remarks — confirm with the listing agent.
Listing history 22 events
-
2026-06-21days on market $399,000 Active 107 DOM
-
2026-06-18days on market $399,000 Active 104 DOM
-
2026-06-17days on market $399,000 Active 103 DOM
-
2026-06-16days on market $399,000 Active 102 DOM
-
2026-06-15days on market $399,000 Active 101 DOM
-
2026-06-14days on market $399,000 Active 99 DOM
-
2026-06-13days on market $399,000 Active 98 DOM
-
2026-06-10days on market $399,000 Active 96 DOM
-
2026-06-09days on market $399,000 Active 95 DOM
-
2026-06-08days on market $399,000 Active 94 DOM
-
2026-06-07days on market $399,000 Active 93 DOM
-
2026-06-05days on market $399,000 Active 90 DOM
-
2026-06-03days on market $399,000 Active 89 DOM
-
2026-06-02days on market $399,000 Active 88 DOM
-
2026-06-01days on market $399,000 Active 87 DOM
-
2026-05-31days on market $399,000 Active 86 DOM
-
2026-03-06$399,000 Active 714-char remark
Show marketing remark (714 chars)
330 Admirals Rοw iѕ the bеѕt-priсеd 2-bedroom oceanview сοndo currently available on all of Hilton Head Island - period. Not just in Admirals Row, but island-wide. If you've been waiting for the right oceanview opportunity at the right price, this is it. Used exclusively as a private beach getaway for the past 25 years. The villa shows minimal wear and has been well cared for throughout. Move in and enjoy immediately, or take advantage of the thoughtful pricing to make updates over time and create your own coastal retreat. Located in a premier oceanfront resort with multiple pools, tennis courts, 12 brand-new pickleball courts, restaurants, playground, fitness center, and 24-hour security.
-
2005-01-21soldstatus $150,000
-
1996-10-25soldstatus $85,000
-
1992-11-06soldstatus $63,000
-
1990-11-30soldstatus $56,000
-
1982-10-01soldstatus $77,520
ⓘ Source: listings_history table (triggers on properties + properties_extension) + one-shot
backfill from property_details.listing_events for pre-trigger history.
Tax reassessment forecast SC · Resets to sale price
- Current annual tax
- $3,832 · $319/mo
- Projected year-2 tax
- $3,832 · $319/mo
- Expected delta
- $0/yr ($0/mo · 0.0%)
ⓘ Screening estimate from a state-policy table — verify with the county assessor before closing.
Nearby sold comps map
Loading sold comps map…
Walkable amenities ~0.75 mi
Loading nearby amenities…
Taxation est. · year 1
- Rental income
- $35,060
- − Mortgage interest
- −$22,350
- − Property taxes
- −$3,832
- − Insurance
- −$1,995
- − Repairs & maintenance
- −$2,805
- − Management
- −$2,805
- − HOA
- −$9,780
- − Depreciation
- −$11,607
- Taxable loss
- −$20,114
- Est. tax savings @ 24.0%
- +$4,827
- After-tax cash flow
- $-8,191/yr
For passive investors: Depreciation is non-cash, so a rental often shows a tax loss while cash-flowing — sheltering income. Rental losses are passive: they offset passive income freely, and up to $25,000/yr can offset ordinary (W-2) income if you actively participate and your MAGI is under $100k (phasing out to $0 by $150k); unused losses carry forward. On sale, claimed depreciation is recaptured at up to 25%, and gains may owe capital-gains tax (a 1031 exchange can defer both). Figures are a year-1 estimate at your 24.0% rate — not tax advice; consult a CPA.
Schools (NCES district)
- District
- Beaufort 01
- NCES district ID
- 4501110
- Math proficiency
- 42% ▼ -8.00%
- Reading proficiency
- 51% ▲ 2.00%
- Median HH income
- $57,430
- Composite
- 40.56/100
- National rank
- #3699
- State rank
- #17 of 80 in SC
Livability — Hilton Head Island
- Score
- 64/100
- State rank
- #157
- US rank
- #14648
Category grades
Schools grade is shown separately in the Schools card above.
Census & demographics
- Census place
- Hilton Head Island, SC
- County
- Beaufort County · 163,770 people
- City population
- 40,243
- Metro
- Hilton Head Island-Bluffton, SC
- Population (ZIP)
- 15,785
- Household income
- $97,576
- Rent vs Own
- Severe rent burden
- 216.0
Population outlook (Beaufort County) Hauer SSP2
- Today (2025)
- 211,915 people
- By 2030
- 227,272 · +7.2%
- By 2040
- 253,861 · +19.8%
- By 2050
- 275,126 · +29.8%
- By 2075
- 311,022 · +46.8%
- By 2100
- 321,286 · +51.6%
Race, ethnicity, and origin ACS 2023
- Neighborhood character
- Predominantly White (87%)
- Race & ethnicity
- White 87% Hispanic / Latino 6% Two or more races 2% Black 2% Asian 1%
- Hispanic origin (detail)
- Mexican 3%
- Common ancestry
- Lithuanian 4% Slovak 4% Romanian 4%
- Foreign-born
- 9% · Canada, China
- Languages at home
- 91% English-only · Spanish 5% French/Haitian/Cajun 1% Chinese 1%
Political lean MEDSL · Beaufort
- 2024 margin
- R (+14.5) · D 42.1% · R 56.6% · Other 1.2%
- 2008→2024 swing
- -3.7pp toward R · 2008: -10.8pp · 2024: -14.5pp
- All cycles
- 2024: R+14.5 2020: R+10.0 2016: R+14.3 2012: R+17.5 2008: R+10.8
Not yet ingested
- Civics
- —
Market trends
- HPI YoY
- ▲ 3.21%
- Current HPI
- 243.4136
- Rent YoY
- ▲ 3.23%
- Metro
- Hilton Head Island-Bluffton, SC
- State GDP YoY
- ▲ 4.51%
- F500 in state
- 2
Industry mix (Fortune 500 HQ in SC)
| Industry | F500 HQs | Revenue |
|---|---|---|
| Packaging | 1 | $7B |
|
||
Price history
+414.7% since first listed6 events — show timeline
- 2026-03-06 Listed $399,000 RSMLS
- 2005-01-21 Sold (Public Records) $150,000 Public Records
- 1996-10-25 Sold (Public Records) $85,000 Public Records
- 1992-11-06 Sold (Public Records) $63,000 Public Records
- 1990-11-30 Sold (Public Records) $56,000 Public Records
- 1982-10-01 Sold (Public Records) $77,520 Public Records
Property tax history
+4.0%/yrLatest (2025): $3,832 · +1.4% YoY. Source: county tax records.
Cash-flow waterfall
monthlySold comps — $/sqft
last 12 mo · ≤1 miLoading sold comps…