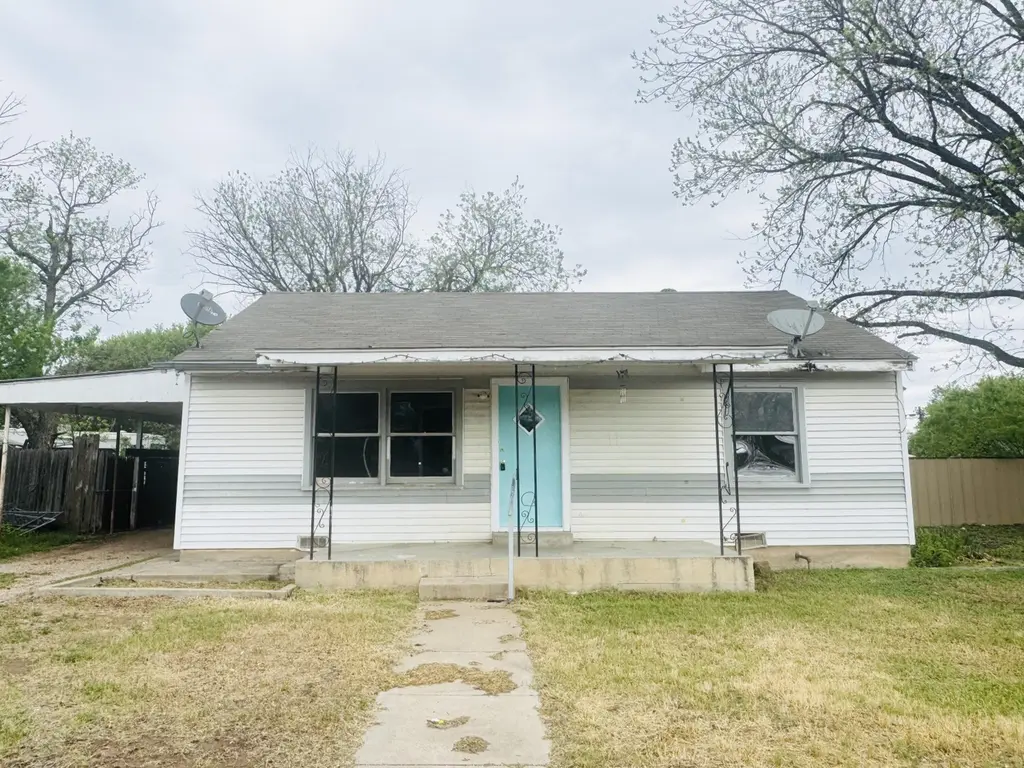
402 E Dale St · Winters, TX
Flood risk No data
- FEMA flood zone
- —
- Chance of flooding over 30 yrs
- —
- Est. flood insurance / yr
- —
Fire risk No data
- Est. fire insurance / yr
- —
Heat risk No data
- Hot days now (above threshold)
- —
- Hot days in 30 yrs
- —
Wind risk No data
- Chance of severe wind over 30 yrs
- —
Air-quality risk No data
- Unhealthy air days now
- —
- Unhealthy air days in 30 yrs
- —
Risk factors via First Street. Map © Google.
Why this score? — see what drove the B+ grade
The composite is a weighted blend of 9 inputs, each scored 0–100. Each bar is that input's sub-score; the figure is the points it added to the 100-point composite (weight × sub-score).
- Cash flow +30.0/30.0
- 1% rule +10.0/10.0
- DSCR +10.0/10.0
- Appreciation +8.2/10.0
- ARV discount +7.5/15.0
- Livability +3.6/5.0
- Schools +2.6/10.0
- Rent growth +2.5/5.0
- Condition / age +2.5/5.0
$54,900
🖨 Deal sheet 📄 Offer letter ✓ Due diligence
Listing remarks MLS
Here's your opportunity to make this home your own with a little fixing up and touch of love this home has the space you need and so much potential all in a small town atmosphere. Give us a call today to schedule your private showing.
Key facts
- 0.3 acre lot
- Parking
- Built 1955
Neighborhood map
What this means for you Summary
Snapshot
- This is a 2-bed/1.0-bath single-family listed at $55k.
Deal economics
- At list price, monthly cash flow is $422 ($5k/yr) — positive.
- The deal already cash-flows at list — no discount required.
- Meets the 1% rule at list price ($1k rent vs $55k).
- Recommended offer: $52k (6.0% below list) — sets the bar for market timing.
Location & tenants
- Location reads 72/100 on livability (#271 in TX) — a middle-class / working-renter tenant base. Strengths: crime A+, cost of living A+, housing A+; Watch: schools F, amenities F, commute F.
- Winters ISD (town): math 31% / reading 31% proficiency, ranked #616 of 826 in TX (top 75%) — families likely to look elsewhere, expect single-tenant / working-renter base with shorter leases.
- Market conditions: 30 active listings in the ZIP; 2 units permitted in Runnels County in 2024 (0 in 5+ unit buildings).
Forward outlook
- In year one you build about $4k of equity ($380 loan paydown + $4k appreciation (6.4% local appreciation)).
- At projected returns (6.4% appreciation + 3.0% rent growth), your $15k cash investment doubles in ~2 years — after that, you're playing with house money.
- By year 8, paydown + projected appreciation supports a ~$30k cash-out refi (75% LTV) — recoverable capital for the next deal without selling this one.
Negotiation context
- It's been on market 72 days — a 6% lower offer ($52k) is reasonable based on typical stale-listing flexibility.
Risks & watch-outs
- Watch-outs: property tax is 2.6% of price; built in 1955 — expect roof / HVAC / electrical / plumbing capex.
Questions for the listing agent
- It's been on market 72 days. Have you received any prior offers? Is the seller open to a 6% concession, seller financing, or rate buy-down credit?
- Built in 1955 — when were the roof, HVAC, electrical panel, plumbing, and water heater last replaced?
- Property tax is high relative to price — has the assessment been appealed recently, and will the sale trigger a re-assessment?
- Why hasn't it sold? Are there any deal-killer items the seller is aware of (foundation, flood, title, zoning, code violations)?
- Is there a deadline driving the sale (1031 exchange, divorce, estate, relocation)? That informs how much negotiation room exists.
- Schools are F-rated, which usually means shorter tenancies and higher turnover. Who's the typical renter profile here, and what's been the actual vacancy rate?
- What's the average days-on-market for RENTAL listings here right now (not sales)? A rising rental-DOM trend means longer vacancies and softer asking-rent achievability than the comps imply.
- What's the recent tenant-quality profile in this submarket — average credit score on applications, eviction rate, late-payment / NSF rate, and stable-employment percentage? A property-management company in the area should have these aggregated.
- How much new for-sale + rental construction is in the pipeline within 1–3 miles? Heavy new supply typically softens prices + rents 12–24 months out; constrained supply supports both.
Investment metrics
- 1% rule
- 1.97% ✓
- Cap rate
- 15.51%
- Cash-on-cash
- 32.93%
- DSCR
- 2.47
- GRM
- 4.2
CMA / ARV
- ARV (median comp)
- $129,465
- List price
- $54,900
- Delta
- -57.59%
- Verdict
- UNDERPRICED
- Comps
- 20 within 1.0 mi
Show comp detail 7 sales within ~0.75 mi
| Address | Dist | Beds/Ba | Sqft | Sold | Price | $/sf | Match |
|---|---|---|---|---|---|---|---|
| 409 E Truett St | 0.25mi | 3/2.0 (+1) | 1,539 (-7%) | 3mo | $120,000 | $78 | 66 |
| 303 S Church St | 0.35mi | 3/2.0 (+1) | 1,681 (+2%) | 6mo | $135,000 | $80 | 66 |
| 501 N Main St | 0.44mi | 2/1.0 | 1,650 (+0%) | 23mo | $39,000 | $24 | 60 |
| 304 E Pierce St | 0.36mi | 3/1.0 (+1) | 1,480 (-10%) | 3mo | $139,900 | $95 | 58 |
| 311 N Humphrey St | 0.25mi | 3/2.0 (+1) | 1,468 (-11%) | 8mo | $120,000 | $82 | 55 |
| 610 W Dale St | 0.62mi | 3/2.0 (+1) | 1,708 (+4%) | 2mo | $119,900 | $70 | 54 |
| 606 State St | 0.59mi | 3/1.5 (+1) | 1,858 (+13%) | 11mo | $180,000 | $97 | 35 |
Match score weights: distance 35% · size 25% · config 20% · recency 20%. Top-matched comps best support the ARV.
Projected returns pro-forma
6.39% appreciation · 3.0% rent growth · sell at horizon
- IRR
- 44.1%
- Equity multiple
- 3.86×
- Total profit
- $44,039
- Equity at exit
- $35,867
- IRR
- 40.8%
- Equity multiple
- 8.04×
- Total profit
- $108,292
- Equity at exit
- $66,245
Cash invested: $15,372 (down + closing). Projections, not guarantees.
Landlord ↔ Tenant lean methodology
- Overall (STATE)
- 87 Strongly Landlord-Friendly
- State Texas
- 87 Strongly Landlord-Friendly · R+5
- County
- — inherits STATE
- City
- — inherits STATE
ZIP-level market 79567
- Home prices YoY
- 4.7%
- Active inventory
- 30
- Price-to-rent
- 4.2×
Monthly cashflow live
- Estimated rent
- $1,081 medium interval (Pro) →
- Mortgage (P&I)
- −$288
- Tax from tax record
- −$121 /mo · $1,452/yr
- Insurance
- −$23
- HOA
- −$0
- Vacancy / Maint / Mgmt
- −$227
- Net cashflow
- $422
Break-even live
UW: 25.0% down · 7.5% · 30yr · 1.5% tax · 5.0% vac · 8.0% maint · 8.0% mgmt
Financing live
Cash to close
- Down payment
- $13,725
- Closing costs
- $1,647
- Reserves months
- —
- Total cash needed
- —
Loan-product check · same deal, 3 products live
Conventional
25% down · 7.5% · 30yr
- Down + closing
- —
- Monthly P&I
- —
- Monthly cashflow
- —
- DSCR
- —
- Eligible?
- —
Personal DTI + credit; lowest rate.
DSCR
20% down · 8.5% · 30yr
- Down + closing
- —
- Monthly P&I
- —
- Monthly cashflow
- —
- DSCR
- —
- Eligible?
- —
No personal income docs; deal must DSCR.
Hard money
10% down · 12.0% · 12mo
- Down + closing
- —
- Monthly P&I
- —
- Monthly cashflow
- —
- DSCR
- —
- Eligible?
- —
Short-term bridge; refi at stabilization.
Listing history 19 events
-
2026-06-18days on market $54,900 Active 72 DOM
-
2026-06-17days on market $54,900 Active 71 DOM
-
2026-06-16days on market $54,900 Active 70 DOM
-
2026-06-15days on market $54,900 Active 69 DOM
-
2026-06-15days on market $54,900 Active 68 DOM
-
2026-06-13days on market $54,900 Active 67 DOM
-
2026-06-12days on market $54,900 Active 66 DOM
-
2026-06-09days on market $54,900 Active 63 DOM
-
2026-06-08days on market $54,900 Active 62 DOM
-
2026-06-08days on market $54,900 Active 61 DOM
-
2026-06-07days on market $54,900 Active 60 DOM
-
2026-06-03days on market $54,900 Active 57 DOM
-
2026-06-02days on market $54,900 Active 56 DOM
-
2026-06-01days on market $54,900 Active 55 DOM
-
2026-05-31days on market $54,900 Active 54 DOM
-
2026-04-07$54,900 Active 234-char remark
Show marketing remark (234 chars)
Here's your opportunity to make this home your own with a little fixing up and touch of love this home has the space you need and so much potential all in a small town atmosphere. Give us a call today to schedule your private showing.
-
2018-03-16soldstatus
-
2014-12-30soldstatus
-
2006-08-31soldstatus
ⓘ Source: listings_history table (triggers on properties + properties_extension) + one-shot
backfill from property_details.listing_events for pre-trigger history.
Tax reassessment forecast TX · Resets to sale price
- Current annual tax
- $1,452 · $121/mo
- Projected year-2 tax
- $1,452 · $121/mo
- Expected delta
- $0/yr ($0/mo · 0.0%)
ⓘ Screening estimate from a state-policy table — verify with the county assessor before closing.
Nearby sold comps map
Loading sold comps map…
Walkable amenities ~0.75 mi
Loading nearby amenities…
Taxation est. · year 1
- Rental income
- $12,967
- − Mortgage interest
- −$3,075
- − Property taxes
- −$1,452
- − Insurance
- −$274
- − Repairs & maintenance
- −$1,037
- − Management
- −$1,037
- − Depreciation
- −$1,597
- Taxable income
- $4,493
- Est. tax owed @ 24.0%
- −$1,078
- After-tax cash flow
- $3,984/yr
For passive investors: Depreciation is non-cash, so a rental often shows a tax loss while cash-flowing — sheltering income. Rental losses are passive: they offset passive income freely, and up to $25,000/yr can offset ordinary (W-2) income if you actively participate and your MAGI is under $100k (phasing out to $0 by $150k); unused losses carry forward. On sale, claimed depreciation is recaptured at up to 25%, and gains may owe capital-gains tax (a 1031 exchange can defer both). Figures are a year-1 estimate at your 24.0% rate — not tax advice; consult a CPA.
Schools (NCES district)
- District
- Winters ISD
- NCES district ID
- 4846260
- Math proficiency
- 31% ▼ -6.00%
- Reading proficiency
- 31% ▼ -4.00%
- Median HH income
- $39,510
- Composite
- 26.04/100
- National rank
- #7304
- State rank
- #616 of 826 in TX
Livability — Winters
- Score
- 72/100
- State rank
- #271
- US rank
- #6348
Category grades
Schools grade is shown separately in the Schools card above.
Census & demographics
- Census place
- Winters, TX
- Population (ZIP)
- 2,924
Population outlook (Runnels County) Hauer SSP2
- Today (2025)
- 10,754 people
- By 2030
- 10,843 · +0.8%
- By 2040
- 10,946 · +1.8%
- By 2050
- 10,981 · +2.1%
- By 2075
- 11,103 · +3.2%
- By 2100
- 10,051 · -6.5%
Race, ethnicity, and origin ACS 2023
- Neighborhood character
- Majority White (55%)
- Race & ethnicity
- White 55% Hispanic / Latino 39% Two or more races 24% Black 2%
- Hispanic origin (detail)
- Mexican 31%
- Common ancestry
- Italian 8% Slovak 2% Iranian 1%
- Foreign-born
- 5% · Canada
- Languages at home
- 73% English-only · Spanish 27%
Political lean MEDSL · Runnels
- 2024 margin
- Solid R (+77.1) · D 11.1% · R 88.3%
- 2008→2024 swing
- -15.1pp toward R · 2008: -62.0pp · 2024: -77.1pp
- All cycles
- 2024: R+77.1 2020: R+73.8 2016: R+74.1 2012: R+70.6 2008: R+62.0
Not yet ingested
- Civics
- —
Market trends
- HPI YoY
- ▲ 6.39%
- Current HPI
- 143.6466
- Rent YoY
- —
- Metro
- —
- State GDP YoY
- ▲ 3.95%
- F500 in state
- 110
Industry mix (Fortune 500 HQ in TX)
| Industry | F500 HQs | Revenue |
|---|---|---|
| Energy | 16 | $1,198B |
|
||
| Technology | 5 | $198B |
|
||
| Engineering / Construction | 4 | $72B |
|
||
| Energy Services | 3 | $60B |
|
||
| Utilities | 3 | $41B |
|
||
| Healthcare | 2 | $330B |
|
||
Price history
4 events — show timeline
- 2026-04-07 Listed $54,900 SAAR TX
- 2018-03-16 Sold (Public Records) — Public Records
- 2014-12-30 Sold (Public Records) — Public Records
- 2006-08-31 Sold (Public Records) — Public Records
Property tax history
+4.1%/yrLatest (2025): $1,452 · +10.6% YoY. Source: county tax records.
Cash-flow waterfall
monthlySold comps — $/sqft
last 12 mo · ≤1 miLoading sold comps…