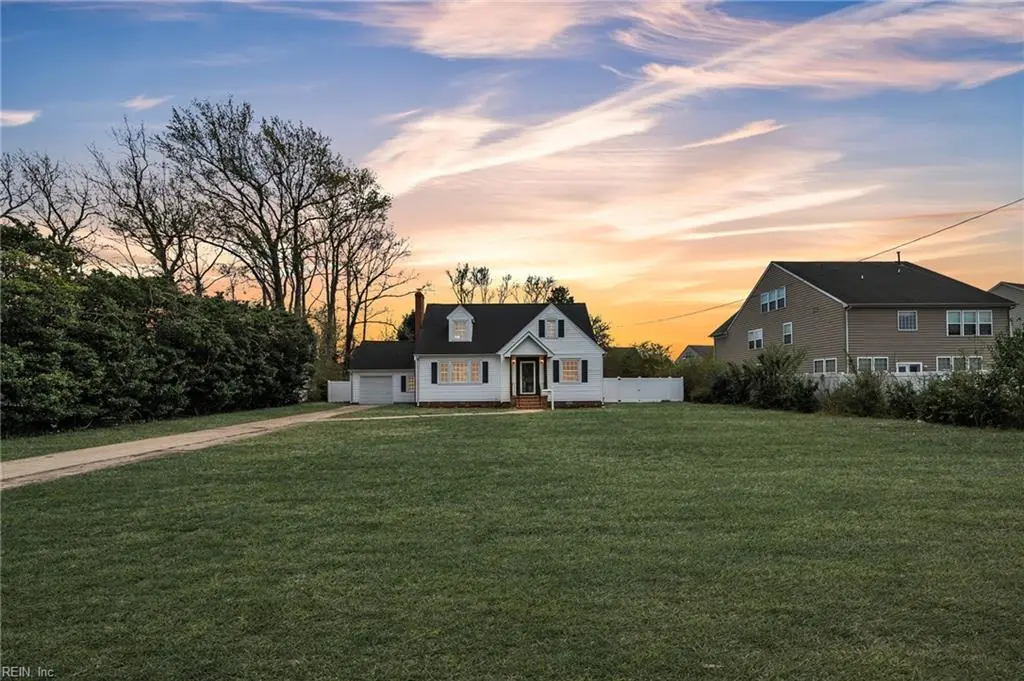
1263 W Queen St · Hampton, VA
Flood risk 4/10 · Minor
- FEMA flood zone
- X (unshaded)
- Chance of flooding over 30 yrs
- 0.13%
- Est. flood insurance / yr
- $507 – $1,088
Fire risk 1/10 · Minimal
- Est. fire insurance / yr
- $666 – $1,236
Heat risk 9/10 · Severe
- Hot days now (above 105°F)
- 7 days/yr
- Hot days in 30 yrs
- 16 days/yr
Wind risk 8/10 · Major
- Chance of severe wind over 30 yrs
- 80.0%
Air-quality risk 2/10 · Minimal
- Unhealthy air days now
- 1 days/yr
- Unhealthy air days in 30 yrs
- 1 days/yr
Risk factors via First Street. Map © Google.
Why this score? — see what drove the D grade
The composite is a weighted blend of 9 inputs, each scored 0–100. Each bar is that input's sub-score; the figure is the points it added to the 100-point composite (weight × sub-score).
- Cash flow +11.4/30.0
- ARV discount +8.9/15.0
- Schools +5.5/10.0
- Rent growth +3.9/5.0
- Livability +3.8/5.0
- DSCR +3.3/10.0
- 1% rule +2.8/10.0
- Condition / age +2.5/5.0
- Appreciation +0.0/10.0
$354,900
🖨 Deal sheet 📄 Offer letter ✓ Due diligence
Listing remarks
Beautiful Cape Cod style home on a huge lot with 5 bedrooms, 2 baths, freshly painted, wood floors, 2 new HVAC units, brand new white vinyl fencing privacy fence, 1 car garage, long driveway, near down town.
Key facts
- Near down town
- New hvac units
- Cape cod style home
Tags
Property features AI
Finance
- HOA & community: No HOA fees
Exterior
- Parking: Attached 1-car garage; Additional multi-car parking; Driveway parking; Approximately 400 sq. ft. garage
- Utilities: City/County water; City/County sewer; Electric water heater; Electric service
- Home design: Detached Cape Cod; 2 stories; Crawl foundation; Simple ownership
- Construction: Vinyl exterior siding; Crawl space foundation; Asphalt shingle roof
- Exterior features: Patio; Back, full privacy fence; Vinyl siding; Asphalt shingle roof
Interior
- Kitchen: Electric range; Refrigerator; Dishwasher; Breakfast area
- Bedrooms: Primary bedroom (on second floor); Additional bedroom; Bedroom and full bathroom on first floor
- Flooring: Ceramic flooring; Wood flooring
- Bathrooms: 2 full bathrooms
- Heating & cooling: Electric heating; Central air conditioning
- Interior features: Ceiling fan; Wood-burning fireplace; Walk-in closet
- Laundry & utility: Washer hookup; Dryer hookup; Utility room
Neighborhood map
What this means for you Summary
Snapshot
- This is a 4-bed/2.0-bath single-family listed at $355k.
Deal economics
- At list price, monthly cash flow is $-123 ($-1k/yr) — negative.
- To cash-flow at today's rent, offer at most $333k (6.1% below list).
- To meet the 1% rule (rent ≥ 1% of price), the offer needs to be $277k (22.0% below list).
- Recommended offer: $277k (22.0% below list) — sets the bar for 1% rule.
- Cap rate 5.9% vs local median 4.5% in Hampton — top-decile yield for the area; either an underpriced asset or a hidden risk that comps aren't pricing in. Stress-test before assuming the spread holds.
Location & tenants
- Location reads 75/100 on livability (#133 in VA, #4,302 nationally) — a middle-class / working-renter tenant base. Strengths: housing A+, health & safety A+, cost of living A; Watch: crime C-, amenities D+, commute F.
- Hampton City Public School District (urban): math 60% / reading 70% proficiency, ranked #40 of 131 in VA (top 30%) — acceptable for families but not a draw, mixed tenant base, ~2y average lease.
- Zoned schools: A.W.E. Bassette Elementary (math 32% / reading 47%, grade F, #900 of 1,108 statewide, top 83%, 494 students, 87% FRL); Hampton High (math 60% / reading 75%, grade B, #183 of 319 statewide, top 58%, 1,359 students, 86% FRL) — zoned schools average 86% FRL vs 49% district-wide (37 pts higher); higher-poverty schools than district average — tighter screening recommended.
- Market conditions: Rents rising fast (+5.4%/yr); 232 active listings in the ZIP; 16 comparable units currently listed for rent nearby; rentals at typical pace (median 24d on market — plan ~3-4 weeks tenant-placement turnaround); 44% of comp listings sitting > 30 days — soft ceiling on asking rent; 68 units permitted in Hampton city in 2024 (0 in 5+ unit buildings).
- At $2,770/mo this rent would consume 47% of the median local household income ($71k/yr) (locally 2130% of renters already pay >50% of income on rent) — very limited rent-growth headroom before tenants either downsize or default.
Forward outlook
- Local home prices are declining (-3.0%/yr); year-one equity from $2k of loan paydown is wiped out by about $11k of value loss. Plan a longer hold.
- Hampton County population projected at -13% by 2050 — secular population decline; favor cash flow + early exit over multi-decade hold.
Negotiation context
- It's been on market 32 days — a 3% lower offer ($344k) is reasonable based on typical stale-listing flexibility.
- 4 sale attempts since 3y ago; this cycle's ask has dropped $20k (5%) from the opening price — seller is motivated, your offer sets the floor, not the list.
Risks & watch-outs
- Watch-outs: built in 1948 — expect roof / HVAC / electrical / plumbing capex.
- Climate carrying-cost: severe wind risk, 80% chance of damaging wind over 30y; extreme-heat days projected 7→16/yr by 2055 (HVAC capex compounding) — expect insurance premiums to compound above CPI over the hold.
Questions for the listing agent
- What do current leases actually rent for vs. the listed asking? Can we see a recent rent roll and the last 12 months of T-12 income?
- It's been on market 32 days. Have you received any prior offers? Is the seller open to a 22% concession, seller financing, or rate buy-down credit?
- Built in 1948 — when were the roof, HVAC, electrical panel, plumbing, and water heater last replaced?
- Is there a deadline driving the sale (1031 exchange, divorce, estate, relocation)? That informs how much negotiation room exists.
- Schools are B-rated — typically a magnet for longer-tenancy family renters. What's the average tenant stay here, and is there a school-zone premium baked into asking?
- The area grade is low — what's the realistic commute time and amenity access for the typical tenant pool here? Any planned neighborhood developments (good or bad) we should know about?
- What's the average days-on-market for RENTAL listings here right now (not sales)? A rising rental-DOM trend means longer vacancies and softer asking-rent achievability than the comps imply.
- What's the recent tenant-quality profile in this submarket — average credit score on applications, eviction rate, late-payment / NSF rate, and stable-employment percentage? A property-management company in the area should have these aggregated.
- How much new for-sale + rental construction is in the pipeline within 1–3 miles? Heavy new supply typically softens prices + rents 12–24 months out; constrained supply supports both.
Investment metrics
- 1% rule
- 0.78% ✗
- Cap rate
- 5.88%
- Cash-on-cash
- -1.48%
- DSCR
- 0.93
- GRM
- 10.7
CMA / ARV
- ARV (on-the-fly)
- $366,366
- Comps found
- 12
Show comp detail 12 sales within ~0.75 mi
| Address | Dist | Beds/Ba | Sqft | Sold | Price | $/sf | Match |
|---|---|---|---|---|---|---|---|
| 5 Cranes Cv | 0.14mi | 4/2.5 | 2,000 (-0%) | 3mo | $381,500 | $191 | 88 |
| 82 Red Robin Turn | 0.30mi | 3/2.0 (-1) | 2,209 (+10%) | 2mo | $379,900 | $172 | 62 |
| 818 Smith St Unit A | 0.58mi | 5/3.0 (+1) | 2,000 (-0%) | 4mo | $365,000 | $183 | 60 |
| 521 Lee St | 0.66mi | 4/2.0 | 1,900 (-5%) | 4mo | $319,000 | $168 | 58 |
| 28 Maplewood St | 0.69mi | 4/2.5 | 1,899 (-5%) | 1mo | $380,000 | $200 | 57 |
| 143 Settlers Landing Rd | 0.62mi | 4/2.5 | 1,899 (-5%) | 4mo | $368,500 | $194 | 57 |
| 512 Lee St | 0.69mi | 3/3.0 (-1) | 1,989 (-1%) | 3mo | $340,000 | $171 | 56 |
| 635 Homestead Ave | 0.49mi | 3/3.5 (-1) | 1,886 (-6%) | 1mo | $368,900 | $196 | 55 |
| 615 Westwood Ave | 0.59mi | 3/3.5 (-1) | 1,885 (-6%) | 3mo | $339,000 | $180 | 50 |
| 423 Shenandoah Rd | 0.74mi | 3/2.0 (-1) | 1,829 (-9%) | 1mo | $325,000 | $178 | 45 |
| 3213 Shell Rd | 0.62mi | 5/3.0 (+1) | 2,214 (+11%) | 1mo | $430,000 | $194 | 44 |
| 3723 Ervin St | 0.72mi | 4/2.5 | 2,230 (+11%) | 4mo | $405,000 | $182 | 42 |
Match score weights: distance 35% · size 25% · config 20% · recency 20%. Top-matched comps best support the ARV.
Projected returns pro-forma
-3.0% appreciation · 5.44% rent growth · sell at horizon
- IRR
- -16.2%
- Equity multiple
- 0.41×
- Total profit
- $-58,400
- Equity at exit
- $52,917
- IRR
- -4.3%
- Equity multiple
- 0.69×
- Total profit
- $-31,048
- Equity at exit
- $30,685
Cash invested: $99,372 (down + closing). Projections, not guarantees.
Landlord ↔ Tenant lean methodology
- Overall (STATE)
- 55 Moderately Landlord-Leaning
- State Virginia
- 55 Moderately Landlord-Leaning · D+2
- County
- — inherits STATE
- City
- — inherits STATE
ZIP-level market 23669
- Rents YoY
- 5.4%
- Active inventory
- 232
- Price-to-rent
- 10.7×
Monthly cashflow live
- Estimated rent
- $2,770 high interval (Pro) →
- Mortgage (P&I)
- −$1,861
- Tax from tax record
- −$302 /mo · $3,620/yr
- Insurance
- −$148
- HOA
- −$0
- Vacancy / Maint / Mgmt
- −$582
- Net cashflow
- $-123
Break-even live
UW: 25.0% down · 7.5% · 30yr · 1.5% tax · 5.0% vac · 8.0% maint · 8.0% mgmt
Financing live
Cash to close
- Down payment
- $88,725
- Closing costs
- $10,647
- Reserves months
- —
- Total cash needed
- —
Loan-product check · same deal, 3 products live
Conventional
25% down · 7.5% · 30yr
- Down + closing
- —
- Monthly P&I
- —
- Monthly cashflow
- —
- DSCR
- —
- Eligible?
- —
Personal DTI + credit; lowest rate.
DSCR
20% down · 8.5% · 30yr
- Down + closing
- —
- Monthly P&I
- —
- Monthly cashflow
- —
- DSCR
- —
- Eligible?
- —
No personal income docs; deal must DSCR.
Hard money
10% down · 12.0% · 12mo
- Down + closing
- —
- Monthly P&I
- —
- Monthly cashflow
- —
- DSCR
- —
- Eligible?
- —
Short-term bridge; refi at stabilization.
Rent comps 16 comps
| Address | Beds | Baths | Sqft | Rent | $/sqft | DOM | Units | Dist |
|---|---|---|---|---|---|---|---|---|
| 42 Kilverstone Way Hampton, VA | 4.0 | 2.5 | 2654 | $3,800 | $1.43 | 43d | 1 | 0.11mi |
| 13 Hampshire Glen Pkwy Hampton, VA | 5.0 | 2.5 | 2651 | $3,700 | $1.40 | 23d | 1 | 0.39mi |
| 702 Rutherford St Hampton, VA | 3.0 | 2.0 | 1445 | $1,795 | $1.24 | 23d | 1 | 0.46mi |
| 626 Chapel St Hampton, VA | 4.0 | 2.0 | 1470 | $1,900 | $1.29 | 12d | 1 | 0.49mi |
| 534 Brightwood Ave Hampton, VA | 3.0 | 3.0 | 1528 | $2,095 | $1.37 | 43d | 1 | 0.56mi |
| 607 Lee St Hampton, VA | 3.0 | 1.5 | 1404 | $2,150 | $1.53 | 43d | 1 | 0.59mi |
| 426 Seminole Rd Hampton, VA | 4.0 | 2.5 | 2200 | $2,450 | $1.11 | 14d | 1 | 0.66mi |
| 316 Fountain Way Hampton, VA | 3.0 | 2.5 | 1850 | $2,600 | $1.41 | 17d | 1 | 0.73mi |
| 448 Chapel St Hampton, VA | 3.0 | 2.0 | 1425 | $1,850 | $1.30 | 2d | 1 | 0.77mi |
| 703 N Back River Rd Hampton, VA | 3.0 | 2.5 | 2062 | $2,475 | $1.20 | 43d | 1 | 0.81mi |
| 101 Prince James Dr Hampton, VA | 3.0 | 1.0 | 1766 | $1,645 | $0.93 | 14d | 1 | 0.88mi |
| 2 Abbott Dr Hampton, VA | 1.0–3.0 | 1.0–3.5 | 1187 | $2,891 | $2.43 | 1d | 18 | 0.96mi |
| 310 Lasalle Ave Hampton, VA | 3.0 | 2.0 | 1858 | $2,200 | $1.18 | 43d | 1 | 1.04mi |
| 13 Rockingham Dr Hampton, VA | 5.0 | 3.5 | 2615 | $3,500 | $1.34 | 43d | 1 | 1.14mi |
| 4407 Victoria Blvd Hampton, VA | 3.0 | 4.0 | 2400 | $2,400 | $1.00 | 14d | 1 | 1.22mi |
| 23 Regal Way Hampton, VA | 3.0 | 2.5 | 2482 | $2,900 | $1.17 | 43d | 1 | 1.45mi |
Listing history 24 events
-
2026-06-18days on market $354,900 Active 32 DOM
-
2026-06-17days on market $354,900 Active 31 DOM
-
2026-06-16days on market $354,900 Active 30 DOM
-
2026-06-15days on market $354,900 Active 29 DOM
-
2026-06-13days on market $354,900 Active 27 DOM
-
2026-06-13pricedays on market $354,900 Active 26 DOM
-
2026-06-09days on market $374,900 Active 23 DOM
-
2026-06-08days on market $374,900 Active 22 DOM
-
2026-06-07days on market $374,900 Active 21 DOM
-
2026-06-03days on market $374,900 Active 17 DOM
-
2026-06-02days on market $374,900 Active 16 DOM
-
2026-06-01days on market $374,900 Active 15 DOM
-
2026-05-31days on market $374,900 Active 14 DOM
-
2026-05-17$374,900 Active 207-char remark
-
2026-05-14historical
-
2026-04-16price $399,900
-
2026-03-27$424,900 Active
-
2024-07-30soldstatus $319,990
-
2024-06-21status Under Contract
-
2024-05-08$319,990 Active
-
2023-08-03soldstatus $290,000
-
2023-07-12status Under Contract
-
2023-07-03historical Active Under Contract
-
2023-06-28$295,000 Active
ⓘ Source: listings_history table (triggers on properties + properties_extension) + one-shot
backfill from property_details.listing_events for pre-trigger history.
Tax reassessment forecast VA · Resets to sale price
- Current annual tax
- $3,620 · $302/mo
- Projected year-2 tax
- $3,620 · $302/mo
- Expected delta
- $0/yr ($0/mo · 0.0%)
ⓘ Screening estimate from a state-policy table — verify with the county assessor before closing.
Climate risk First Street
- Flood 4/10 Moderate FEMA zone X (unshaded) · 13% chance over 30 yrs
- Wildfire 1/10 Low
- Heat 9/10 Extreme 7 d/yr ≥105°F today · 16 d/yr by 30 yrs out
- Wind 8/10 Severe 80% chance of damaging wind over 30 yrs
- Air quality 2/10 Low 1 unhealthy d/yr today · 1 by 30 yrs out
Nearby sold comps map
Loading sold comps map…
Walkable amenities ~0.75 mi
Loading nearby amenities…
Taxation est. · year 1
- Rental income
- $33,236
- − Mortgage interest
- −$19,880
- − Property taxes
- −$3,620
- − Insurance
- −$1,774
- − Repairs & maintenance
- −$2,659
- − Management
- −$2,659
- − Depreciation
- −$10,324
- Taxable loss
- −$7,680
- Est. tax savings @ 24.0%
- +$1,843
- After-tax cash flow
- $372/yr
For passive investors: Depreciation is non-cash, so a rental often shows a tax loss while cash-flowing — sheltering income. Rental losses are passive: they offset passive income freely, and up to $25,000/yr can offset ordinary (W-2) income if you actively participate and your MAGI is under $100k (phasing out to $0 by $150k); unused losses carry forward. On sale, claimed depreciation is recaptured at up to 25%, and gains may owe capital-gains tax (a 1031 exchange can defer both). Figures are a year-1 estimate at your 24.0% rate — not tax advice; consult a CPA.
Schools (NCES district)
- District
- Hampton City Public School District
- NCES district ID
- 5101800
- Math proficiency
- 60% ▼ -21.00%
- Reading proficiency
- 70% ▼ -4.00%
- Median HH income
- $50,089
- Composite
- 55.19/100
- National rank
- #1272
- State rank
- #40 of 131 in VA
Livability — Hampton
- Score
- 75/100
- State rank
- #133
- US rank
- #4302
Category grades
Schools grade is shown separately in the Schools card above.
Census & demographics
- Census place
- Hampton, VA
- County
- Hampton City · 132,421 people
- City population
- 132,421
- Metro
- Virginia Beach-Norfolk-Newport News, VA-NC
- Population (ZIP)
- 39,884
- Household income
- $71,222
- Rent vs Own
- Severe rent burden
- 2130.0
Population outlook (Hampton County) Hauer SSP2
- Today (2025)
- 134,055 people
- By 2030
- 131,753 · -1.7%
- By 2040
- 125,017 · -6.7%
- By 2050
- 116,825 · -12.9%
- By 2075
- 97,033 · -27.6%
- By 2100
- 76,188 · -43.2%
Race, ethnicity, and origin ACS 2023
- Neighborhood character
- Diverse neighborhood (Simpson 0.63)
- Race & ethnicity
- Black 46% White 39% Two or more races 9% Hispanic / Latino 6% Asian 2%
- Hispanic origin (detail)
- Mexican 1% Puerto Rican 2%
- Common ancestry
- Slovak 2% Italian 1% Romanian 1%
- Foreign-born
- 4% · Canada
- Languages at home
- 95% English-only · Spanish 3% Other Asian/Pacific 1%
Political lean MEDSL · Hampton
- 2024 margin
- Solid D (+39.9) · D 69.2% · R 29.4% · Other 1.4%
- 2008→2024 swing
- +1.0pp no change · 2008: 38.9pp · 2024: 39.9pp
- All cycles
- 2024: D+39.9 2020: D+42.2 2016: D+37.8 2012: D+45.4 2008: D+38.9
Not yet ingested
- Civics
- —
Market trends
- HPI YoY
- ▼ -150.40%
- Current HPI
- 276.4636
- Rent YoY
- ▲ 5.44%
- Metro
- Virginia Beach-Norfolk-Newport News, VA-NC
- State GDP YoY
- ▲ 2.40%
- F500 in state
- 50
Industry mix (Fortune 500 HQ in VA)
| Industry | F500 HQs | Revenue |
|---|---|---|
| Aerospace / Defense | 4 | $236B |
|
||
| Technology / Defense | 3 | $32B |
|
||
| Financial Services | 2 | $176B |
|
||
| Utilities | 2 | $27B |
|
||
| Insurance | 2 | $25B |
|
||
| Technology | 2 | $15B |
|
||
Price history
+20.3% since first listed12 events — show timeline
- 2026-06-11 Price Changed $354,900 REINMLS
- 2026-05-17 Listed $374,900 REINMLS
- 2026-05-14 Listing Removed — REINMLS
- 2026-04-16 Price Changed $399,900 REINMLS
- 2026-03-27 Listed $424,900 REINMLS
- 2024-07-30 Sold (Public Records) $319,990 Public Records
- 2024-06-21 Pending — REINMLS
- 2024-05-08 Listed $319,990 REINMLS
- 2023-08-03 Sold (Public Records) $290,000 Public Records
- 2023-07-12 Pending — REINMLS
- 2023-07-03 Contingent — REINMLS
- 2023-06-28 Listed $295,000 REINMLS
Property tax history
+10.3%/yrLatest (2025): $3,620 · +13.5% YoY. Source: county tax records.
Cash-flow waterfall
monthlySold comps — $/sqft
last 12 mo · ≤1 miLoading sold comps…