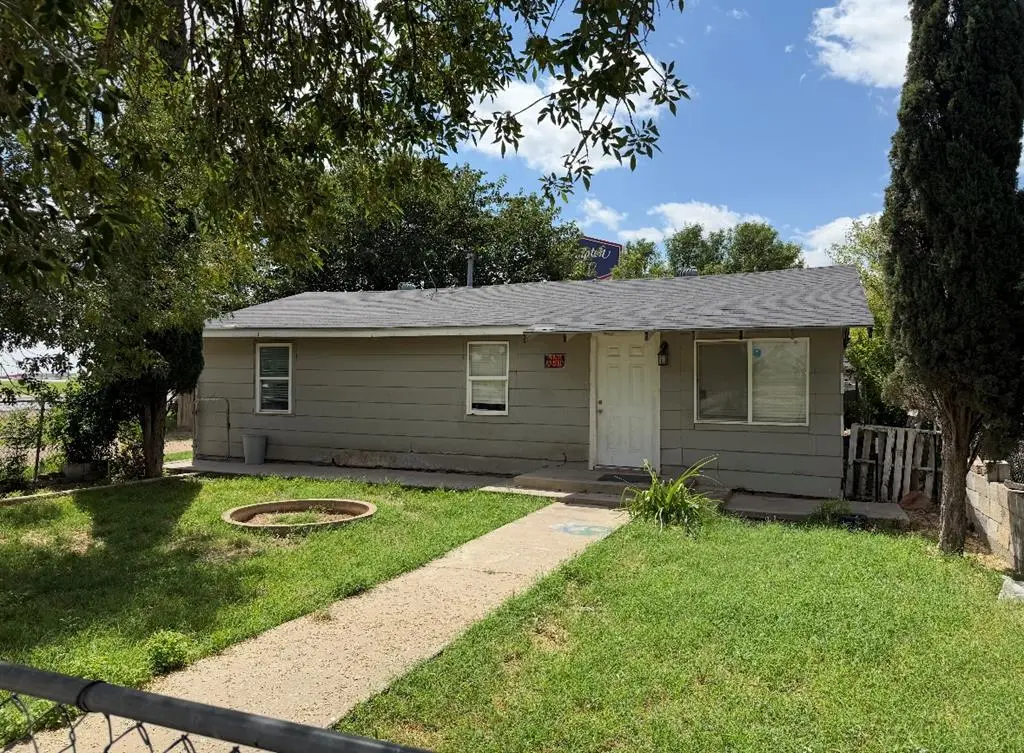
2412 Connell St · Midland, TX
Flood risk 6/10 · Moderate
- FEMA flood zone
- X
- Chance of flooding over 30 yrs
- 0.7%
- Est. flood insurance / yr
- $507 – $1,088
Fire risk 8/10 · Major
- Est. fire insurance / yr
- $1,222 – $2,270
Heat risk 6/10 · Moderate
- Hot days now (above 102°F)
- 6 days/yr
- Hot days in 30 yrs
- 19 days/yr
Wind risk 2/10 · Minimal
- Chance of severe wind over 30 yrs
- 4.0%
Air-quality risk 1/10 · Minimal
- Unhealthy air days now
- 0 days/yr
- Unhealthy air days in 30 yrs
- 0 days/yr
Risk factors via First Street. Map © Google.
Why this score? — see what drove the C- grade
The composite is a weighted blend of 9 inputs, each scored 0–100. Each bar is that input's sub-score; the figure is the points it added to the 100-point composite (weight × sub-score).
- Cash flow +26.3/30.0
- DSCR +8.9/10.0
- 1% rule +6.5/10.0
- Livability +4.0/5.0
- Schools +3.2/10.0
- Rent growth +2.7/5.0
- Condition / age +2.5/5.0
- ARV discount +0.9/15.0
- Appreciation +0.0/10.0
$210,000
🖨 Deal sheet 📄 Offer letter ✓ Due diligence
Listing remarks MLS
CALLING ALL INVESTORS! THIS 4 BEDROOM 2 1/2 BATH IS AN AFFORDABLE INVESTMENT PROPERTY WITH BIG POTENTIAL! FEATURING VINYL FLOORING, OPEN KITCHEN/LIVING LAYOUT, REFRIGERATOR INCLUDED! LARGE FENCED FRONT AND BACK YARD GREAT LOCATION RIGHT OFF OF INTERSTATE 20!
Key facts
- Vinyl flooring
- 6,229 sq ft lot
- Built 1953
Tags
Neighborhood map
What this means for you Summary
Snapshot
- This is a 4-bed/2.5-bath single-family listed at $210k.
Deal economics
- At list price, monthly cash flow is $540 ($6k/yr) — positive.
- The deal already cash-flows at list — no discount required.
- Meets the 1% rule at list price ($2k rent vs $210k).
- Recommended offer: $185k (12.0% below list) — sets the bar for market timing.
- Cap rate 9.4% vs local median 4.7% in Midland — top-decile yield for the area; either an underpriced asset or a hidden risk that comps aren't pricing in. Stress-test before assuming the spread holds.
Location & tenants
- Location reads 79/100 on livability (#57 in TX, #2,192 nationally) — a middle-class / working-renter tenant base. Strengths: employment A+, housing A+, health & safety A+; Watch: schools C-, crime C-, commute D+.
- Midland ISD (urban): math 34% / reading 36% proficiency, ranked #477 of 826 in TX (top 58%) — families likely to look elsewhere, expect single-tenant / working-renter base with shorter leases.
- Market conditions: Rents flat; 113 active listings in the ZIP; 7 comparable units currently listed for rent nearby; rentals at typical pace (median 22d on market — plan ~3-4 weeks tenant-placement turnaround); 1,504 units permitted in Midland County in 2024 (0 in 5+ unit buildings).
- At $2,412/mo this rent would consume 50% of the median local household income ($57k/yr) (locally 938% of renters already pay >50% of income on rent) — very limited rent-growth headroom before tenants either downsize or default.
Forward outlook
- Local home prices are declining (-3.0%/yr); year-one equity from $1k of loan paydown is wiped out by about $6k of value loss. Plan a longer hold.
- Midland County population projected at +83% by 2050 — long-run rental-demand tailwind backs the buy-and-hold thesis.
Negotiation context
- It's been on market 283 days — a 12% lower offer ($185k) is reasonable based on typical stale-listing flexibility.
Risks & watch-outs
- Watch-outs: built in 1953 — expect roof / HVAC / electrical / plumbing capex.
- Climate carrying-cost: major flood risk; severe wildfire risk; extreme-heat days projected 6→19/yr by 2055 (HVAC capex compounding) — expect insurance premiums to compound above CPI over the hold.
Questions for the listing agent
- It's been on market 283 days. Have you received any prior offers? Is the seller open to a 12% concession, seller financing, or rate buy-down credit?
- Built in 1953 — when were the roof, HVAC, electrical panel, plumbing, and water heater last replaced?
- Why hasn't it sold? Are there any deal-killer items the seller is aware of (foundation, flood, title, zoning, code violations)?
- Is there a deadline driving the sale (1031 exchange, divorce, estate, relocation)? That informs how much negotiation room exists.
- What's the average days-on-market for RENTAL listings here right now (not sales)? A rising rental-DOM trend means longer vacancies and softer asking-rent achievability than the comps imply.
- What's the recent tenant-quality profile in this submarket — average credit score on applications, eviction rate, late-payment / NSF rate, and stable-employment percentage? A property-management company in the area should have these aggregated.
- How much new for-sale + rental construction is in the pipeline within 1–3 miles? Heavy new supply typically softens prices + rents 12–24 months out; constrained supply supports both.
Investment metrics
- 1% rule
- 1.15% ✓
- Cap rate
- 9.38%
- Cash-on-cash
- 11.01%
- DSCR
- 1.49
- GRM
- 7.3
CMA / ARV
- ARV (median comp)
- $183,278
- List price
- $210,000
- Delta
- 14.58%
- Verdict
- OVERPRICED
- Comps
- 5 within 2.0 mi
Projected returns pro-forma
-3.0% appreciation · 0.74% rent growth · sell at horizon
- IRR
- -2.3%
- Equity multiple
- 0.91×
- Total profit
- $-5,038
- Equity at exit
- $31,312
- IRR
- 4.8%
- Equity multiple
- 1.32×
- Total profit
- $18,772
- Equity at exit
- $18,157
Cash invested: $58,800 (down + closing). Projections, not guarantees.
Landlord ↔ Tenant lean methodology
- Overall (STATE)
- 87 Strongly Landlord-Friendly
- State Texas
- 87 Strongly Landlord-Friendly · R+5
- County
- — inherits STATE
- City
- — inherits STATE
ZIP-level market 79701
- Rents YoY
- 0.7%
- Active inventory
- 113
- Price-to-rent
- 7.3×
Monthly cashflow live
- Estimated rent
- $2,412 high interval (Pro) →
- Mortgage (P&I)
- −$1,101
- Tax from tax record
- −$177 /mo · $2,121/yr
- Insurance
- −$88
- HOA
- −$0
- Vacancy / Maint / Mgmt
- −$506
- Net cashflow
- $540
Break-even live
UW: 25.0% down · 7.5% · 30yr · 1.5% tax · 5.0% vac · 8.0% maint · 8.0% mgmt
Financing live
Cash to close
- Down payment
- $52,500
- Closing costs
- $6,300
- Reserves months
- —
- Total cash needed
- —
Loan-product check · same deal, 3 products live
Conventional
25% down · 7.5% · 30yr
- Down + closing
- —
- Monthly P&I
- —
- Monthly cashflow
- —
- DSCR
- —
- Eligible?
- —
Personal DTI + credit; lowest rate.
DSCR
20% down · 8.5% · 30yr
- Down + closing
- —
- Monthly P&I
- —
- Monthly cashflow
- —
- DSCR
- —
- Eligible?
- —
No personal income docs; deal must DSCR.
Hard money
10% down · 12.0% · 12mo
- Down + closing
- —
- Monthly P&I
- —
- Monthly cashflow
- —
- DSCR
- —
- Eligible?
- —
Short-term bridge; refi at stabilization.
Rent comps 7 comps
| Address | Beds | Baths | Sqft | Rent | $/sqft | DOM | Units | Dist |
|---|---|---|---|---|---|---|---|---|
| 3114 S County Road 1193 Midland, TX | 4.0 | 2.0 | 1957 | $2,500 | $1.28 | 13d | 1 | 0.91mi |
| 2703 S County Road 1180 Midland, TX | 3.0 | 2.0 | 1566 | $3,400 | $2.17 | 44d | 1 | 1.25mi |
| 805 S Weatherford St Midland, TX | 3.0 | 2.0 | 1368 | $1,300 | $0.95 | 21d | 1 | 1.27mi |
| 1200 Albert Midland, TX | 3.0 | 2.0 | 925 | $2,442 | $2.64 | 13d | 311 | 1.33mi |
| 1201 Albert Midland, TX | 1.0–3.0 | 1.0–2.0 | 1037 | $2,174 | $2.10 | 13d | 20 | 1.35mi |
| 1509 Wayside Dr Midland, TX | 1.0–3.0 | 1.0–2.0 | 980 | $1,292 | $1.32 | 44d | 1 | 1.43mi |
| 1807 W Kentucky Ave Midland, TX | 3.0 | 2.0 | 1696 | $2,800 | $1.65 | 21d | 1 | 1.45mi |
Listing history 21 events
-
2026-06-19days on market $210,000 Active 283 DOM
-
2026-06-18days on market $210,000 Active 282 DOM
-
2026-06-17days on market $210,000 Active 281 DOM
-
2026-06-16days on market $210,000 Active 280 DOM
-
2026-06-15days on market $210,000 Active 279 DOM
-
2026-06-14days on market $210,000 Active 277 DOM
-
2026-06-13days on market $210,000 Active 276 DOM
-
2026-06-10days on market $210,000 Active 274 DOM
-
2026-06-09days on market $210,000 Active 273 DOM
-
2026-06-08days on market $210,000 Active 272 DOM
-
2026-06-07pricedays on market $210,000 Active 271 DOM
-
2026-06-03days on market $215,000 Active 267 DOM
-
2026-06-02days on market $215,000 Active 266 DOM
-
2026-06-01days on market $215,000 Active 265 DOM
-
2026-05-31days on market $215,000 Active 264 DOM
-
2026-05-30days on market $215,000 Active 263 DOM
-
2025-09-23price $215,000 258-char remark
Show marketing remark (258 chars)
CALLING ALL INVESTORS! THIS 4 BEDROOM 2 1/2 BATH IS AN AFFORDABLE INVESTMENT PROPERTY WITH BIG POTENTIAL! FEATURING VINYL FLOORING, OPEN KITCHEN/LIVING LAYOUT, REFRIGERATOR INCLUDED! LARGE FENCED FRONT AND BACK YARD GREAT LOCATION RIGHT OFF OF INTERSTATE 20!
-
2025-09-09$225,000 Active 258-char remark
Show marketing remark (258 chars)
CALLING ALL INVESTORS! THIS 4 BEDROOM 2 1/2 BATH IS AN AFFORDABLE INVESTMENT PROPERTY WITH BIG POTENTIAL! FEATURING VINYL FLOORING, OPEN KITCHEN/LIVING LAYOUT, REFRIGERATOR INCLUDED! LARGE FENCED FRONT AND BACK YARD GREAT LOCATION RIGHT OFF OF INTERSTATE 20!
-
2023-05-10soldstatus
-
2021-07-16soldstatus
-
2001-10-24soldstatus
ⓘ Source: listings_history table (triggers on properties + properties_extension) + one-shot
backfill from property_details.listing_events for pre-trigger history.
Tax reassessment forecast TX · Resets to sale price
- Current annual tax
- $2,121 · $177/mo
- Projected year-2 tax
- $3,843 · $320/mo
- Expected delta
- +$1,722/yr (+$144/mo · 81.2%)
ⓘ Screening estimate from a state-policy table — verify with the county assessor before closing.
Climate risk First Street
- Flood 6/10 Major FEMA zone X · 70% chance over 30 yrs
- Wildfire 8/10 Severe
- Heat 6/10 Major 6 d/yr ≥102°F today · 19 d/yr by 30 yrs out
- Wind 2/10 Low 4% chance of damaging wind over 30 yrs
- Air quality 1/10 Low 0 unhealthy d/yr today · 0 by 30 yrs out
Nearby sold comps map
Loading sold comps map…
Walkable amenities ~0.75 mi
Loading nearby amenities…
Taxation est. · year 1
- Rental income
- $28,938
- − Mortgage interest
- −$11,763
- − Property taxes
- −$2,121
- − Insurance
- −$1,050
- − Repairs & maintenance
- −$2,315
- − Management
- −$2,315
- − Depreciation
- −$6,109
- Taxable income
- $3,265
- Est. tax owed @ 24.0%
- −$784
- After-tax cash flow
- $5,692/yr
For passive investors: Depreciation is non-cash, so a rental often shows a tax loss while cash-flowing — sheltering income. Rental losses are passive: they offset passive income freely, and up to $25,000/yr can offset ordinary (W-2) income if you actively participate and your MAGI is under $100k (phasing out to $0 by $150k); unused losses carry forward. On sale, claimed depreciation is recaptured at up to 25%, and gains may owe capital-gains tax (a 1031 exchange can defer both). Figures are a year-1 estimate at your 24.0% rate — not tax advice; consult a CPA.
Schools (NCES district)
- District
- Midland ISD
- NCES district ID
- 4830570
- Math proficiency
- 34% ▼ -7.00%
- Reading proficiency
- 36% ▬ 0.00%
- Median HH income
- $63,457
- Composite
- 31.63/100
- National rank
- #5938
- State rank
- #477 of 826 in TX
Livability — Midland
- Score
- 79/100
- State rank
- #57
- US rank
- #2192
Category grades
Schools grade is shown separately in the Schools card above.
Census & demographics
- Census place
- Midland, TX
- County
- Midland County · 168,494 people
- City population
- 168,494
- Metro
- Midland, TX
- Population (ZIP)
- 27,131
- Household income
- $57,346
- Rent vs Own
- Severe rent burden
- 938.0
Population outlook (Midland County) Hauer SSP2
- Today (2025)
- 220,895 people
- By 2030
- 253,667 · +14.8%
- By 2040
- 325,498 · +47.4%
- By 2050
- 404,168 · +83.0%
- By 2075
- 609,802 · +176.1%
- By 2100
- 760,172 · +244.1%
Race, ethnicity, and origin ACS 2023
- Neighborhood character
- Diverse neighborhood (Simpson 0.55)
- Race & ethnicity
- Hispanic / Latino 61% Two or more races 28% White 27% Black 10%
- Hispanic origin (detail)
- Mexican 57%
- Common ancestry
- Lithuanian 1% Slovak 1% Ukrainian 1%
- Foreign-born
- 17% · Canada
- Languages at home
- 55% English-only · Spanish 44%
Political lean MEDSL · Midland
- 2024 margin
- Solid R (+60.5) · D 19.3% · R 79.8%
- 2008→2024 swing
- -3.3pp toward R · 2008: -57.3pp · 2024: -60.5pp
- All cycles
- 2024: R+60.5 2020: R+56.6 2016: R+55.2 2012: R+61.5 2008: R+57.3
Not yet ingested
- Civics
- —
Market trends
- HPI YoY
- ▼ -227.32%
- Current HPI
- 234.6111
- Rent YoY
- ▲ 0.74%
- Metro
- Midland, TX
- State GDP YoY
- ▲ 3.95%
- F500 in state
- 110
Industry mix (Fortune 500 HQ in TX)
| Industry | F500 HQs | Revenue |
|---|---|---|
| Energy | 16 | $1,198B |
|
||
| Technology | 5 | $198B |
|
||
| Engineering / Construction | 4 | $72B |
|
||
| Energy Services | 3 | $60B |
|
||
| Utilities | 3 | $41B |
|
||
| Healthcare | 2 | $330B |
|
||
Price history
-4.4% since first listed5 events — show timeline
- 2025-09-23 Price Changed $215,000 PBBOR
- 2025-09-09 Listed $225,000 PBBOR
- 2023-05-10 Sold (Public Records) — Public Records
- 2021-07-16 Sold (Public Records) — Public Records
- 2001-10-24 Sold (Public Records) — Public Records
Property tax history
+4.6%/yrLatest (2025): $2,121 · -6.3% YoY. Source: county tax records.
Cash-flow waterfall
monthlySold comps — $/sqft
last 12 mo · ≤1 miLoading sold comps…