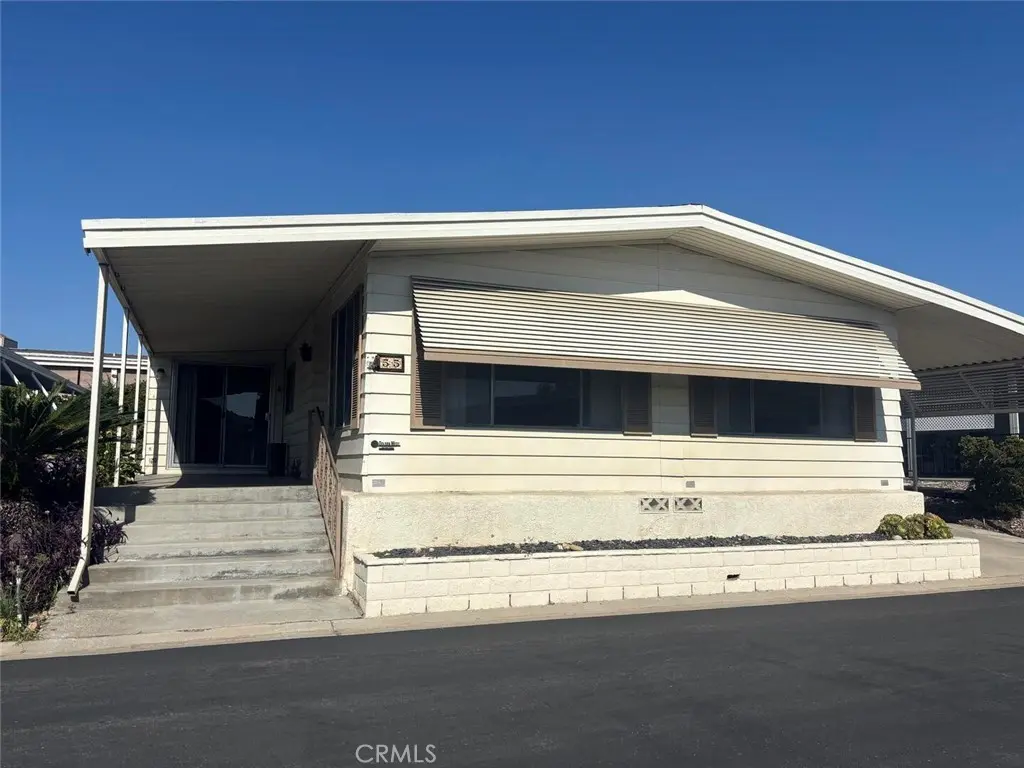
11730 Whittier Blvd #55 · West Whittier-Los Nietos, CA
Flood risk 1/10 · Minimal
- FEMA flood zone
- X (unshaded)
- Chance of flooding over 30 yrs
- 0.0%
- Est. flood insurance / yr
- $507 – $1,088
Fire risk 5/10 · Moderate
- Est. fire insurance / yr
- $659 – $1,223
Heat risk 6/10 · Moderate
- Hot days now (above 95°F)
- 7 days/yr
- Hot days in 30 yrs
- 21 days/yr
Wind risk 1/10 · Minimal
- Chance of severe wind over 30 yrs
- —
Air-quality risk 6/10 · Moderate
- Unhealthy air days now
- 9 days/yr
- Unhealthy air days in 30 yrs
- 10 days/yr
Risk factors via First Street. Map © Google.
Why this score? — see what drove the B grade
The composite is a weighted blend of 9 inputs, each scored 0–100. Each bar is that input's sub-score; the figure is the points it added to the 100-point composite (weight × sub-score).
- Cash flow +30.0/30.0
- 1% rule +10.0/10.0
- DSCR +10.0/10.0
- ARV discount +7.8/15.0
- Schools +4.7/10.0
- Rent growth +3.3/5.0
- Livability +2.5/5.0
- Condition / age +2.5/5.0
- Appreciation +0.0/10.0
$164,000
🖨 Deal sheet (PDF) 📄 Offer letter ✓ Due diligence
Listing remarks
Welcome to this beautifully fully remodeled and spacious home offering over 2,000 sq. ft. of comfortable living space in 55+ Senior Community. Featuring two bedrooms and two full bathrooms, this property blends modern updates with a bright, open layout that’s perfect for entertaining or everyday living. Step inside to a large living room that flows seamlessly into the formal dining area. The expansive family room is a true highlight - featuring a stunning decorative stone wood-burning fireplace, a built-in desk with cabinetry, and a massive walk-in closet for extra storage. A sliding glass door opens to the large covered front patio, creating an ideal space to relax and enjoy the bree
Key facts
- Fully remodeled
- Large living room
- Formal dining area
Tags
Property features AI
Finance
- Other: Accessibility with 2+ access exits
- Financial info: Land lease amount (reported): $2,310
- HOA & community: Senior community; Whittier Downs park; Community features include curbs, biking paths, street lighting, suburban setting; Land lease
Exterior
- Parking: Covered parking; Attached carport; Private driveway
- Security: Gated community; Manager approval required
- Utilities: Public sewer; District/public water
- Home design: Manufactured home (mobile home remains); Single-story; One-level entry
- Construction: Mobile dimensions approximately 12' x 60'; Year built source: Builder; Double body type
- Exterior features: Awning; Community pool; Has view
Interior
- Kitchen: Remodeled kitchen; Kitchen open to family room; Kitchen island; Self-closing drawers; Gas cooktop; Gas oven; Dishwasher
- Bedrooms: Primary bedroom on main floor; Walk-in closet; Main floor bedroom; Primary bathroom
- Bathrooms: Two full bathrooms; Main floor full bath; Upgraded finishes; Separate tub and walk-in shower; Double sinks in primary bath
- Interior features: Beamed ceilings; High (9+ foot) ceilings; Ceiling fan; Pantry; Recessed lighting; Open floor plan; Storage space; Gated community
- Laundry & utility: Laundry room inside; Washer hookup; Gas dryer hookup; Individual laundry room
Neighborhood map
What this means for you Summary
Snapshot
- This is a 2-bed/2.0-bath manufactured listed at $164k.
Deal economics
- At list price, monthly cash flow is $908 ($11k/yr) — positive.
- The deal already cash-flows at list — no discount required.
- Meets the 1% rule at list price ($3k rent vs $164k).
- Recommended offer: $162k (1.5% below list) — sets the bar for market timing.
- Cap rate 12.9% vs local median 2.9% in West Whittier-Los Nietos — top-decile yield for the area; either an underpriced asset or a hidden risk that comps aren't pricing in. Stress-test before assuming the spread holds.
Location & tenants
- Location reads: area grade B — affects rentability + tenant quality, not the cash-flow math above.
- Whittier Union High (suburban): math 42% / reading 65% proficiency, ranked #111 of 517 in CA (top 22%) — acceptable for families but not a draw, mixed tenant base, ~2y average lease.
- Zoned schools: Christian Sorensen Elementary (488 students, 67% FRL); Katherine Edwards Middle (916 students, 73% FRL); Whittier High (math 43% / reading 60%, grade D+, #312 of 1,170 statewide, top 27%, 1,767 students, 85% FRL) — zoned schools average 75% FRL vs 26% district-wide (49 pts higher); higher-poverty schools than district average — tighter screening recommended.
- Market conditions: Rents rising (+3.4%/yr); 77 active listings in the ZIP; 2 comparable units currently listed for rent nearby; solid renter incomes; 19,697 units permitted in Los Angeles County in 2024 (9,426 in 5+ unit buildings).
Forward outlook
- Local home prices are declining (-3.0%/yr); year-one equity from $1k of loan paydown is wiped out by about $5k of value loss. Plan a longer hold.
- Los Angeles County population projected at +9% by 2050 — modest demand growth; plan on rents tracking national, not racing it.
- At projected returns (-3.0% appreciation + 3.4% rent growth), your $46k cash investment doubles in ~6 years — after that, you're playing with house money.
Negotiation context
- It's been on market 17 days — a 2% lower offer ($162k) is reasonable based on typical stale-listing flexibility.
- 9 sale attempts since 26y ago with the ask held roughly flat each time — persistent listings suggest the price (not the market) is what's stuck; bring a comps-based counter.
- Current owner paid $80k; list at $164k implies a 106% gain — meaningful room to come down on a strong offer.
Risks & watch-outs
- Climate carrying-cost: moderate wildfire risk; extreme-heat days projected 7→21/yr by 2055 (HVAC capex compounding) — expect insurance premiums to compound above CPI over the hold.
Questions for the listing agent
- Built in 1978 — when were the roof, HVAC, electrical panel, plumbing, and water heater last replaced?
- Is there a deadline driving the sale (1031 exchange, divorce, estate, relocation)? That informs how much negotiation room exists.
- What's the average days-on-market for RENTAL listings here right now (not sales)? A rising rental-DOM trend means longer vacancies and softer asking-rent achievability than the comps imply.
- What's the recent tenant-quality profile in this submarket — average credit score on applications, eviction rate, late-payment / NSF rate, and stable-employment percentage? A property-management company in the area should have these aggregated.
- How much new for-sale + rental construction is in the pipeline within 1–3 miles? Heavy new supply typically softens prices + rents 12–24 months out; constrained supply supports both.
Investment metrics
- 1% rule
- 1.58% ✓
- Cap rate
- 12.94%
- Cash-on-cash
- 23.74%
- DSCR
- 2.06
- GRM
- 5.3
CMA / ARV
- ARV (on-the-fly)
- $165,240
- Comps found
- 2
Show comp detail 2 sales within ~0.75 mi
| Address | Dist | Beds/Ba | Sqft | Sold | Price | $/sf | Match |
|---|---|---|---|---|---|---|---|
| 11730 Whittier Blvd #55 | 0.00mi | 2/2.0 | 2,040 (0%) | 10mo | $79,500 | $39 | 92 |
| 11730 Whittier Blvd #39 | 0.12mi | 2/2.0 | 1,800 (-12%) | 0mo | $145,000 | $81 | 74 |
Match score weights: distance 35% · size 25% · config 20% · recency 20%. Top-matched comps best support the ARV.
Projected returns pro-forma
-3.0% appreciation · 3.39% rent growth · sell at horizon
- IRR
- 17.4%
- Equity multiple
- 1.70×
- Total profit
- $32,343
- Equity at exit
- $24,453
- IRR
- 26.1%
- Equity multiple
- 3.33×
- Total profit
- $107,038
- Equity at exit
- $14,180
Cash invested: $45,920 (down + closing). Projections, not guarantees.
Landlord ↔ Tenant lean methodology
- Overall (STATE)
- 18 Strongly Tenant-Friendly
- State California
- 18 Strongly Tenant-Friendly · D+13
- County
- — inherits STATE
- City
- — inherits STATE
ZIP-level market 90601
- Rents YoY
- 3.4%
- Active inventory
- 77
- Price-to-rent
- 5.3×
Monthly cashflow live
- Estimated rent
- $2,585 medium interval (Pro) →
- Mortgage (P&I)
- −$860
- Tax est. 1.5%
- −$205 /mo · $2,460/yr
- Insurance
- −$68
- HOA
- −$0
- Lot rent leased land?
- −$0
- Vacancy / Maint / Mgmt
- −$543
- Net cashflow
- $908
Break-even live
Sensitivity live
| Price | -10% $1,022 | -5% $965 | +0% $908 | +5% $852 | +10% $795 |
|---|---|---|---|---|---|
| Rent | -10% $704 | -5% $806 | +0% $908 | +5% $1,011 | +10% $1,113 |
| Rate | -1.0pp $991 | -0.5pp $950 | base $908 | +0.5pp $866 | +1.0pp $823 |
UW: 25.0% down · 7.5% · 30yr · 1.5% tax · 5.0% vac · 8.0% maint · 8.0% mgmt
Financing live
Cash to close
- Down payment
- $41,000
- Closing costs
- $4,920
- Reserves months
- —
- Total cash needed
- —
Loan-product check · same deal, 3 products live
Conventional
25% down · 7.5% · 30yr
- Down + closing
- —
- Monthly P&I
- —
- Monthly cashflow
- —
- DSCR
- —
- Eligible?
- —
Personal DTI + credit; lowest rate.
DSCR
20% down · 8.5% · 30yr
- Down + closing
- —
- Monthly P&I
- —
- Monthly cashflow
- —
- DSCR
- —
- Eligible?
- —
No personal income docs; deal must DSCR.
Hard money
10% down · 12.0% · 12mo
- Down + closing
- —
- Monthly P&I
- —
- Monthly cashflow
- —
- DSCR
- —
- Eligible?
- —
Short-term bridge; refi at stabilization.
Rent comps 2 comps
| Address | Beds | Baths | Sqft | Rent | $/sqft | DOM | Units | Dist |
|---|---|---|---|---|---|---|---|---|
| 7026 Friends Ave Whittier, CA | 3.0 | 2.0 | 1657 | $4,250 | $2.56 | 0d | 1 | 1.18mi |
| 11801 N Circle Dr Whittier, CA | 3.0 | 3.0 | 2156 | $4,400 | $2.04 | 0d | 1 | 1.40mi |
Listing history 37 events
-
2026-06-22days on market $164,000 Active 17 DOM
-
2026-06-21days on market $164,000 Active 16 DOM
-
2026-06-18days on market $164,000 Active 13 DOM
-
2026-06-17days on market $164,000 Active 12 DOM
-
2026-06-16days on market $164,000 Active 11 DOM
-
2026-06-15days on market $164,000 Active 10 DOM
-
2026-06-13days on market $164,000 Active 8 DOM
-
2026-06-13days on market $164,000 Active 7 DOM
-
2026-06-09days on market $164,000 Active 4 DOM
-
2026-06-08days on market $164,000 Active 3 DOM
-
2026-06-07pricedays on market $164,000 Active 2 DOM
-
2026-06-01days on market $174,000 Active 55 DOM
-
2026-05-31days on market $174,000 Active 54 DOM
-
2026-05-14price $174,000
-
2026-04-07$179,000 Active
-
2026-04-01historical
-
2026-02-03price $179,000
-
2026-01-10historical
-
2026-01-02$189,000 Active
-
2025-10-19$189,000 Active
-
2025-10-15historical
-
2025-08-20soldstatus $79,500 Closed Sale
-
2025-07-30historical Active Under Contract
-
2025-07-09price $79,500
-
2025-07-07price $79,950
-
2025-06-04$88,500 Active
-
2025-05-18price $99,950
-
2025-05-05price $104,950
-
2025-04-16status Active
-
2025-04-09status Pending Sale
-
2025-02-13price $114,950
-
2024-12-09$124,950 Active
-
2008-05-16soldstatus $45,000
-
2008-05-01historical
-
2008-01-31$67,900
-
2000-02-20soldstatus $39,900
-
2000-01-10$39,900
ⓘ Source: listings_history table (triggers on properties + properties_extension) + one-shot
backfill from property_details.listing_events for pre-trigger history.
Climate risk First Street
- Flood 1/10 Low FEMA zone X (unshaded) · 0% chance over 30 yrs
- Wildfire 5/10 Major
- Heat 6/10 Major 7 d/yr ≥95°F today · 21 d/yr by 30 yrs out
- Wind 1/10 Low
- Air quality 6/10 Major 9 unhealthy d/yr today · 10 by 30 yrs out
Nearby sold comps map
Loading sold comps map…
Walkable amenities ~0.75 mi
Loading nearby amenities…
Taxation est. · year 1
- Rental income
- $31,015
- − Mortgage interest
- −$9,187
- − Property taxes
- −$2,460
- − Insurance
- −$820
- − Repairs & maintenance
- −$2,481
- − Management
- −$2,481
- − Depreciation
- −$4,771
- Taxable income
- $8,815
- Est. tax owed @ 24.0%
- −$2,116
- After-tax cash flow
- $8,786/yr
For passive investors: Depreciation is non-cash, so a rental often shows a tax loss while cash-flowing — sheltering income. Rental losses are passive: they offset passive income freely, and up to $25,000/yr can offset ordinary (W-2) income if you actively participate and your MAGI is under $100k (phasing out to $0 by $150k); unused losses carry forward. On sale, claimed depreciation is recaptured at up to 25%, and gains may owe capital-gains tax (a 1031 exchange can defer both). Figures are a year-1 estimate at your 24.0% rate — not tax advice; consult a CPA.
Schools (NCES district)
- District
- Whittier Union High
- NCES district ID
- 0642480
- Math proficiency
- 42% ▲ 9.00%
- Reading proficiency
- 65% ▲ 7.00%
- Median HH income
- $66,675
- Composite
- 47.19/100
- National rank
- #2321
- State rank
- #111 of 517 in CA
Livability — West Whittier-Los Nietos
No livability data for this city. (Only ~50 U.S. cities are tracked.)
Census & demographics
- Census place
- West Whittier-Los Nietos, CA
- County
- Los Angeles County · 9,444,647 people
- City population
- 31,881
- Metro
- Los Angeles-Long Beach-Anaheim, CA
- Population (ZIP)
- 30,078
- Household income
- $104,052
- Rent vs Own
- Severe rent burden
- 1104.0
Population outlook (Los Angeles County) Hauer SSP2
- Today (2025)
- 10,940,515 people
- By 2030
- 11,256,481 · +2.9%
- By 2040
- 11,729,929 · +7.2%
- By 2050
- 11,948,407 · +9.2%
- By 2075
- 11,818,114 · +8.0%
- By 2100
- 10,842,928 · -0.9%
Race, ethnicity, and origin ACS 2023
- Neighborhood character
- Predominantly Hispanic (71%)
- Race & ethnicity
- Hispanic / Latino 71% Two or more races 19% White 18% Asian 5% Native American 3% Black 1%
- Hispanic origin (detail)
- Mexican 59%
- Common ancestry
- Lithuanian 2% Iranian 1% Slovak 1%
- Foreign-born
- 19% · Canada, China
- Languages at home
- 55% English-only · Spanish 39% Other Indo-European 2% Tagalog/Filipino 1%
Political lean MEDSL · Los Angeles
- 2024 margin
- Solid D (+32.9) · D 64.8% · R 31.9% · Other 3.3%
- 2008→2024 swing
- -7.4pp toward R · 2008: 40.4pp · 2024: 32.9pp
- All cycles
- 2024: D+32.9 2020: D+44.2 2016: D+48.0 2012: D+40.0 2008: D+40.4
Not yet ingested
- Civics
- —
Market trends
- HPI YoY
- ▼ -890.50%
- Current HPI
- 378.8101
- Rent YoY
- ▲ 3.39%
- Metro
- Los Angeles-Long Beach-Anaheim, CA
- State GDP YoY
- ▲ 3.21%
- F500 in state
- 116
Industry mix (Fortune 500 HQ in CA)
| Industry | F500 HQs | Revenue |
|---|---|---|
| Technology | 27 | $1,492B |
|
||
| Financial Services | 3 | $174B |
|
||
| Retail | 3 | $44B |
|
||
| Insurance | 3 | $26B |
|
||
| Media / Entertainment | 2 | $115B |
|
||
| Pharmaceuticals / Biotech | 2 | $62B |
|
||
Price history
+311.0% since first listed26 events — show timeline
- 2026-06-05 Listed $164,000 CRMLS
- 2026-06-01 Listing Removed — CRMLS
- 2026-05-14 Price Changed $174,000 CRMLS
- 2026-04-07 Listed $179,000 CRMLS
- 2026-04-01 Listing Removed — CRMLS
- 2026-02-03 Price Changed $179,000 CRMLS
- 2026-01-10 Listing Removed — CRMLS
- 2026-01-02 Listed $189,000 CRMLS
- 2025-10-19 Listed $189,000 CRMLS
- 2025-10-15 Coming Soon — CRMLS
- 2025-08-20 Sold (MLS) $79,500 CRMLS
- 2025-07-30 Contingent — CRMLS
- 2025-07-09 Price Changed $79,500 CRMLS
- 2025-07-07 Price Changed $79,950 CRMLS
- 2025-06-04 Listed $88,500 CRMLS
- 2025-05-18 Price Changed $99,950 CRMLS
- 2025-05-05 Price Changed $104,950 CRMLS
- 2025-04-16 Relisted — CRMLS
- 2025-04-09 Pending — CRMLS
- 2025-02-13 Price Changed $114,950 CRMLS
- 2024-12-09 Listed $124,950 CRMLS
- 2008-05-16 Sold (MLS) $45,000 CRMLS
- 2008-05-01 Listing Removed — CRMLS
- 2008-01-31 Listed $67,900 CRMLS
- 2000-02-20 Sold (MLS) $39,900 CRMLS
- 2000-01-10 Listed $39,900 CRMLS
Cash-flow waterfall
monthlySold comps — $/sqft
last 12 mo · ≤1 miLoading sold comps…