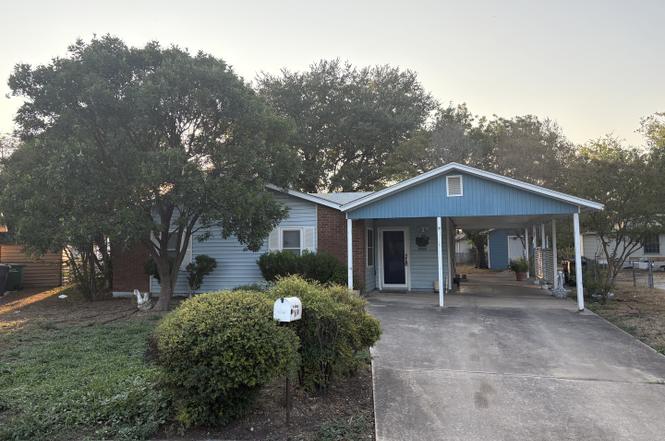
2727 Coldstream St · San Antonio, TX
Flood risk 1/10 · Minimal
- FEMA flood zone
- X (unshaded)
- Chance of flooding over 30 yrs
- 0.0%
- Est. flood insurance / yr
- $507 – $1,088
Fire risk 2/10 · Minimal
- Est. fire insurance / yr
- $1,222 – $2,270
Heat risk 8/10 · Major
- Hot days now (above 109°F)
- 7 days/yr
- Hot days in 30 yrs
- 22 days/yr
Wind risk 8/10 · Major
- Chance of severe wind over 30 yrs
- 80.0%
Air-quality risk 2/10 · Minimal
- Unhealthy air days now
- 0 days/yr
- Unhealthy air days in 30 yrs
- 1 days/yr
Risk factors via First Street. Map © Google.
Why this score? — see what drove the B- grade
The composite is a weighted blend of 9 inputs, each scored 0–100. Each bar is that input's sub-score; the figure is the points it added to the 100-point composite (weight × sub-score).
- Cash flow +18.6/30.0
- ARV discount +15.0/15.0
- Appreciation +10.0/10.0
- DSCR +5.8/10.0
- 1% rule +5.6/10.0
- Livability +4.0/5.0
- Rent growth +2.7/5.0
- Condition / age +2.5/5.0
- Schools +1.4/10.0
$129,500
🖨 Deal sheet (PDF) 📄 Offer letter ✓ Due diligence
Listing remarks
Step into comfort and affordability with this charming 2-bedroom, 1-bath home-complete with a versatile bonus room that adapts to your lifestyle. Whether you need a cozy home office, a guest room, or a play space, this extra room gives you options without stretching your budget. The open layout inside makes the home feel bright and welcoming, while the manageable size means less time on upkeep and more time enjoying life. It's the perfect fit for first-time buyers, downsizers, or anyone looking for a smart investment that blends practicality with charm. That's not all-outside, you'll find a 100 sq. ft. shed, perfect for extra storage, a workshop, or even a hobby studio. It's a flexible spac
Key facts
- Bonus room
- 100 sq ft shed
- 6,298 sq ft lot
Tags
Neighborhood map
What this means for you Summary
Snapshot
- This is a 3-bed/1.0-bath single-family listed at $130k.
Deal economics
- At list price, monthly cash flow is $124 ($1k/yr) — positive.
- The deal already cash-flows at list — no discount required.
- Meets the 1% rule at list price ($1k rent vs $130k).
- Recommended offer: $122k (6.0% below list) — sets the bar for market timing.
- Cap rate 7.4% vs local median 3.8% in San Antonio — top-decile yield for the area; either an underpriced asset or a hidden risk that comps aren't pricing in. Stress-test before assuming the spread holds.
Location & tenants
- Location reads 80/100 on livability (#31 in TX, #1,616 nationally) — a professional / high-income tenant draw. Strengths: amenities A+, commute A+, cost of living A+; Watch: crime F.
- South San Antonio ISD (urban): math 13% / reading 20% proficiency, ranked #804 of 826 in TX (top 97%) — low school quality limits family demand, transient renter base, plan for 1-2y turnover.
- Zoned schools: Kindred El (math 12% / reading 8%, grade F, #4,259 of 4,322 statewide, top 99%, 343 students, 94% FRL); South San Antonio H S (math 27% / reading 32%, grade F, #1,112 of 1,632 statewide, top 70%, 1,786 students, 93% FRL) — zoned schools average 93% FRL vs 42% district-wide (52 pts higher); higher-poverty schools than district average — tighter screening recommended.
- Market conditions: Rents flat; 276 active listings in the ZIP; 18 comparable units currently listed for rent nearby; rentals at typical pace (median 25d on market — plan ~3-4 weeks tenant-placement turnaround); 8,308 units permitted in Bexar County in 2024 (2,506 in 5+ unit buildings).
Forward outlook
- In year one you build about $14k of equity ($895 loan paydown + $13k appreciation (10.0% local appreciation)).
- Bexar County population projected at +50% by 2050 — long-run rental-demand tailwind backs the buy-and-hold thesis.
- At projected returns (10.0% appreciation + 0.8% rent growth), your $36k cash investment doubles in ~3 years — after that, you're playing with house money.
- By year 3, paydown + projected appreciation supports a ~$35k cash-out refi (75% LTV) — recoverable capital for the next deal without selling this one.
Negotiation context
- It's been on market 83 days — a 6% lower offer ($122k) is reasonable based on typical stale-listing flexibility.
- 2 sale attempts with the ask held roughly flat each time — persistent listings suggest the price (not the market) is what's stuck; bring a comps-based counter.
Risks & watch-outs
- Climate carrying-cost: severe wind risk, 80% chance of damaging wind over 30y; extreme-heat days projected 7→22/yr by 2055 (HVAC capex compounding) — expect insurance premiums to compound above CPI over the hold.
Questions for the listing agent
- It's been on market 83 days. Have you received any prior offers? Is the seller open to a 6% concession, seller financing, or rate buy-down credit?
- Built in 1965 — when were the roof, HVAC, electrical panel, plumbing, and water heater last replaced?
- Why hasn't it sold? Are there any deal-killer items the seller is aware of (foundation, flood, title, zoning, code violations)?
- Is there a deadline driving the sale (1031 exchange, divorce, estate, relocation)? That informs how much negotiation room exists.
- Crime grade is F in this area — have there been break-ins, vandalism, or insurance claims at this property in the last 3 years? What carrier currently insures it and at what premium?
- What's the average days-on-market for RENTAL listings here right now (not sales)? A rising rental-DOM trend means longer vacancies and softer asking-rent achievability than the comps imply.
- What's the recent tenant-quality profile in this submarket — average credit score on applications, eviction rate, late-payment / NSF rate, and stable-employment percentage? A property-management company in the area should have these aggregated.
- How much new for-sale + rental construction is in the pipeline within 1–3 miles? Heavy new supply typically softens prices + rents 12–24 months out; constrained supply supports both.
Investment metrics
- 1% rule
- 1.06% ✓
- Cap rate
- 7.45%
- Cash-on-cash
- 4.12%
- DSCR
- 1.18
- GRM
- 7.8
CMA / ARV
- ARV (on-the-fly)
- $187,458
- Comps found
- 11
Show comp detail 11 sales within ~0.75 mi
| Address | Dist | Beds/Ba | Sqft | Sold | Price | $/sf | Match |
|---|---|---|---|---|---|---|---|
| 2727 Coldstream St | 0.00mi | 2/1.0 (-1) | 1,194 (0%) | 2mo | $129,500 | $108 | 93 |
| 919 Palo Alto | 0.27mi | 3/1.0 | 1,131 (-5%) | 8mo | $127,000 | $112 | 72 |
| 3010 W Navajo | 0.31mi | 3/2.0 | 1,226 (+3%) | 7mo | $125,000 | $102 | 71 |
| 166 Pima St | 0.32mi | 3/2.0 | 1,100 (-8%) | 6mo | $165,000 | $150 | 63 |
| 155 Iroquois St | 0.35mi | 3/2.0 | 1,201 (+1%) | 18mo | $198,000 | $165 | 63 |
| 203 Yuma St | 0.30mi | 3/2.0 | 1,098 (-8%) | 18mo | $185,000 | $168 | 54 |
| 3214 La Rosa | 0.68mi | 3/1.0 | 1,152 (-4%) | 16mo | $210,000 | $182 | 49 |
| 247 Iroquois | 0.51mi | 2/2.0 (-1) | 1,121 (-6%) | 11mo | $135,000 | $120 | 48 |
| 3206 La Rosa | 0.66mi | 3/2.0 | 1,080 (-10%) | 2mo | $179,000 | $166 | 48 |
| 2519 Patron | 0.64mi | 3/2.0 | 1,310 (+10%) | 13mo | $215,000 | $164 | 39 |
| 2250 Sundrop Bay | 0.74mi | 4/2.0 (+1) | 1,339 (+12%) | 12mo | $209,999 | $157 | 27 |
Match score weights: distance 35% · size 25% · config 20% · recency 20%. Top-matched comps best support the ARV.
Projected returns pro-forma
10.0% appreciation · 0.83% rent growth · sell at horizon
- IRR
- 26.4%
- Equity multiple
- 3.08×
- Total profit
- $75,575
- Equity at exit
- $116,664
- IRR
- 22.6%
- Equity multiple
- 6.82×
- Total profit
- $210,984
- Equity at exit
- $251,590
Cash invested: $36,260 (down + closing). Projections, not guarantees.
Landlord ↔ Tenant lean methodology
- Overall (STATE)
- 87 Strongly Landlord-Friendly
- State Texas
- 87 Strongly Landlord-Friendly · R+5
- County
- — inherits STATE
- City
- — inherits STATE
ZIP-level market 78224
- Home prices YoY
- 12.4%
- Rents YoY
- 0.8%
- Active inventory
- 276
- Price-to-rent
- 7.8×
Monthly cashflow live
- Estimated rent
- $1,379 high interval (Pro) →
- Mortgage (P&I)
- −$679
- Tax from tax record
- −$232 /mo · $2,780/yr
- Insurance
- −$54
- HOA
- −$0
- Vacancy / Maint / Mgmt
- −$290
- Net cashflow
- $124
Break-even live
Sensitivity live
| Price | -10% $198 | -5% $161 | +0% $124 | +5% $88 | +10% $51 |
|---|---|---|---|---|---|
| Rent | -10% $16 | -5% $70 | +0% $124 | +5% $179 | +10% $233 |
| Rate | -1.0pp $190 | -0.5pp $157 | base $124 | +0.5pp $91 | +1.0pp $57 |
UW: 25.0% down · 7.5% · 30yr · 1.5% tax · 5.0% vac · 8.0% maint · 8.0% mgmt
Financing live
Cash to close
- Down payment
- $32,375
- Closing costs
- $3,885
- Reserves months
- —
- Total cash needed
- —
Loan-product check · same deal, 3 products live
Conventional
25% down · 7.5% · 30yr
- Down + closing
- —
- Monthly P&I
- —
- Monthly cashflow
- —
- DSCR
- —
- Eligible?
- —
Personal DTI + credit; lowest rate.
DSCR
20% down · 8.5% · 30yr
- Down + closing
- —
- Monthly P&I
- —
- Monthly cashflow
- —
- DSCR
- —
- Eligible?
- —
No personal income docs; deal must DSCR.
Hard money
10% down · 12.0% · 12mo
- Down + closing
- —
- Monthly P&I
- —
- Monthly cashflow
- —
- DSCR
- —
- Eligible?
- —
Short-term bridge; refi at stabilization.
Rent comps 18 comps
| Address | Beds | Baths | Sqft | Rent | $/sqft | DOM | Units | Dist |
|---|---|---|---|---|---|---|---|---|
| 2800 W Hutchins Pl Apt 710 San Antonio, TX | 2.0 | 2.0 | 771 | $991 | $1.29 | 4d | 1 | 0.17mi |
| 151 Hopi St San Antonio, TX | 2.0 | 1.0 | 850 | $1,100 | $1.29 | 44d | 1 | 0.30mi |
| 130 Camino de Oro San Antonio, TX | 1.0–2.0 | 1.0 | 629 | $1,060 | $1.69 | 2d | 40 | 0.38mi |
| 130 Camino de Oro San Antonio, TX | 2.0 | 1.0 | 629 | $1,690 | $2.69 | 44d | 10 | 0.38mi |
| 1862 Kendalia Ave San Antonio, TX | 3.0 | 1.0 | 1345 | $1,350 | $1.00 | 25d | 1 | 0.86mi |
| 3632 SW Military Dr #2 San Antonio, TX | 3.0 | 2.0 | 900 | $995 | $1.11 | 44d | 1 | 0.95mi |
| 3632 SW Military Dr Unit 14 San Antonio, TX | 2.0 | 1.0 | 700 | $915 | $1.31 | 23d | 1 | 0.97mi |
| 3632 SW Military Dr #13 San Antonio, TX | 3.0 | 1.5 | 850 | $1,115 | $1.31 | 23d | 1 | 0.97mi |
| 9018 Chaminade Dr San Antonio, TX | 3.0 | 1.5 | 1056 | $1,675 | $1.59 | 44d | 1 | 1.05mi |
| 518 Briggs St San Antonio, TX | 2.0 | 1.0 | 740 | $699 | $0.94 | 17d | 1 | 1.11mi |
| 518 Briggs Ave Apt 401 San Antonio, TX | 2.0 | 1.0 | 740 | $699 | $0.94 | 25d | 1 | 1.11mi |
| 8622 S Zarzamora St #423 San Antonio, TX | 3.0 | 2.0 | 1100 | $1,600 | $1.45 | 44d | 1 | 1.20mi |
| 838 King Ave San Antonio, TX | 3.0 | 2.0 | 1008 | $1,250 | $1.24 | 25d | 1 | 1.26mi |
| 737 W Mayfield Blvd San Antonio, TX | 3.0 | 1.0 | 1150 | $1,462 | $1.27 | 44d | 1 | 1.27mi |
| 3810 Kurz Plz S San Antonio, TX | 3.0 | 2.0 | 1266 | $550 | $0.43 | 25d | 1 | 1.41mi |
| 923 Whitman Ave San Antonio, TX | 4.0 | 2.0 | 1208 | $1,700 | $1.41 | 15d | 1 | 1.44mi |
| 1243 Gillette Blvd San Antonio, TX | 3.0 | 2.0 | 1456 | $1,500 | $1.03 | 25d | 1 | 1.44mi |
| 3911 Bates Pl San Antonio, TX | 3.0 | 2.0 | 1200 | $1,450 | $1.21 | 25d | 1 | 1.50mi |
Listing history 5 events
-
2026-04-27soldstatus
-
2025-12-01status Pending
-
2025-10-17status Back on Market
-
2025-09-18historical Active Option
-
2025-09-09$129,500 New
ⓘ Source: listings_history table (triggers on properties + properties_extension) + one-shot
backfill from property_details.listing_events for pre-trigger history.
Tax reassessment forecast TX · Resets to sale price
- Current annual tax
- $2,780 · $232/mo
- Projected year-2 tax
- $2,780 · $232/mo
- Expected delta
- $0/yr ($0/mo · 0.0%)
ⓘ Screening estimate from a state-policy table — verify with the county assessor before closing.
Climate risk First Street
- Flood 1/10 Low FEMA zone X (unshaded) · 0% chance over 30 yrs
- Wildfire 2/10 Low
- Heat 8/10 Severe 7 d/yr ≥109°F today · 22 d/yr by 30 yrs out
- Wind 8/10 Severe 80% chance of damaging wind over 30 yrs
- Air quality 2/10 Low 0 unhealthy d/yr today · 1 by 30 yrs out
Nearby sold comps map
Loading sold comps map…
Walkable amenities ~0.75 mi
Loading nearby amenities…
Taxation est. · year 1
- Rental income
- $16,545
- − Mortgage interest
- −$7,254
- − Property taxes
- −$2,780
- − Insurance
- −$648
- − Repairs & maintenance
- −$1,324
- − Management
- −$1,324
- − Depreciation
- −$3,767
- Taxable loss
- −$551
- Est. tax savings @ 24.0%
- +$132
- After-tax cash flow
- $1,626/yr
For passive investors: Depreciation is non-cash, so a rental often shows a tax loss while cash-flowing — sheltering income. Rental losses are passive: they offset passive income freely, and up to $25,000/yr can offset ordinary (W-2) income if you actively participate and your MAGI is under $100k (phasing out to $0 by $150k); unused losses carry forward. On sale, claimed depreciation is recaptured at up to 25%, and gains may owe capital-gains tax (a 1031 exchange can defer both). Figures are a year-1 estimate at your 24.0% rate — not tax advice; consult a CPA.
Schools (NCES district)
- District
- South San Antonio ISD
- NCES district ID
- 4840680
- Math proficiency
- 13% ▼ -20.00%
- Reading proficiency
- 20% ▼ -10.00%
- Median HH income
- $35,460
- Composite
- 13.6/100
- National rank
- #9511
- State rank
- #804 of 826 in TX
Livability — San Antonio
- Score
- 80/100
- State rank
- #31
- US rank
- #1616
Category grades
Schools grade is shown separately in the Schools card above.
Census & demographics
- Census place
- San Antonio, TX
- County
- Bexar County · 1,990,555 people
- City population
- 1,806,925
- Metro
- San Antonio-New Braunfels, TX
- Population (ZIP)
- 22,232
- Household income
- $59,891
- Rent vs Own
- Severe rent burden
- 721.0
Population outlook (Bexar County) Hauer SSP2
- Today (2025)
- 2,336,851 people
- By 2030
- 2,560,728 · +9.6%
- By 2040
- 3,020,569 · +29.3%
- By 2050
- 3,493,522 · +49.5%
- By 2075
- 4,668,459 · +99.8%
- By 2100
- 5,533,242 · +136.8%
Race, ethnicity, and origin ACS 2023
- Neighborhood character
- Predominantly Hispanic (90%)
- Race & ethnicity
- Hispanic / Latino 90% Two or more races 24% White 6% Native American 2% Asian 2%
- Hispanic origin (detail)
- Mexican 75%
- Common ancestry
- Italian 1%
- Foreign-born
- 18% · Canada, Vietnam, China
- Languages at home
- 44% English-only · Spanish 55% Chinese 1%
Political lean MEDSL · Bexar
- 2024 margin
- Lean D (+9.8) · D 54.3% · R 44.6% · Other 1.1%
- 2008→2024 swing
- +4.2pp toward D · 2008: 5.6pp · 2024: 9.8pp
- All cycles
- 2024: D+9.8 2020: D+18.2 2016: D+13.5 2012: D+4.6 2008: D+5.6
Not yet ingested
- Civics
- —
Market trends
- HPI YoY
- ▲ 29.95%
- Current HPI
- 272.0709
- Rent YoY
- ▲ 0.83%
- Metro
- San Antonio-New Braunfels, TX
- State GDP YoY
- ▲ 3.95%
- F500 in state
- 110
Industry mix (Fortune 500 HQ in TX)
| Industry | F500 HQs | Revenue |
|---|---|---|
| Energy | 16 | $1,198B |
|
||
| Technology | 5 | $198B |
|
||
| Engineering / Construction | 4 | $72B |
|
||
| Energy Services | 3 | $60B |
|
||
| Utilities | 3 | $41B |
|
||
| Healthcare | 2 | $330B |
|
||
Price history
5 events — show timeline
- 2026-04-27 Sold (Public Records) — Public Records
- 2025-12-01 Pending — LERA
- 2025-10-17 Relisted — LERA
- 2025-09-18 Contingent — LERA
- 2025-09-09 Listed $129,500 LERA
Property tax history
+5.5%/yrLatest (2025): $2,780 · +10.0% YoY. Source: county tax records.
Cash-flow waterfall
monthlySold comps — $/sqft
last 12 mo · ≤1 miLoading sold comps…