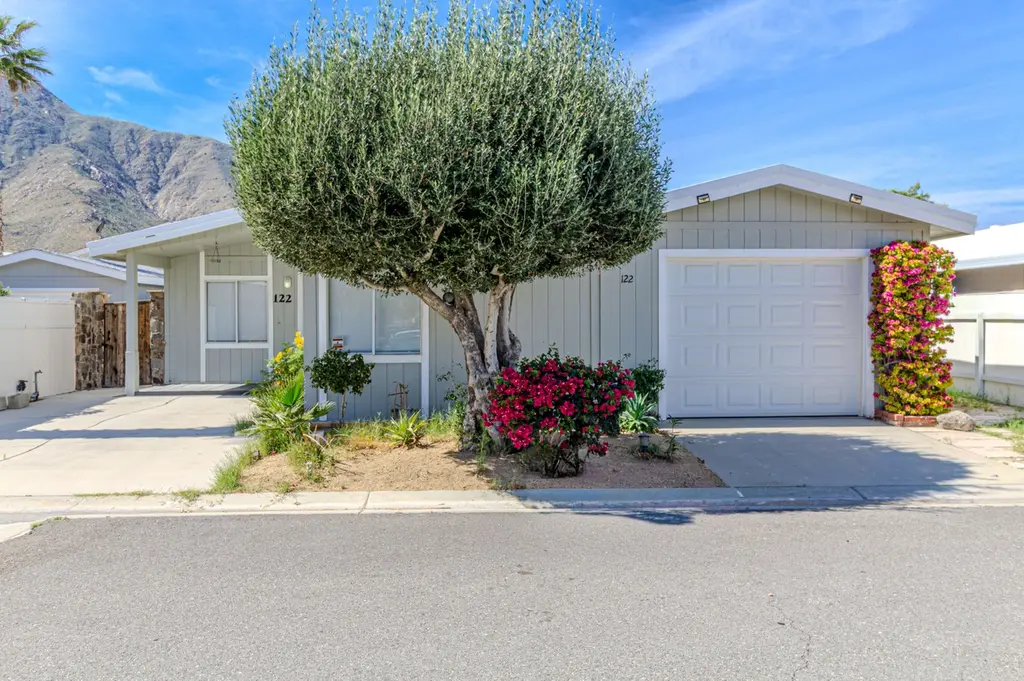
22840 Sterling Ave #122 · Palm Springs, CA
Flood risk 8/10 · Major
- FEMA flood zone
- A
- Chance of flooding over 30 yrs
- 0.99%
- Est. flood insurance / yr
- $1,009 – $1,996
Fire risk 7/10 · Major
- Est. fire insurance / yr
- $659 – $1,223
Heat risk 9/10 · Severe
- Hot days now (above 103°F)
- 7 days/yr
- Hot days in 30 yrs
- 19 days/yr
Wind risk 1/10 · Minimal
- Chance of severe wind over 30 yrs
- —
Air-quality risk 5/10 · Moderate
- Unhealthy air days now
- 8 days/yr
- Unhealthy air days in 30 yrs
- 10 days/yr
Risk factors via First Street. Map © Google.
Why this score? — see what drove the B grade
The composite is a weighted blend of 9 inputs, each scored 0–100. Each bar is that input's sub-score; the figure is the points it added to the 100-point composite (weight × sub-score).
- Cash flow +30.0/30.0
- ARV discount +11.1/15.0
- 1% rule +10.0/10.0
- DSCR +10.0/10.0
- Livability +3.3/5.0
- Schools +2.7/10.0
- Rent growth +2.6/5.0
- Condition / age +2.5/5.0
- Appreciation +0.0/10.0
$120,000
🖨 Deal sheet (PDF) 📄 Offer letter ✓ Due diligence
Listing remarks MLS
Enjoy beautiful mountain views from this well-maintained 2-bedroom, 2-bath home located in Sun Canyon Estates, a well-kept ALL AGE COMMUNITY in Palm Springs. The home features a spacious and open floor plan with a natural flow between the living, dining, and kitchen areas, creating an inviting space for both relaxing and entertaining. Large windows bring in natural light and enhance the open feel throughout the home. The primary suite offers privacy with its own en-suite bath, while the second bedroom is ideal for guests, a home office, or additional living space. Sun Canyon Estates offers amenities including a clubhouse, pool and spa, game and billiard room, playground, and a pet-friendly environment. Conveniently located near shopping, dining, golf courses, and everything Palm Springs has to offer, this home provides comfortable and easy desert living in a central location. Space rent for a new owner is anticipated to be approximately $950/month. Buyer to verify space rent and lease terms directly with park management.
Key facts
- Open floor plan
- Clubhouse
- Natural light
Tags
Neighborhood map
What this means for you Summary
Snapshot
- This is a 2-bed/2.0-bath manufactured listed at $120k.
Deal economics
- At list price, monthly cash flow is $1k ($14k/yr) — positive.
- The deal already cash-flows at list — no discount required.
- Meets the 1% rule at list price ($3k rent vs $120k).
- Recommended offer: $109k (9.0% below list) — sets the bar for market timing.
- Cap rate 19.2% vs local median 2.7% in Palm Springs — top-decile yield for the area; either an underpriced asset or a hidden risk that comps aren't pricing in. Stress-test before assuming the spread holds.
Location & tenants
- Location reads 66/100 on livability (#348 in CA) — a middle-class / working-renter tenant base. Strengths: amenities A+, commute A+; Watch: crime F, cost of living F, health & safety F.
- Palm Springs Unified (suburban): math 21% / reading 42% proficiency, ranked #328 of 517 in CA (top 63%) — families likely to look elsewhere, expect single-tenant / working-renter base with shorter leases; 73% free/reduced lunch — lower-income household profile, screen leases tightly.
- Zoned schools: Vista Del Monte Elementary (482 students, 96% FRL); Raymond Cree Middle (708 students, 98% FRL); Palm Springs High (math 30% / reading 51%, grade F, #508 of 1,170 statewide, top 44%, 1,584 students, 97% FRL) — zoned schools average 97% FRL vs 73% district-wide (24 pts higher); higher-poverty schools than district average — tighter screening recommended.
- Market conditions: Rents flat; 660 active listings in the ZIP; 1 comparable units currently listed for rent nearby; 9,195 units permitted in Riverside County in 2024 (1,512 in 5+ unit buildings).
- This rent runs 42% of the median local income ($72k/yr) — at the standard rent-burdened threshold; future hikes will face affordability resistance.
Forward outlook
- Local home prices are declining (-3.0%/yr); year-one equity from $830 of loan paydown is wiped out by about $4k of value loss. Plan a longer hold.
- Riverside County population projected at +22% by 2050 — long-run rental-demand tailwind backs the buy-and-hold thesis.
- At projected returns (-3.0% appreciation + 0.5% rent growth), your $34k cash investment doubles in ~3 years — after that, you're playing with house money.
Negotiation context
- It's been on market 106 days — a 9% lower offer ($109k) is reasonable based on typical stale-listing flexibility.
- 10 sale attempts since 13y ago with the ask held roughly flat each time — persistent listings suggest the price (not the market) is what's stuck; bring a comps-based counter.
Risks & watch-outs
- Watch-outs: flood insurance adds $125/mo.
- Climate carrying-cost: in FEMA flood zone A (mandatory federal flood insurance); major wildfire risk; extreme-heat days projected 7→19/yr by 2055 (HVAC capex compounding) — expect insurance premiums to compound above CPI over the hold.
Questions for the listing agent
- It's been on market 106 days. Have you received any prior offers? Is the seller open to a 9% concession, seller financing, or rate buy-down credit?
- What's the actual annual flood-insurance premium (NFIP or private), and is the property in a SFHA with mandatory coverage?
- Why hasn't it sold? Are there any deal-killer items the seller is aware of (foundation, flood, title, zoning, code violations)?
- Is there a deadline driving the sale (1031 exchange, divorce, estate, relocation)? That informs how much negotiation room exists.
- Crime grade is F in this area — have there been break-ins, vandalism, or insurance claims at this property in the last 3 years? What carrier currently insures it and at what premium?
- What's the average days-on-market for RENTAL listings here right now (not sales)? A rising rental-DOM trend means longer vacancies and softer asking-rent achievability than the comps imply.
- What's the recent tenant-quality profile in this submarket — average credit score on applications, eviction rate, late-payment / NSF rate, and stable-employment percentage? A property-management company in the area should have these aggregated.
- How much new for-sale + rental construction is in the pipeline within 1–3 miles? Heavy new supply typically softens prices + rents 12–24 months out; constrained supply supports both.
Investment metrics
- 1% rule
- 2.11% ✓
- Cap rate
- 19.21%
- Cash-on-cash
- 46.14%
- DSCR
- 3.05
- GRM
- 3.9
CMA / ARV
- ARV (median comp)
- $130,540
- List price
- $120,000
- Delta
- -8.07%
- Verdict
- FAIR
- Comps
- 4 within 1.0 mi
Show comp detail 5 sales within ~0.75 mi
| Address | Dist | Beds/Ba | Sqft | Sold | Price | $/sf | Match |
|---|---|---|---|---|---|---|---|
| 22840 Sterling Ave #142 | 0.00mi | 3/2.0 (+1) | 1,188 (+5%) | 7mo | $115,000 | $97 | 81 |
| 22840 Sterling Ave #4 | 0.00mi | 3/2.0 (+1) | 1,164 (+3%) | 11mo | $150,000 | $129 | 81 |
| 22840 Sterling Ave #35 | 0.00mi | 3/2.0 (+1) | 1,188 (+5%) | 10mo | $70,000 | $59 | 78 |
| 22840 Sterling Ave #73 | 0.00mi | 3/2.0 (+1) | 1,188 (+5%) | 15mo | $153,000 | $129 | 75 |
| 22840 Sterling Ave #186 | 0.00mi | 3/2.0 (+1) | 1,296 (+14%) | 7mo | $181,000 | $140 | 65 |
Match score weights: distance 35% · size 25% · config 20% · recency 20%. Top-matched comps best support the ARV.
Projected returns pro-forma
-3.0% appreciation · 0.46% rent growth · sell at horizon
- IRR
- 35.4%
- Equity multiple
- 2.45×
- Total profit
- $48,597
- Equity at exit
- $17,892
- IRR
- 40.8%
- Equity multiple
- 4.38×
- Total profit
- $113,560
- Equity at exit
- $10,375
Cash invested: $33,600 (down + closing). Projections, not guarantees.
Landlord ↔ Tenant lean methodology
- Overall (STATE)
- 18 Strongly Tenant-Friendly
- State California
- 18 Strongly Tenant-Friendly · D+13
- County
- — inherits STATE
- City
- — inherits STATE
ZIP-level market 92262
- Rents YoY
- 0.5%
- Active inventory
- 660
- Price-to-rent
- 3.9×
Monthly cashflow live
- Estimated rent
- $2,532 medium interval (Pro) →
- Mortgage (P&I)
- −$629
- Tax from tax record
- −$29 /mo · $348/yr
- Insurance
- −$50
- Flood insurance flood zone
- −$125 /mo · $1,502/yr
- HOA
- −$0
- Vacancy / Maint / Mgmt
- −$532
- Net cashflow
- $1,167
Break-even live
Sensitivity live
| Price | -10% $1,235 | -5% $1,201 | +0% $1,167 | +5% $1,133 | +10% $1,099 |
|---|---|---|---|---|---|
| Rent | -10% $967 | -5% $1,067 | +0% $1,167 | +5% $1,267 | +10% $1,367 |
| Rate | -1.0pp $1,227 | -0.5pp $1,197 | base $1,167 | +0.5pp $1,136 | +1.0pp $1,104 |
UW: 25.0% down · 7.5% · 30yr · 1.5% tax · 5.0% vac · 8.0% maint · 8.0% mgmt
Financing live
Cash to close
- Down payment
- $30,000
- Closing costs
- $3,600
- Reserves months
- —
- Total cash needed
- —
Loan-product check · same deal, 3 products live
Conventional
25% down · 7.5% · 30yr
- Down + closing
- —
- Monthly P&I
- —
- Monthly cashflow
- —
- DSCR
- —
- Eligible?
- —
Personal DTI + credit; lowest rate.
DSCR
20% down · 8.5% · 30yr
- Down + closing
- —
- Monthly P&I
- —
- Monthly cashflow
- —
- DSCR
- —
- Eligible?
- —
No personal income docs; deal must DSCR.
Hard money
10% down · 12.0% · 12mo
- Down + closing
- —
- Monthly P&I
- —
- Monthly cashflow
- —
- DSCR
- —
- Eligible?
- —
Short-term bridge; refi at stabilization.
Rent comps 1 comps
| Address | Beds | Baths | Sqft | Rent | $/sqft | DOM | Units | Dist |
|---|---|---|---|---|---|---|---|---|
| 22840 Sterling Ave #147 Palm Springs, CA | 3.0 | 2.0 | 1188 | $2,650 | $2.23 | 0d | 1 | 0.03mi |
Listing history 42 events
-
2026-06-18days on market $120,000 Active 106 DOM
-
2026-06-17days on market $120,000 Active 105 DOM
-
2026-06-16days on market $120,000 Active 104 DOM
-
2026-06-15days on market $120,000 Active 103 DOM
-
2026-06-13days on market $120,000 Active 101 DOM
-
2026-06-13days on market $120,000 Active 100 DOM
-
2026-06-09days on market $120,000 Active 97 DOM
-
2026-06-08days on market $120,000 Active 96 DOM
-
2026-06-07days on market $120,000 Active 95 DOM
-
2026-06-04days on market $120,000 Active 92 DOM
-
2026-06-03days on market $120,000 Active 91 DOM
-
2026-06-02days on market $120,000 Active 90 DOM
-
2026-06-01days on market $120,000 Active 89 DOM
-
2026-05-31days on market $120,000 Active 88 DOM
-
2026-03-03$120,000 Active 1036-char remark
Show marketing remark (1036 chars)
Enjoy beautiful mountain views from this well-maintained 2-bedroom, 2-bath home located in Sun Canyon Estates, a well-kept ALL AGE COMMUNITY in Palm Springs. The home features a spacious and open floor plan with a natural flow between the living, dining, and kitchen areas, creating an inviting space for both relaxing and entertaining. Large windows bring in natural light and enhance the open feel throughout the home. The primary suite offers privacy with its own en-suite bath, while the second bedroom is ideal for guests, a home office, or additional living space. Sun Canyon Estates offers amenities including a clubhouse, pool and spa, game and billiard room, playground, and a pet-friendly environment. Conveniently located near shopping, dining, golf courses, and everything Palm Springs has to offer, this home provides comfortable and easy desert living in a central location. Space rent for a new owner is anticipated to be approximately $950/month. Buyer to verify space rent and lease terms directly with park management.
-
2026-02-13historical
-
2026-02-08status Active
-
2026-01-26status Pending Sale
-
2026-01-14$135,000 Active
-
2025-12-23historical
-
2025-11-28price $135,000
-
2025-04-15$145,000 Active
-
2017-08-29historical Hold Do Not Show
-
2017-06-14status Active
-
2017-06-08historical Active Under Contract
-
2017-05-22price $44,500
-
2017-04-28price $48,400
-
2017-03-20price $49,400
-
2017-03-18price $49,500
-
2017-02-09$49,900 Active
-
2014-11-30historical
-
2014-08-16$38,000 Active
-
2014-06-18historical Hold
-
2014-05-19$38,000 Active
-
2014-05-01historical
-
2014-04-08price $38,500
-
2014-02-22price $39,000
-
2014-01-08$43,500 Active
-
2014-01-05historical
-
2013-11-07price $39,900
-
2013-10-20price $43,900
-
2013-10-02$48,000 Active
ⓘ Source: listings_history table (triggers on properties + properties_extension) + one-shot
backfill from property_details.listing_events for pre-trigger history.
Tax reassessment forecast CA · Resets to sale price
- Current annual tax
- $348 · $29/mo
- Projected year-2 tax
- $912 · $76/mo
- Expected delta
- +$564/yr (+$47/mo · 162.1%)
ⓘ Screening estimate from a state-policy table — verify with the county assessor before closing.
Climate risk First Street
- Flood 8/10 Severe FEMA zone A · 99% chance over 30 yrs
- Wildfire 7/10 Severe
- Heat 9/10 Extreme 7 d/yr ≥103°F today · 19 d/yr by 30 yrs out
- Wind 1/10 Low
- Air quality 5/10 Major 8 unhealthy d/yr today · 10 by 30 yrs out
Nearby sold comps map
Loading sold comps map…
Walkable amenities ~0.75 mi
Loading nearby amenities…
Taxation est. · year 1
- Rental income
- $30,384
- − Mortgage interest
- −$6,722
- − Property taxes
- −$348
- − Insurance
- −$2,102
- − Repairs & maintenance
- −$2,431
- − Management
- −$2,431
- − Depreciation
- −$3,491
- Taxable income
- $12,859
- Est. tax owed @ 24.0%
- −$3,086
- After-tax cash flow
- $10,915/yr
For passive investors: Depreciation is non-cash, so a rental often shows a tax loss while cash-flowing — sheltering income. Rental losses are passive: they offset passive income freely, and up to $25,000/yr can offset ordinary (W-2) income if you actively participate and your MAGI is under $100k (phasing out to $0 by $150k); unused losses carry forward. On sale, claimed depreciation is recaptured at up to 25%, and gains may owe capital-gains tax (a 1031 exchange can defer both). Figures are a year-1 estimate at your 24.0% rate — not tax advice; consult a CPA.
Schools (NCES district)
- District
- Palm Springs Unified
- NCES district ID
- 0629550
- Math proficiency
- 21% ▼ -7.00%
- Reading proficiency
- 42% ▬ 0.00%
- Median HH income
- $43,638
- Composite
- 26.76/100
- National rank
- #7131
- State rank
- #328 of 517 in CA
Livability — Palm Springs
- Score
- 66/100
- State rank
- #348
- US rank
- #11850
Category grades
Schools grade is shown separately in the Schools card above.
Census & demographics
- County
- Riverside County · 2,287,001 people
- City population
- 46,786
- Metro
- Riverside-San Bernardino-Ontario, CA
- Population (ZIP)
- 26,887
- Household income
- $71,672
- Rent vs Own
- Severe rent burden
- 1866.0
Population outlook (Riverside County) Hauer SSP2
- Today (2025)
- 2,664,475 people
- By 2030
- 2,802,692 · +5.2%
- By 2040
- 3,050,904 · +14.5%
- By 2050
- 3,256,783 · +22.2%
- By 2075
- 3,655,058 · +37.2%
- By 2100
- 3,766,594 · +41.4%
Race, ethnicity, and origin ACS 2023
- Neighborhood character
- Diverse neighborhood (Simpson 0.58)
- Race & ethnicity
- White 58% Hispanic / Latino 27% Two or more races 13% Black 9% Asian 3%
- Hispanic origin (detail)
- Mexican 24%
- Common ancestry
- Lithuanian 3% Slovak 3% Italian 2%
- Foreign-born
- 17% · Canada, China
- Languages at home
- 75% English-only · Spanish 19% French/Haitian/Cajun 1% German/W. Germanic 1%
Political lean MEDSL · Riverside
- 2024 margin
- Toss-up / Even · D 48.0% · R 49.3% · Other 2.6%
- 2008→2024 swing
- -3.6pp toward R · 2008: 2.3pp · 2024: -1.3pp
- All cycles
- 2024: R+1.3 2020: D+8.0 2016: D+4.3 2012: R+0.4 2008: D+2.3
Not yet ingested
- Civics
- —
Market trends
- HPI YoY
- ▼ -1082.67%
- Current HPI
- 434.0524
- Rent YoY
- ▲ 0.46%
- Metro
- Riverside-San Bernardino-Ontario, CA
- State GDP YoY
- ▲ 3.21%
- F500 in state
- 116
Industry mix (Fortune 500 HQ in CA)
| Industry | F500 HQs | Revenue |
|---|---|---|
| Technology | 27 | $1,492B |
|
||
| Financial Services | 3 | $174B |
|
||
| Retail | 3 | $44B |
|
||
| Insurance | 3 | $26B |
|
||
| Media / Entertainment | 2 | $115B |
|
||
| Pharmaceuticals / Biotech | 2 | $62B |
|
||
Price history
+150.0% since first listed28 events — show timeline
- 2026-03-03 Listed $120,000 GPSMLS
- 2026-02-13 Listing Removed — CRMLS
- 2026-02-08 Relisted — CRMLS
- 2026-01-26 Pending — CRMLS
- 2026-01-14 Listed $135,000 CRMLS
- 2025-12-23 Listing Removed — CRMLS
- 2025-11-28 Price Changed $135,000 CRMLS
- 2025-04-15 Listed $145,000 CRMLS
- 2017-08-29 Delisted — CRMLS
- 2017-06-14 Relisted — CRMLS
- 2017-06-08 Contingent — CRMLS
- 2017-05-22 Price Changed $44,500 CRMLS
- 2017-04-28 Price Changed $48,400 CRMLS
- 2017-03-20 Price Changed $49,400 CRMLS
- 2017-03-18 Price Changed $49,500 CRMLS
- 2017-02-09 Listed $49,900 CRMLS
- 2014-11-30 Listing Removed — GPSMLS
- 2014-08-16 Listed $38,000 GPSMLS
- 2014-06-18 Delisted — GPSMLS
- 2014-05-19 Listed $38,000 GPSMLS
- 2014-05-01 Listing Removed — GPSMLS
- 2014-04-08 Price Changed $38,500 GPSMLS
- 2014-02-22 Price Changed $39,000 GPSMLS
- 2014-01-08 Listed $43,500 GPSMLS
- 2014-01-05 Listing Removed — GPSMLS
- 2013-11-07 Price Changed $39,900 GPSMLS
- 2013-10-20 Price Changed $43,900 GPSMLS
- 2013-10-02 Listed $48,000 GPSMLS
Property tax history
-0.1%/yrLatest (2025): $348 · -1.6% YoY. Source: county tax records.
Cash-flow waterfall
monthlySold comps — $/sqft
last 12 mo · ≤1 miLoading sold comps…