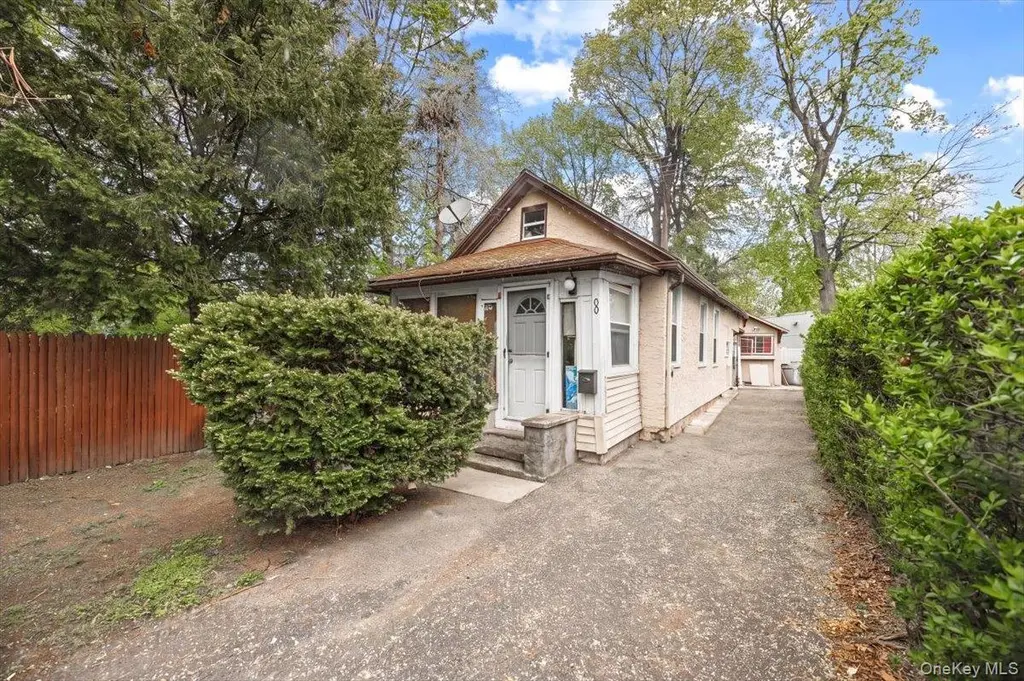
8 Geyser Pl · Fairview, NY
Flood risk 1/10 · Minimal
- FEMA flood zone
- X (unshaded)
- Chance of flooding over 30 yrs
- 0.0%
- Est. flood insurance / yr
- $473 – $860
Fire risk 1/10 · Minimal
- Est. fire insurance / yr
- $691 – $1,283
Heat risk 6/10 · Moderate
- Hot days now (above 98°F)
- 7 days/yr
- Hot days in 30 yrs
- 16 days/yr
Wind risk 6/10 · Moderate
- Chance of severe wind over 30 yrs
- 27.0%
Air-quality risk 4/10 · Minor
- Unhealthy air days now
- 3 days/yr
- Unhealthy air days in 30 yrs
- 5 days/yr
Risk factors via First Street. Map © Google.
Why this score? — see what drove the D grade
The composite is a weighted blend of 9 inputs, each scored 0–100. Each bar is that input's sub-score; the figure is the points it added to the 100-point composite (weight × sub-score).
- ARV discount +15.0/15.0
- Cash flow +8.6/30.0
- Schools +4.9/10.0
- Livability +4.0/5.0
- 1% rule +3.0/10.0
- Rent growth +2.5/5.0
- Condition / age +2.5/5.0
- DSCR +2.4/10.0
- Appreciation +0.0/10.0
$399,000
🖨 Deal sheet (PDF) 📄 Offer letter ✓ Due diligence
Listing remarks
Welcome to an incredible opportunity to own the lowest-priced single-family home currently available in all of White Plains. This 2-bedroom, 1-bath home offers the convenience of single-level living with a first-floor bedroom and full bathroom, making it ideal for homeowners looking for comfort, accessibility, and potential. This home also comes with a full basement, providing additional flexible living space. Conveniently located near downtown White Plains, major highways, shopping, dining, parks, and Metro-North access, the property offers easy access to everything the city has to offer.
Key facts
- Single level living
- Full basement
- First floor bedroom
Tags
Property features AI
Exterior
- Parking: Driveway parking; No carport
- Utilities: Public sewer; Electricity available; Natural gas available
- Home design: Single-family residence
- Construction: Brick construction
- Exterior features: Brick exterior; Not waterfront
Interior
- Kitchen: Convection oven; Gas cooktop
- Bedrooms: Total of 5 rooms (includes bedrooms and living spaces)
- Bathrooms: 1 full bathroom
- Heating & cooling: Oil heating; Wall/window AC units
- Interior features: First-floor bedroom; Full basement with storage in the attic
- Laundry & utility: Basement utility access
Neighborhood map
What this means for you Summary
Snapshot
- This is a 2-bed/1.0-bath single-family listed at $399k.
Deal economics
- At list price, monthly cash flow is $-344 ($-4k/yr) — negative.
- To cash-flow at today's rent, offer at most $338k (15.2% below list).
- To meet the 1% rule (rent ≥ 1% of price), the offer needs to be $320k (19.8% below list).
- Recommended offer: $320k (19.8% below list) — sets the bar for 1% rule.
- Cap rate 5.3% vs local median 3.8% in Fairview — top-decile yield for the area; either an underpriced asset or a hidden risk that comps aren't pricing in. Stress-test before assuming the spread holds.
Location & tenants
- Location reads 79/100 on livability (#149 in NY, #2,302 nationally) — a middle-class / working-renter tenant base. Strengths: commute A+, employment A+, housing A+; Watch: cost of living C-, amenities F.
- Greenburgh Central School District (suburban): math 51% / reading 55% proficiency, ranked #267 of 590 in NY (top 45%) — acceptable for families but not a draw, mixed tenant base, ~2y average lease.
- Zoned schools: Lee F Jackson School (261 students, 41% FRL); Richard J Bailey School (math 45% / reading 53%, grade C-, #294 of 729 statewide, top 41%, 336 students, 0% FRL); Woodlands Middle/High School (math 62% / reading 52%, grade C, #887 of 1,100 statewide, top 82%, 681 students, 66% FRL).
- Market conditions: 40 active listings in the ZIP; 10 comparable units currently listed for rent nearby; rentals at typical pace (median 27d on market — plan ~3-4 weeks tenant-placement turnaround); 40% of comp listings sitting > 30 days — soft ceiling on asking rent; 954 units permitted in Westchester County in 2024 (649 in 5+ unit buildings).
Forward outlook
- Local home prices are declining (-3.0%/yr); year-one equity from $3k of loan paydown is wiped out by about $12k of value loss. Plan a longer hold.
- Westchester County population projected at +10% by 2050 — modest demand growth; plan on rents tracking national, not racing it.
Negotiation context
- It's been on market 22 days — a 2% lower offer ($393k) is reasonable based on typical stale-listing flexibility.
Risks & watch-outs
- Watch-outs: built in 1928 — expect roof / HVAC / electrical / plumbing capex.
- Climate carrying-cost: major wind risk, 27% chance of damaging wind over 30y; extreme-heat days projected 7→16/yr by 2055 (HVAC capex compounding) — expect insurance premiums to compound above CPI over the hold.
Questions for the listing agent
- What do current leases actually rent for vs. the listed asking? Can we see a recent rent roll and the last 12 months of T-12 income?
- Built in 1928 — when were the roof, HVAC, electrical panel, plumbing, and water heater last replaced?
- Is there a deadline driving the sale (1031 exchange, divorce, estate, relocation)? That informs how much negotiation room exists.
- Schools are F-rated, which usually means shorter tenancies and higher turnover. Who's the typical renter profile here, and what's been the actual vacancy rate?
- The area grade is low — what's the realistic commute time and amenity access for the typical tenant pool here? Any planned neighborhood developments (good or bad) we should know about?
- What's the average days-on-market for RENTAL listings here right now (not sales)? A rising rental-DOM trend means longer vacancies and softer asking-rent achievability than the comps imply.
- What's the recent tenant-quality profile in this submarket — average credit score on applications, eviction rate, late-payment / NSF rate, and stable-employment percentage? A property-management company in the area should have these aggregated.
- How much new for-sale + rental construction is in the pipeline within 1–3 miles? Heavy new supply typically softens prices + rents 12–24 months out; constrained supply supports both.
Investment metrics
- 1% rule
- 0.80% ✗
- Cap rate
- 5.26%
- Cash-on-cash
- -3.70%
- DSCR
- 0.84
- GRM
- 10.4
CMA / ARV
- ARV (median comp)
- $651,903
- List price
- $399,000
- Delta
- -38.79%
- Verdict
- UNDERPRICED
- Comps
- 7 within 1.0 mi
Projected returns pro-forma
-3.0% appreciation · 3.0% rent growth · sell at horizon
- IRR
- -22.5%
- Equity multiple
- 0.23×
- Total profit
- $-86,470
- Equity at exit
- $59,492
- IRR
- -16.6%
- Equity multiple
- 0.08×
- Total profit
- $-103,060
- Equity at exit
- $34,498
Cash invested: $111,720 (down + closing). Projections, not guarantees.
Landlord ↔ Tenant lean methodology
- Overall (STATE)
- 15 Strongly Tenant-Friendly
- State New York
- 15 Strongly Tenant-Friendly · D+10
- County
- — inherits STATE
- City
- — inherits STATE
ZIP-level market 10607
- Active inventory
- 40
- Price-to-rent
- 10.4×
Monthly cashflow live
- Estimated rent
- $3,198 high interval (Pro) →
- Mortgage (P&I)
- −$2,092
- Tax from tax record
- −$612 /mo · $7,348/yr
- Insurance
- −$166
- HOA
- −$0
- Vacancy / Maint / Mgmt
- −$672
- Net cashflow
- $-344
Break-even live
Sensitivity live
| Price | -10% $-119 | -5% $-231 | +0% $-344 | +5% $-457 | +10% $-570 |
|---|---|---|---|---|---|
| Rent | -10% $-597 | -5% $-471 | +0% $-344 | +5% $-218 | +10% $-92 |
| Rate | -1.0pp $-143 | -0.5pp $-243 | base $-344 | +0.5pp $-448 | +1.0pp $-553 |
UW: 25.0% down · 7.5% · 30yr · 1.5% tax · 5.0% vac · 8.0% maint · 8.0% mgmt
Financing live
Cash to close
- Down payment
- $99,750
- Closing costs
- $11,970
- Reserves months
- —
- Total cash needed
- —
Loan-product check · same deal, 3 products live
Conventional
25% down · 7.5% · 30yr
- Down + closing
- —
- Monthly P&I
- —
- Monthly cashflow
- —
- DSCR
- —
- Eligible?
- —
Personal DTI + credit; lowest rate.
DSCR
20% down · 8.5% · 30yr
- Down + closing
- —
- Monthly P&I
- —
- Monthly cashflow
- —
- DSCR
- —
- Eligible?
- —
No personal income docs; deal must DSCR.
Hard money
10% down · 12.0% · 12mo
- Down + closing
- —
- Monthly P&I
- —
- Monthly cashflow
- —
- DSCR
- —
- Eligible?
- —
Short-term bridge; refi at stabilization.
Rent comps 10 comps
| Address | Beds | Baths | Sqft | Rent | $/sqft | DOM | Units | Dist |
|---|---|---|---|---|---|---|---|---|
| 290 E Main St Elmsford, NY | 1.0–2.0 | 1.0–2.0 | 1077 | $4,107 | $3.81 | 1d | 7 | 0.42mi |
| 13 Granada Cres #1 White Plains, NY | 2.0 | 2.0 | 1100 | $3,500 | $3.18 | 26d | 1 | 0.70mi |
| 400 High Point Dr Unit 206 Hartsdale, NY | 1.0 | 1.0 | 987 | $3,300 | $3.34 | 45d | 1 | 1.01mi |
| 35 S Lawn Ave Unit 3 Elmsford, NY | 2.0 | 1.0 | 815 | $2,650 | $3.25 | 20d | 1 | 1.10mi |
| 58 S Stone Ave Elmsford, NY | 2.0 | 1.0 | 900 | $2,950 | $3.28 | 26d | 1 | 1.13mi |
| 55 Fieldstone Dr Unit 69 Hartsdale, NY | 1.0 | 1.0 | 800 | $2,100 | $2.62 | 13d | 1 | 1.14mi |
| 4 Wyndover Woods Ln Unit 12 White Plains, NY | 2.0 | 1.0 | 925 | $2,500 | $2.70 | 45d | 1 | 1.27mi |
| 55 McKinley Ave Unit D2-3 White Plains, NY | 1.0 | 1.0 | 809 | $2,400 | $2.97 | 45d | 1 | 1.36mi |
| 32 Nob Hill Dr Elmsford, NY | 1.0–3.0 | 1.0–2.0 | 978 | $3,610 | $3.69 | 0d | 15 | 1.36mi |
| 26 Fairview Ave White Plains, NY | 3.0 | 1.5 | 1100 | $3,600 | $3.27 | 45d | 1 | 1.48mi |
Listing history 6 events
-
2026-06-04days on market $399,000 Active 22 DOM
-
2026-06-03days on market $399,000 Active 21 DOM
-
2026-06-02days on market $399,000 Active 20 DOM
-
2026-06-01days on market $399,000 Active 19 DOM
-
2026-05-31days on market $399,000 Active 18 DOM
-
2026-04-23$399,000 Active 596-char remark
ⓘ Source: listings_history table (triggers on properties + properties_extension) + one-shot
backfill from property_details.listing_events for pre-trigger history.
Tax reassessment forecast NY · Partial reset (capped growth)
- Current annual tax
- $7,348 · $612/mo
- Projected year-2 tax
- $7,348 · $612/mo
- Expected delta
- $0/yr ($0/mo · 0.0%)
ⓘ Screening estimate from a state-policy table — verify with the county assessor before closing.
Climate risk First Street
- Flood 1/10 Low FEMA zone X (unshaded) · 0% chance over 30 yrs
- Wildfire 1/10 Low
- Heat 6/10 Major 7 d/yr ≥98°F today · 16 d/yr by 30 yrs out
- Wind 6/10 Major 27% chance of damaging wind over 30 yrs
- Air quality 4/10 Moderate 3 unhealthy d/yr today · 5 by 30 yrs out
Nearby sold comps map
Loading sold comps map…
Walkable amenities ~0.75 mi
Loading nearby amenities…
Taxation est. · year 1
- Rental income
- $38,379
- − Mortgage interest
- −$22,350
- − Property taxes
- −$7,348
- − Insurance
- −$1,995
- − Repairs & maintenance
- −$3,070
- − Management
- −$3,070
- − Depreciation
- −$11,607
- Taxable loss
- −$11,062
- Est. tax savings @ 24.0%
- +$2,655
- After-tax cash flow
- $-1,478/yr
For passive investors: Depreciation is non-cash, so a rental often shows a tax loss while cash-flowing — sheltering income. Rental losses are passive: they offset passive income freely, and up to $25,000/yr can offset ordinary (W-2) income if you actively participate and your MAGI is under $100k (phasing out to $0 by $150k); unused losses carry forward. On sale, claimed depreciation is recaptured at up to 25%, and gains may owe capital-gains tax (a 1031 exchange can defer both). Figures are a year-1 estimate at your 24.0% rate — not tax advice; consult a CPA.
Schools (NCES district)
- District
- Greenburgh Central School District
- NCES district ID
- 3612720
- Math proficiency
- 51% ▲ 4.00%
- Reading proficiency
- 55% ▲ 5.00%
- Median HH income
- $93,626
- Composite
- 49.43/100
- National rank
- #2005
- State rank
- #267 of 590 in NY
Livability — Fairview
- Score
- 79/100
- State rank
- #149
- US rank
- #2302
Category grades
Schools grade is shown separately in the Schools card above.
Census & demographics
- Census place
- Fairview, NY
- Population (ZIP)
- 6,222
Population outlook (Westchester County) Hauer SSP2
- Today (2025)
- 1,028,035 people
- By 2030
- 1,051,636 · +2.3%
- By 2040
- 1,098,520 · +6.9%
- By 2050
- 1,136,044 · +10.5%
- By 2075
- 1,196,925 · +16.4%
- By 2100
- 1,175,147 · +14.3%
Race, ethnicity, and origin ACS 2023
- Neighborhood character
- Highly diverse neighborhood (Simpson 0.74)
- Race & ethnicity
- Black 30% White 29% Hispanic / Latino 27% Asian 12% Two or more races 7%
- Hispanic origin (detail)
- Mexican 4% Puerto Rican 8% Dominican 2%
- Common ancestry
- Romanian 3% Scotch-Irish 3% Hispanic 2%
- Foreign-born
- 30% · Canada, South Korea, Jamaica
- Languages at home
- 60% English-only · Spanish 23% Other Indo-European 6% Korean 3%
Political lean MEDSL · Westchester
- 2024 margin
- Strong D (+26.3) · D 63.1% · R 36.9%
- 2008→2024 swing
- -1.3pp toward R · 2008: 27.6pp · 2024: 26.3pp
- All cycles
- 2024: D+26.3 2020: D+36.3 2016: D+32.8 2012: D+22.2 2008: D+27.6
Not yet ingested
- Civics
- —
Market trends
- HPI YoY
- ▼ -357.34%
- Current HPI
- 344.8189
- Rent YoY
- —
- Metro
- —
- State GDP YoY
- ▲ 2.60%
- F500 in state
- 92
Industry mix (Fortune 500 HQ in NY)
| Industry | F500 HQs | Revenue |
|---|---|---|
| Financial Services | 10 | $950B |
|
||
| Consumer Goods | 9 | $162B |
|
||
| Insurance | 4 | $225B |
|
||
| Telecommunications | 2 | $144B |
|
||
| Pharmaceuticals | 2 | $112B |
|
||
| Media / Entertainment | 2 | $69B |
|
||
Price history
1 event — show timeline
- 2026-04-23 Listed $399,000 OneKey® MLS as Distributed by MLS Grid
Property tax history
+7.9%/yrLatest (2025): $7,348 · +45.4% YoY. Source: county tax records.
Cash-flow waterfall
monthlySold comps — $/sqft
last 12 mo · ≤1 miLoading sold comps…