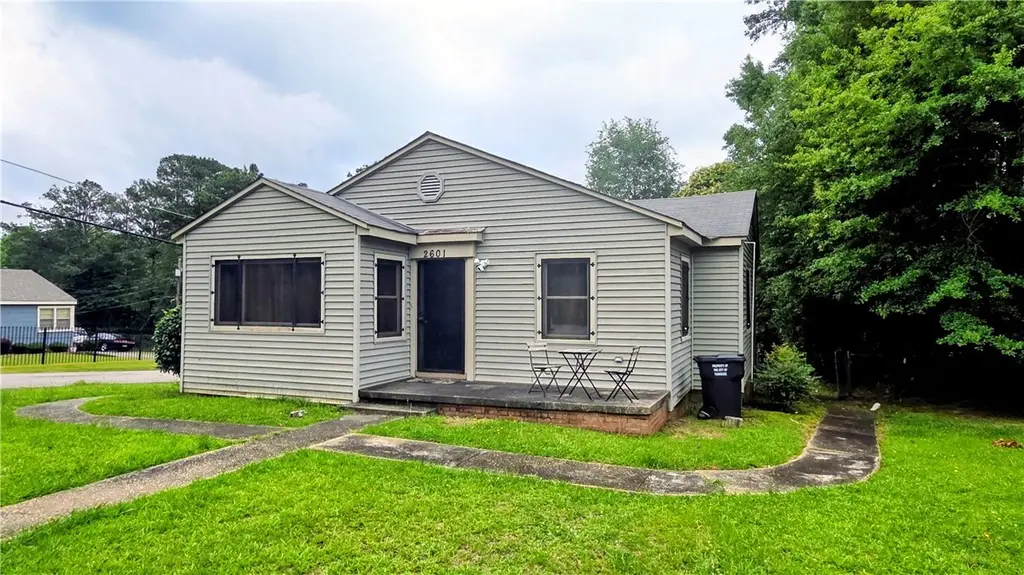
2601 Althea St · Tuskegee, AL
Flood risk 1/10 · Minimal
- FEMA flood zone
- X (unshaded)
- Chance of flooding over 30 yrs
- 0.0%
- Est. flood insurance / yr
- $507 – $1,088
Fire risk 5/10 · Moderate
- Est. fire insurance / yr
- $916 – $1,700
Heat risk 7/10 · Major
- Hot days now (above 106°F)
- 7 days/yr
- Hot days in 30 yrs
- 19 days/yr
Wind risk 6/10 · Moderate
- Chance of severe wind over 30 yrs
- 73.0%
Air-quality risk 2/10 · Minimal
- Unhealthy air days now
- 1 days/yr
- Unhealthy air days in 30 yrs
- 1 days/yr
Risk factors via First Street. Map © Google.
Why this score? — see what drove the D+ grade
The composite is a weighted blend of 9 inputs, each scored 0–100. Each bar is that input's sub-score; the figure is the points it added to the 100-point composite (weight × sub-score).
- Cash flow +22.2/30.0
- DSCR +7.1/10.0
- Appreciation +5.1/10.0
- 1% rule +4.7/10.0
- Livability +2.9/5.0
- Rent growth +2.5/5.0
- Condition / age +2.5/5.0
- Schools +0.7/10.0
- ARV discount +0.0/15.0
$120,000
🖨 Deal sheet 📄 Offer letter ✓ Due diligence
Listing remarks
Welcome to 2601 Althea Street, an investment opportunity that actually makes sense. Located minutes from Tuskegee University, this updated 3-bedroom, 1-bath home sits in one of the strongest rental markets in Macon County. Tuskegee University continues to drive housing demand year after year, making this an excellent opportunity for investors, parents of students, or anyone looking for reliable rental income. The property has a proven rental history, generating $650 per bedroom, or approximately $1,950 per month in gross rental income. That's actual rental history, not wishful thinking and creative spreadsheet math. Major updates have already been completed, including a newer HVAC system, a
Key facts
- New sump pump
- Updated kitchen
- Conveniently located
Tags
Property features AI
Finance
- HOA & community: No association amenities
Exterior
- Utilities: Natural gas available; Public water available
- Home design: Residential property; Single-story
- Construction: Vinyl siding
- Exterior features: Front porch; Chain link fencing
Interior
- Kitchen: Gas cooktop; Microwave
- Bedrooms: Total of 7 rooms (bedroom count not specified)
- Flooring: Ceramic tile; Wood
- Bathrooms: 1 full bathroom (main level)
- Heating & cooling: Heat pump heating; Ceiling fan and heat pump cooling
- Interior features: Ceiling fans
- Laundry & utility: Washer hookup; Crawl space basement
Neighborhood map
What this means for you Summary
Snapshot
- This is a 3-bed/1.0-bath single-family listed at $120k.
Deal economics
- At list price, monthly cash flow is $195 ($2k/yr) — positive.
- The deal already cash-flows at list — no discount required.
- To meet the 1% rule (rent ≥ 1% of price), the offer needs to be $117k (2.6% below list).
- Recommended offer: $117k (2.6% below list) — sets the bar for 1% rule.
Location & tenants
- Location reads 57/100 on livability (#375 in AL) — a working-class tenant base; expect higher turnover. Strengths: cost of living A+, housing A; Watch: crime F, amenities F, commute F.
- Macon County (town): math 2% / reading 17% proficiency, ranked #123 of 129 in AL (top 95%) — low school quality limits family demand, transient renter base, plan for 1-2y turnover; 97% free/reduced lunch — lower-income household profile, screen leases tightly.
- Zoned schools: Tuskegee Public Elementary (math 2% / reading 12%, grade F, #245 of 257 statewide, top 96%, 265 students, 98% FRL) — zoned schools at 98% FRL track the district average.
- Market conditions: 10 active listings in the ZIP; 5 units permitted in Macon County in 2024 (0 in 5+ unit buildings).
Forward outlook
- In year one you build about $1k of equity ($830 loan paydown + $186 appreciation (0.1% local appreciation)).
- Macon County population projected at -42% by 2050 — secular population decline; favor cash flow + early exit over multi-decade hold.
- At projected returns (0.1% appreciation + 3.0% rent growth), your $34k cash investment doubles in ~8 years — after that, you're playing with house money.
Negotiation context
- Only 12 days on market — expect competitive offers; lowballing is unlikely to land.
- 2 sale attempts since 19y ago with the ask held roughly flat each time — persistent listings suggest the price (not the market) is what's stuck; bring a comps-based counter.
Risks & watch-outs
- Watch-outs: built in 1944 — expect roof / HVAC / electrical / plumbing capex.
- Climate carrying-cost: major wind risk, 73% chance of damaging wind over 30y; moderate wildfire risk; extreme-heat days projected 7→19/yr by 2055 (HVAC capex compounding) — expect insurance premiums to compound above CPI over the hold.
Questions for the listing agent
- Built in 1944 — when were the roof, HVAC, electrical panel, plumbing, and water heater last replaced?
- Is there a deadline driving the sale (1031 exchange, divorce, estate, relocation)? That informs how much negotiation room exists.
- Schools are F-rated, which usually means shorter tenancies and higher turnover. Who's the typical renter profile here, and what's been the actual vacancy rate?
- Crime grade is F in this area — have there been break-ins, vandalism, or insurance claims at this property in the last 3 years? What carrier currently insures it and at what premium?
- The area grade is low — what's the realistic commute time and amenity access for the typical tenant pool here? Any planned neighborhood developments (good or bad) we should know about?
- What's the average days-on-market for RENTAL listings here right now (not sales)? A rising rental-DOM trend means longer vacancies and softer asking-rent achievability than the comps imply.
- What's the recent tenant-quality profile in this submarket — average credit score on applications, eviction rate, late-payment / NSF rate, and stable-employment percentage? A property-management company in the area should have these aggregated.
- How much new for-sale + rental construction is in the pipeline within 1–3 miles? Heavy new supply typically softens prices + rents 12–24 months out; constrained supply supports both.
Investment metrics
- 1% rule
- 0.97% ✗
- Cap rate
- 8.24%
- Cash-on-cash
- 6.96%
- DSCR
- 1.31
- GRM
- 8.6
CMA / ARV
- ARV (on-the-fly)
- $81,906
- Comps found
- 3
Show comp detail 3 sales within ~0.75 mi
| Address | Dist | Beds/Ba | Sqft | Sold | Price | $/sf | Match |
|---|---|---|---|---|---|---|---|
| 2813 Azalea Ave | 0.40mi | 3/1.5 | 986 (-12%) | 1mo | $150,000 | $152 | 58 |
| 2806 Wake Forest Dr | 0.24mi | 3/2.0 | 1,242 (+11%) | 23mo | $16,500 | $13 | 48 |
| 1003 Fielder St | 0.50mi | 2/2.0 (-1) | 1,275 (+14%) | 19mo | $93,402 | $73 | 29 |
Match score weights: distance 35% · size 25% · config 20% · recency 20%. Top-matched comps best support the ARV.
Projected returns pro-forma
0.15% appreciation · 3.0% rent growth · sell at horizon
- IRR
- 6.0%
- Equity multiple
- 1.29×
- Total profit
- $9,730
- Equity at exit
- $35,777
- IRR
- 11.0%
- Equity multiple
- 2.22×
- Total profit
- $41,010
- Equity at exit
- $43,756
Cash invested: $33,600 (down + closing). Projections, not guarantees.
Landlord ↔ Tenant lean methodology
- Overall (STATE)
- 90 Strongly Landlord-Friendly
- State Alabama
- 90 Strongly Landlord-Friendly · R+15
- County
- — inherits STATE
- City
- — inherits STATE
ZIP-level market 36088
- Home prices YoY
- 0.1%
- Active inventory
- 10
- Price-to-rent
- 8.6×
Monthly cashflow live
- Estimated rent
- $1,168 medium interval (Pro) →
- Mortgage (P&I)
- −$629
- Tax from tax record
- −$49 /mo · $586/yr
- Insurance
- −$50
- HOA
- −$0
- Vacancy / Maint / Mgmt
- −$245
- Net cashflow
- $195
Break-even live
UW: 25.0% down · 7.5% · 30yr · 1.5% tax · 5.0% vac · 8.0% maint · 8.0% mgmt
Financing live
Cash to close
- Down payment
- $30,000
- Closing costs
- $3,600
- Reserves months
- —
- Total cash needed
- —
Loan-product check · same deal, 3 products live
Conventional
25% down · 7.5% · 30yr
- Down + closing
- —
- Monthly P&I
- —
- Monthly cashflow
- —
- DSCR
- —
- Eligible?
- —
Personal DTI + credit; lowest rate.
DSCR
20% down · 8.5% · 30yr
- Down + closing
- —
- Monthly P&I
- —
- Monthly cashflow
- —
- DSCR
- —
- Eligible?
- —
No personal income docs; deal must DSCR.
Hard money
10% down · 12.0% · 12mo
- Down + closing
- —
- Monthly P&I
- —
- Monthly cashflow
- —
- DSCR
- —
- Eligible?
- —
Short-term bridge; refi at stabilization.
Listing history 11 events
-
2026-06-19days on market $120,000 Active 12 DOM
-
2026-06-18days on market $120,000 Active 11 DOM
-
2026-06-17days on market $120,000 Active 10 DOM
-
2026-06-16days on market $120,000 Active 9 DOM
-
2026-06-15days on market $120,000 Active 8 DOM
-
2026-06-14days on market $120,000 Active 6 DOM
-
2026-06-13days on market $120,000 Active 5 DOM
-
2026-06-10days on market $120,000 Active 3 DOM
-
2026-06-09days on market $120,000 Active 2 DOM
-
2026-06-08remarks 699-char remark
-
2026-06-08$120,000 Active 1 DOM
ⓘ Source: listings_history table (triggers on properties + properties_extension) + one-shot
backfill from property_details.listing_events for pre-trigger history.
Tax reassessment forecast AL · Resets to sale price
- Current annual tax
- $586 · $49/mo
- Projected year-2 tax
- $586 · $49/mo
- Expected delta
- $0/yr ($0/mo · 0.0%)
ⓘ Screening estimate from a state-policy table — verify with the county assessor before closing.
Climate risk First Street
- Flood 1/10 Low FEMA zone X (unshaded) · 0% chance over 30 yrs
- Wildfire 5/10 Major
- Heat 7/10 Severe 7 d/yr ≥106°F today · 19 d/yr by 30 yrs out
- Wind 6/10 Major 73% chance of damaging wind over 30 yrs
- Air quality 2/10 Low 1 unhealthy d/yr today · 1 by 30 yrs out
Nearby sold comps map
Loading sold comps map…
Walkable amenities ~0.75 mi
Loading nearby amenities…
Taxation est. · year 1
- Rental income
- $14,019
- − Mortgage interest
- −$6,722
- − Property taxes
- −$586
- − Insurance
- −$600
- − Repairs & maintenance
- −$1,122
- − Management
- −$1,122
- − Depreciation
- −$3,491
- Taxable income
- $378
- Est. tax owed @ 24.0%
- −$91
- After-tax cash flow
- $2,247/yr
For passive investors: Depreciation is non-cash, so a rental often shows a tax loss while cash-flowing — sheltering income. Rental losses are passive: they offset passive income freely, and up to $25,000/yr can offset ordinary (W-2) income if you actively participate and your MAGI is under $100k (phasing out to $0 by $150k); unused losses carry forward. On sale, claimed depreciation is recaptured at up to 25%, and gains may owe capital-gains tax (a 1031 exchange can defer both). Figures are a year-1 estimate at your 24.0% rate — not tax advice; consult a CPA.
Schools (NCES district)
- District
- Macon County
- NCES district ID
- 0102190
- Math proficiency
- 2% ▼ -18.00%
- Reading proficiency
- 17% ▼ -8.00%
- Median HH income
- $30,012
- Composite
- 7.24/100
- National rank
- #9958
- State rank
- #123 of 129 in AL
Livability — Tuskegee
- Score
- 57/100
- State rank
- #375
- US rank
- #21590
Category grades
Schools grade is shown separately in the Schools card above.
Census & demographics
- Census place
- Tuskegee, AL
- City population
- 3,493
- Population (ZIP)
- 3,493
Population outlook (Macon County) Hauer SSP2
- Today (2025)
- 15,805 people
- By 2030
- 14,101 · -10.8%
- By 2040
- 11,244 · -28.9%
- By 2050
- 9,088 · -42.5%
- By 2075
- 6,606 · -58.2%
- By 2100
- 6,309 · -60.1%
Race, ethnicity, and origin ACS 2023
- Neighborhood character
- Predominantly Black (83%)
- Race & ethnicity
- Black 83% White 10% Two or more races 3% Hispanic / Latino 2% Asian 1%
- Foreign-born
- 2% · Canada
- Languages at home
- 98% English-only · Other Indo-European 1% Spanish 1%
Political lean MEDSL · Macon
- 2024 margin
- Solid D (+56.3) · D 77.8% · R 21.5%
- 2008→2024 swing
- -17.8pp toward R · 2008: 74.0pp · 2024: 56.3pp
- All cycles
- 2024: D+56.3 2020: D+63.8 2016: D+66.8 2012: D+74.4 2008: D+74.0
Not yet ingested
- Civics
- —
Market trends
- HPI YoY
- ▲ 0.15%
- Current HPI
- 149.1572
- Rent YoY
- —
- Metro
- —
- State GDP YoY
- ▲ 2.94%
- F500 in state
- 4
Industry mix (Fortune 500 HQ in AL)
| Industry | F500 HQs | Revenue |
|---|---|---|
| Financial Services | 1 | $8B |
|
||
| Healthcare | 1 | $5B |
|
||
Price history
+503.0% since first listed2 events — show timeline
- 2026-06-07 Listed $120,000 LCMLS
- 2007-12-28 Listed $19,900 MAAR
Property tax history
+9.3%/yrLatest (2025): $586 · +3.2% YoY. Source: county tax records.
Cash-flow waterfall
monthlySold comps — $/sqft
last 12 mo · ≤1 miLoading sold comps…