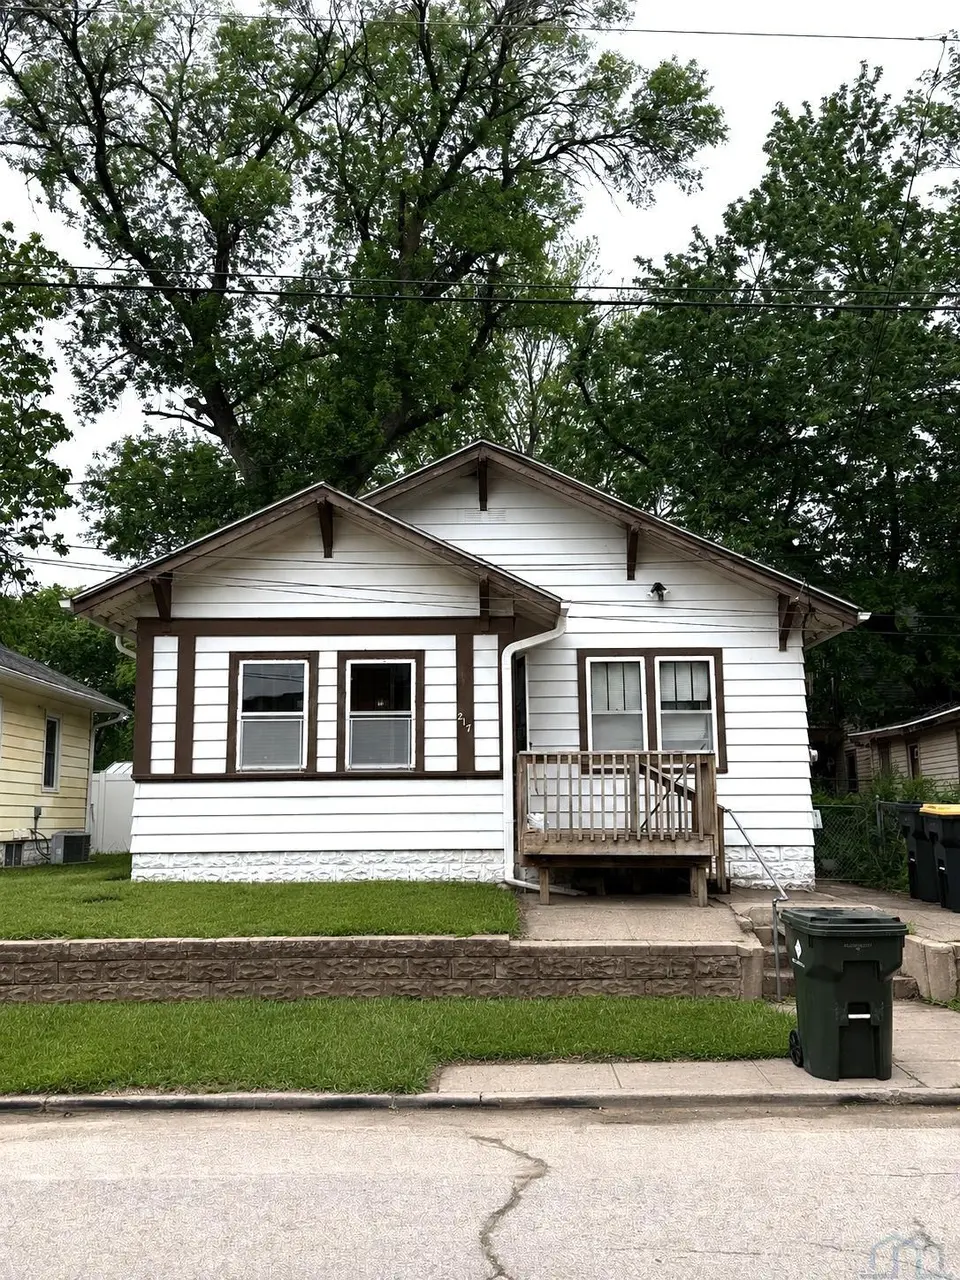
217 Rebecca St · Sioux City, IA
Flood risk 1/10 · Minimal
- FEMA flood zone
- X (unshaded)
- Chance of flooding over 30 yrs
- 0.0%
- Est. flood insurance / yr
- $473 – $860
Fire risk 3/10 · Minor
- Est. fire insurance / yr
- $902 – $1,676
Heat risk 3/10 · Minor
- Hot days now (above 103°F)
- 7 days/yr
- Hot days in 30 yrs
- 15 days/yr
Wind risk 2/10 · Minimal
- Chance of severe wind over 30 yrs
- —
Air-quality risk 1/10 · Minimal
- Unhealthy air days now
- 0 days/yr
- Unhealthy air days in 30 yrs
- 0 days/yr
Risk factors via First Street. Map © Google.
Why this score? — see what drove the D+ grade
The composite is a weighted blend of 9 inputs, each scored 0–100. Each bar is that input's sub-score; the figure is the points it added to the 100-point composite (weight × sub-score).
- Cash flow +15.9/30.0
- ARV discount +7.5/15.0
- DSCR +4.9/10.0
- Schools +4.7/10.0
- Livability +3.9/5.0
- 1% rule +3.6/10.0
- Rent growth +2.5/5.0
- Condition / age +2.5/5.0
- Appreciation +0.0/10.0
$150,000
🖨 Deal sheet (PDF) 📄 Offer letter ✓ Due diligence
Listing remarks
Perfect opportunity for first time home buyers or investors! This cozy 2 bedroom, 2 bathroom home offers comfortable living with a welcoming front porch and low maintenance small lot, making yard work simple and easy. The basement features a newer stand up shower bathroom and an additional non conforming room that could add even more value with the future addition of an egress window. A storage shed in the backyard provides extra space for tools, lawn equipment, or seasonal storage. Affordable, practical, and full of potential, this home is a great opportunity to make it your own or add to your investment portfolio!
Key facts
- Front porch
- Storage shed
- Non conforming room
Tags
Property features AI
Finance
- Other: Annual tax listed (for reference)
Exterior
- Parking: No designated parking
- Utilities: Public water; Public sewer
- Home design: Single-family residence (residential property)
- Construction: Aluminum siding; 185 sq ft of below-grade finished area
- Exterior features: Shingle roof; Lot about 0.04 acres
Interior
- Bathrooms: One full bathroom; One three-quarter bathroom
- Heating & cooling: Central air conditioning; Natural gas forced air heating
- Interior features: Partially finished basement
Neighborhood map
What this means for you Summary
Snapshot
- This is a 2-bed/1.0-bath single-family listed at $150k.
Deal economics
- At list price, monthly cash flow is $72 ($859/yr) — positive.
- The deal already cash-flows at list — no discount required.
- To meet the 1% rule (rent ≥ 1% of price), the offer needs to be $128k (14.4% below list).
- Recommended offer: $128k (14.4% below list) — sets the bar for 1% rule.
- Cap rate 6.9% vs local median 3.7% in Sioux City — top-decile yield for the area; either an underpriced asset or a hidden risk that comps aren't pricing in. Stress-test before assuming the spread holds.
Location & tenants
- Location reads 78/100 on livability (#138 in IA, #2,544 nationally) — a middle-class / working-renter tenant base. Strengths: cost of living A+, housing A+, health & safety A+; Watch: crime F, commute F.
- Sioux City Community School District (urban): math 54% / reading 57% proficiency, ranked #264 of 289 in IA (top 91%) — acceptable for families but not a draw, mixed tenant base, ~2y average lease.
- Zoned schools: Loess Hills Elementary (math 64% / reading 54%, grade B-, #428 of 616 statewide, top 70%, 589 students, 60% FRL); West Middle School (math 54% / reading 54%, grade B-, #206 of 246 statewide, top 84%, 864 students, 48% FRL); West High School (math 44% / reading 58%, grade D+, #308 of 336 statewide, top 92%, 1,252 students, 76% FRL).
- Market conditions: 79 active listings in the ZIP; 9 comparable units currently listed for rent nearby; rentals lingering (median 45d on market — plan ~5-8 weeks vacancy on turnover, expect pricing pressure); 100% of comp listings sitting > 30 days — soft ceiling on asking rent; 170 units permitted in Woodbury County in 2024 (90 in 5+ unit buildings).
Forward outlook
- Local home prices are declining (-3.0%/yr); year-one equity from $1k of loan paydown is wiped out by about $4k of value loss. Plan a longer hold.
Negotiation context
- It's been on market 31 days — a 3% lower offer ($146k) is reasonable based on typical stale-listing flexibility.
Risks & watch-outs
- Watch-outs: built in 1911 — expect roof / HVAC / electrical / plumbing capex.
Questions for the listing agent
- It's been on market 31 days. Have you received any prior offers? Is the seller open to a 14% concession, seller financing, or rate buy-down credit?
- Built in 1911 — when were the roof, HVAC, electrical panel, plumbing, and water heater last replaced?
- Is there a deadline driving the sale (1031 exchange, divorce, estate, relocation)? That informs how much negotiation room exists.
- Crime grade is F in this area — have there been break-ins, vandalism, or insurance claims at this property in the last 3 years? What carrier currently insures it and at what premium?
- The area grade is low — what's the realistic commute time and amenity access for the typical tenant pool here? Any planned neighborhood developments (good or bad) we should know about?
- What's the average days-on-market for RENTAL listings here right now (not sales)? A rising rental-DOM trend means longer vacancies and softer asking-rent achievability than the comps imply.
- What's the recent tenant-quality profile in this submarket — average credit score on applications, eviction rate, late-payment / NSF rate, and stable-employment percentage? A property-management company in the area should have these aggregated.
- How much new for-sale + rental construction is in the pipeline within 1–3 miles? Heavy new supply typically softens prices + rents 12–24 months out; constrained supply supports both.
Investment metrics
- 1% rule
- 0.86% ✗
- Cap rate
- 6.87%
- Cash-on-cash
- 2.04%
- DSCR
- 1.09
- GRM
- 9.7
CMA / ARV
- ARV (on-the-fly)
- $98,901
- Comps found
- 12
Show comp detail 12 sales within ~0.75 mi
| Address | Dist | Beds/Ba | Sqft | Sold | Price | $/sf | Match |
|---|---|---|---|---|---|---|---|
| 310 & 312 Helmer St | 0.35mi | 3/1.0 (+1) | 948 (+6%) | 4mo | $78,000 | $82 | 64 |
| 1630 W Palmer Ave | 0.25mi | 2/1.0 | 960 (+8%) | 17mo | $142,000 | $148 | 62 |
| 307 S Collins St | 0.66mi | 2/1.0 | 870 (-2%) | 5mo | $159,000 | $183 | 61 |
| 1215 W 16th St | 0.59mi | 2/1.0 | 816 (-8%) | 3mo | $90,000 | $110 | 56 |
| 118 S Center St | 0.31mi | 2/1.0 | 996 (+12%) | 12mo | $85,000 | $85 | 56 |
| 301 S John St | 0.60mi | 2/2.0 | 914 (+3%) | 17mo | $155,000 | $170 | 50 |
| 204 S John St | 0.54mi | 2/1.0 | 768 (-14%) | 3mo | $80,000 | $104 | 49 |
| 1702 Center St | 0.70mi | 2/1.0 | 820 (-8%) | 10mo | $89,950 | $110 | 46 |
| 1623 West St | 0.68mi | 2/1.0 | 945 (+6%) | 17mo | $105,000 | $111 | 44 |
| 2321 W 2nd St | 0.72mi | 2/1.0 | 816 (-8%) | 17mo | $152,000 | $186 | 38 |
| 319 S Judd St | 0.74mi | 3/1.0 (+1) | 842 (-6%) | 17mo | $144,200 | $171 | 37 |
| 111 S Dorman St | 0.72mi | 2/1.0 | 764 (-14%) | 11mo | $58,000 | $76 | 33 |
Match score weights: distance 35% · size 25% · config 20% · recency 20%. Top-matched comps best support the ARV.
Projected returns pro-forma
-3.0% appreciation · 3.0% rent growth · sell at horizon
- IRR
- -13.1%
- Equity multiple
- 0.53×
- Total profit
- $-19,788
- Equity at exit
- $22,365
- IRR
- -4.2%
- Equity multiple
- 0.73×
- Total profit
- $-11,518
- Equity at exit
- $12,969
Cash invested: $42,000 (down + closing). Projections, not guarantees.
Landlord ↔ Tenant lean methodology
- Overall (STATE)
- 83 Strongly Landlord-Friendly
- State Iowa
- 83 Strongly Landlord-Friendly · R+6
- County
- — inherits STATE
- City
- — inherits STATE
ZIP-level market 51103
- Home prices YoY
- -23.0%
- Active inventory
- 79
- Price-to-rent
- 9.7×
Monthly cashflow live
- Estimated rent
- $1,284 high interval (Pro) →
- Mortgage (P&I)
- −$787
- Tax from tax record
- −$94 /mo · $1,128/yr
- Insurance
- −$62
- HOA
- −$0
- Vacancy / Maint / Mgmt
- −$270
- Net cashflow
- $72
Break-even live
Sensitivity live
| Price | -10% $156 | -5% $114 | +0% $72 | +5% $29 | +10% $-13 |
|---|---|---|---|---|---|
| Rent | -10% $-30 | -5% $21 | +0% $72 | +5% $122 | +10% $173 |
| Rate | -1.0pp $147 | -0.5pp $110 | base $72 | +0.5pp $33 | +1.0pp $-7 |
UW: 25.0% down · 7.5% · 30yr · 1.5% tax · 5.0% vac · 8.0% maint · 8.0% mgmt
Financing live
Cash to close
- Down payment
- $37,500
- Closing costs
- $4,500
- Reserves months
- —
- Total cash needed
- —
Loan-product check · same deal, 3 products live
Conventional
25% down · 7.5% · 30yr
- Down + closing
- —
- Monthly P&I
- —
- Monthly cashflow
- —
- DSCR
- —
- Eligible?
- —
Personal DTI + credit; lowest rate.
DSCR
20% down · 8.5% · 30yr
- Down + closing
- —
- Monthly P&I
- —
- Monthly cashflow
- —
- DSCR
- —
- Eligible?
- —
No personal income docs; deal must DSCR.
Hard money
10% down · 12.0% · 12mo
- Down + closing
- —
- Monthly P&I
- —
- Monthly cashflow
- —
- DSCR
- —
- Eligible?
- —
Short-term bridge; refi at stabilization.
Rent comps 9 comps
| Address | Beds | Baths | Sqft | Rent | $/sqft | DOM | Units | Dist |
|---|---|---|---|---|---|---|---|---|
| 301 Wesley Pkwy Sioux City, IA | 1.0 | 1.0 | 620 | $997 | $1.61 | 44d | 1 | 0.77mi |
| 705 Douglas St Sioux City, IA | 2.0 | 2.0 | 1252 | $1,775 | $1.42 | 44d | 5 | 0.98mi |
| 505 6th St Sioux City, IA | 1.0–2.0 | 1.0 | 830 | $2,100 | $2.53 | 44d | 5 | 1.11mi |
| 821 Jackson St Apt 202 Sioux City, IA | 1.0 | 1.0 | 680 | $780 | $1.15 | 44d | 1 | 1.21mi |
| 821 Jackson St Apt 105 Sioux City, IA | 2.0 | 1.0 | 1014 | $1,010 | $1.00 | 44d | 1 | 1.21mi |
| 301 21st St Apt E Sioux City, IA | 1.0 | 1.0 | 600 | $775 | $1.29 | 44d | 1 | 1.31mi |
| 301 21st St Sioux City, IA | 1.0 | 1.0 | 600 | $750 | $1.25 | 44d | 2 | 1.31mi |
| 130 Nebraska St Sioux City, IA | 1.0–2.0 | 1.0–2.0 | 900 | $1,215 | $1.35 | 44d | 8 | 1.31mi |
| 302 Jones St #403 Sioux City, IA | 2.0 | 2.0 | 872 | $1,750 | $2.01 | 44d | 1 | 1.40mi |
Listing history 17 events
-
2026-06-19days on market $150,000 Active 31 DOM
-
2026-06-18days on market $150,000 Active 30 DOM
-
2026-06-17days on market $150,000 Active 29 DOM
-
2026-06-16days on market $150,000 Active 28 DOM
-
2026-06-15days on market $150,000 Active 27 DOM
-
2026-06-14days on market $150,000 Active 25 DOM
-
2026-06-12pricedays on market $150,000 Active 24 DOM
-
2026-06-09days on market $159,900 Active 21 DOM
-
2026-06-08days on market $159,900 Active 20 DOM
-
2026-06-07days on market $159,900 Active 19 DOM
-
2026-06-05days on market $159,900 Active 16 DOM
-
2026-06-02days on market $159,900 Active 14 DOM
-
2026-06-01days on market $159,900 Active 13 DOM
-
2026-05-31days on market $159,900 Active 12 DOM
-
2026-05-30days on market $159,900 Active 11 DOM
-
2026-05-19$159,900 Active
-
2024-01-24soldstatus $140,000
ⓘ Source: listings_history table (triggers on properties + properties_extension) + one-shot
backfill from property_details.listing_events for pre-trigger history.
Tax reassessment forecast IA · Partial reset (capped growth)
- Current annual tax
- $1,128 · $94/mo
- Projected year-2 tax
- $1,742 · $145/mo
- Expected delta
- +$614/yr (+$51/mo · 54.4%)
ⓘ Screening estimate from a state-policy table — verify with the county assessor before closing.
Climate risk First Street
- Flood 1/10 Low FEMA zone X (unshaded) · 0% chance over 30 yrs
- Wildfire 3/10 Moderate
- Heat 3/10 Moderate 7 d/yr ≥103°F today · 15 d/yr by 30 yrs out
- Wind 2/10 Low
- Air quality 1/10 Low 0 unhealthy d/yr today · 0 by 30 yrs out
Nearby sold comps map
Loading sold comps map…
Walkable amenities ~0.75 mi
Loading nearby amenities…
Taxation est. · year 1
- Rental income
- $15,413
- − Mortgage interest
- −$8,402
- − Property taxes
- −$1,128
- − Insurance
- −$750
- − Repairs & maintenance
- −$1,233
- − Management
- −$1,233
- − Depreciation
- −$4,364
- Taxable loss
- −$1,697
- Est. tax savings @ 24.0%
- +$407
- After-tax cash flow
- $1,266/yr
For passive investors: Depreciation is non-cash, so a rental often shows a tax loss while cash-flowing — sheltering income. Rental losses are passive: they offset passive income freely, and up to $25,000/yr can offset ordinary (W-2) income if you actively participate and your MAGI is under $100k (phasing out to $0 by $150k); unused losses carry forward. On sale, claimed depreciation is recaptured at up to 25%, and gains may owe capital-gains tax (a 1031 exchange can defer both). Figures are a year-1 estimate at your 24.0% rate — not tax advice; consult a CPA.
Schools (NCES district)
- District
- Sioux City Community School District
- NCES district ID
- 1926400
- Math proficiency
- 54% ▼ -7.00%
- Reading proficiency
- 57% ▼ -2.00%
- Median HH income
- $44,967
- Composite
- 46.86/100
- National rank
- #2371
- State rank
- #264 of 289 in IA
Livability — Sioux City
- Score
- 78/100
- State rank
- #138
- US rank
- #2544
Category grades
Schools grade is shown separately in the Schools card above.
Census & demographics
- Census place
- Sioux City, IA
- City population
- 51,789
- Population (ZIP)
- 17,145
Population outlook (Woodbury County) Hauer SSP2
- Today (2025)
- 103,226 people
- By 2030
- 103,060 · -0.2%
- By 2040
- 102,533 · -0.7%
- By 2050
- 102,788 · -0.4%
- By 2075
- 107,227 · +3.9%
- By 2100
- 113,980 · +10.4%
Race, ethnicity, and origin ACS 2023
- Neighborhood character
- Diverse neighborhood (Simpson 0.62)
- Race & ethnicity
- White 53% Hispanic / Latino 31% Two or more races 18% Asian 4% Black 4% Native American 4%
- Hispanic origin (detail)
- Mexican 20%
- Common ancestry
- Iranian 3% Portuguese 3% Slovak 2%
- Foreign-born
- 16% · Canada, Vietnam
- Languages at home
- 70% English-only · Spanish 23% Vietnamese 3% German/W. Germanic 1%
Political lean MEDSL · Woodbury
- 2024 margin
- Strong R (+23.0) · D 37.8% · R 60.9% · Other 1.3%
- 2008→2024 swing
- -22.5pp toward R · 2008: -0.5pp · 2024: -23.0pp
- All cycles
- 2024: R+23.0 2020: R+15.5 2016: R+19.9 2012: R+0.2 2008: R+0.5
Not yet ingested
- Civics
- —
Market trends
- HPI YoY
- ▼ -78.41%
- Current HPI
- 262.3809
- Rent YoY
- —
- Metro
- —
- State GDP YoY
- ▲ 2.48%
- F500 in state
- 4
Industry mix (Fortune 500 HQ in IA)
| Industry | F500 HQs | Revenue |
|---|---|---|
| Financial Services | 1 | $16B |
|
||
| Retail / Convenience | 1 | $15B |
|
||
Price history
+14.2% since first listed2 events — show timeline
- 2026-05-19 Listed $159,900 NWIA
- 2024-01-24 Sold (Public Records) $140,000 Public Records
Property tax history
+5.7%/yrLatest (2025): $1,128 · +4.1% YoY. Source: county tax records.
Cash-flow waterfall
monthlySold comps — $/sqft
last 12 mo · ≤1 miLoading sold comps…