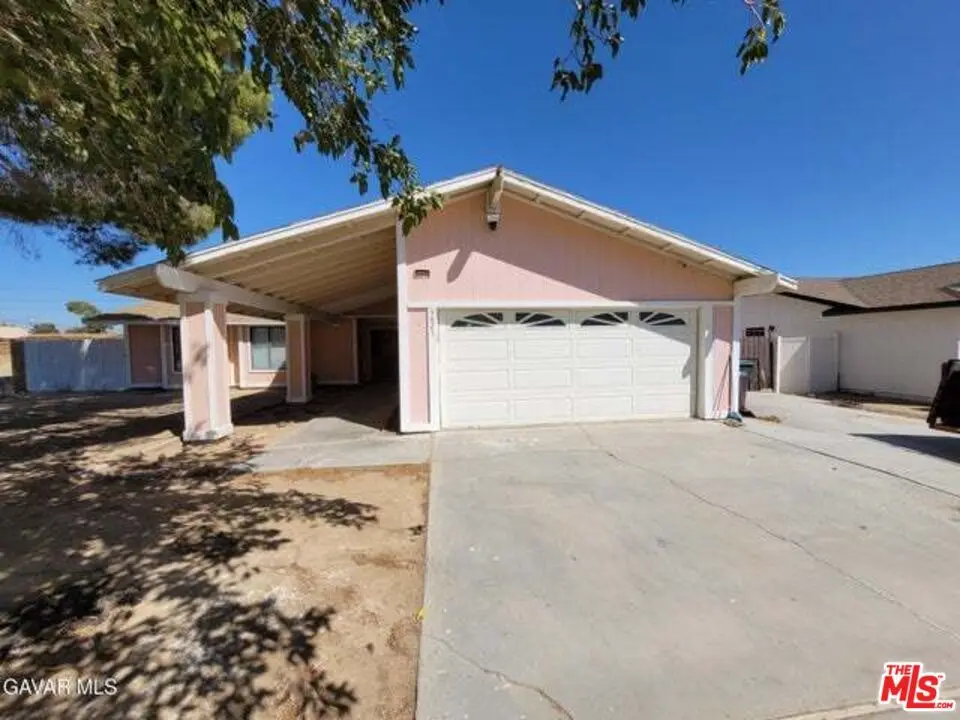
9825 Sally Ave · California City, CA
Flood risk 1/10 · Minimal
- FEMA flood zone
- X (unshaded)
- Chance of flooding over 30 yrs
- 0.0%
- Est. flood insurance / yr
- $507 – $1,088
Fire risk 1/10 · Minimal
- Est. fire insurance / yr
- $659 – $1,223
Heat risk 8/10 · Major
- Hot days now (above 101°F)
- 5 days/yr
- Hot days in 30 yrs
- 13 days/yr
Wind risk 1/10 · Minimal
- Chance of severe wind over 30 yrs
- —
Air-quality risk 7/10 · Major
- Unhealthy air days now
- 13 days/yr
- Unhealthy air days in 30 yrs
- 17 days/yr
Risk factors via First Street. Map © Google.
Why this score? — see what drove the C grade
The composite is a weighted blend of 9 inputs, each scored 0–100. Each bar is that input's sub-score; the figure is the points it added to the 100-point composite (weight × sub-score).
- ARV discount +15.0/15.0
- Cash flow +13.1/30.0
- Appreciation +10.0/10.0
- DSCR +3.9/10.0
- Rent growth +3.9/5.0
- 1% rule +3.0/10.0
- Condition / age +2.5/5.0
- Livability +2.2/5.0
- Schools +2.1/10.0
$264,900
🖨 Deal sheet (PDF) 📄 Offer letter ✓ Due diligence
Listing remarks MLS
Large an Spacious 3 bedroom/2 baths custom home new appliances, flooring and painting upgrades on a pool sized lot with new appliances, flooring and paint upgrades
Key facts
- 0.24 acre lot
- 2 garage spots
- Built 1985
Neighborhood map
What this means for you Summary
Snapshot
- This is a 3-bed/2.0-bath single-family listed at $265k.
Deal economics
- At list price, monthly cash flow is $-8 ($-94/yr) — negative.
- To cash-flow at today's rent, offer at most $264k (0.5% below list).
- To meet the 1% rule (rent ≥ 1% of price), the offer needs to be $212k (20.1% below list).
- Recommended offer: $212k (20.1% below list) — sets the bar for 1% rule.
Location & tenants
- Location reads 44/100 on livability (#1,329 in CA) — a working-class tenant base; expect higher turnover. Strengths: housing A+; Watch: schools F, crime F, amenities F.
- Mojave Unified (town): math 25% / reading 25% proficiency, ranked #411 of 517 in CA (top 80%) — low school quality limits family demand, transient renter base, plan for 1-2y turnover; 76% free/reduced lunch — lower-income household profile, screen leases tightly.
- Market conditions: Rents rising fast (+5.5%/yr); 703 active listings in the ZIP; 11 comparable units currently listed for rent nearby; rentals at typical pace (median 15d on market — plan ~3-4 weeks tenant-placement turnaround); 3,244 units permitted in Kern County in 2024 (73 in 5+ unit buildings).
- This rent runs 42% of the median local income ($60k/yr) — at the standard rent-burdened threshold; future hikes will face affordability resistance.
Forward outlook
- In year one you build about $28k of equity ($2k loan paydown + $26k appreciation (10.0% local appreciation)).
- Kern County population projected at +17% by 2050 — long-run rental-demand tailwind backs the buy-and-hold thesis.
- At projected returns (10.0% appreciation + 5.5% rent growth), your $74k cash investment doubles in ~3 years — after that, you're playing with house money.
- By year 2, paydown + projected appreciation supports a ~$46k cash-out refi (75% LTV) — recoverable capital for the next deal without selling this one.
Negotiation context
- It's been on market 152 days — a 12% lower offer ($233k) is reasonable based on typical stale-listing flexibility.
- 20 sale attempts since 14y ago; this cycle's ask has dropped $30k (10%) from the opening price — seller is motivated, your offer sets the floor, not the list.
- Current owner paid $150k; list at $265k implies a 77% gain — meaningful room to come down on a strong offer.
Risks & watch-outs
- Climate carrying-cost: extreme-heat days projected 5→13/yr by 2055 (HVAC capex compounding) — expect insurance premiums to compound above CPI over the hold.
Questions for the listing agent
- What do current leases actually rent for vs. the listed asking? Can we see a recent rent roll and the last 12 months of T-12 income?
- It's been on market 152 days. Have you received any prior offers? Is the seller open to a 20% concession, seller financing, or rate buy-down credit?
- Why hasn't it sold? Are there any deal-killer items the seller is aware of (foundation, flood, title, zoning, code violations)?
- Is there a deadline driving the sale (1031 exchange, divorce, estate, relocation)? That informs how much negotiation room exists.
- Schools are F-rated, which usually means shorter tenancies and higher turnover. Who's the typical renter profile here, and what's been the actual vacancy rate?
- Crime grade is F in this area — have there been break-ins, vandalism, or insurance claims at this property in the last 3 years? What carrier currently insures it and at what premium?
- What's the average days-on-market for RENTAL listings here right now (not sales)? A rising rental-DOM trend means longer vacancies and softer asking-rent achievability than the comps imply.
- What's the recent tenant-quality profile in this submarket — average credit score on applications, eviction rate, late-payment / NSF rate, and stable-employment percentage? A property-management company in the area should have these aggregated.
- How much new for-sale + rental construction is in the pipeline within 1–3 miles? Heavy new supply typically softens prices + rents 12–24 months out; constrained supply supports both.
Investment metrics
- 1% rule
- 0.80% ✗
- Cap rate
- 6.26%
- Cash-on-cash
- -0.13%
- DSCR
- 0.99
- GRM
- 10.4
CMA / ARV
- ARV (median comp)
- $327,275
- List price
- $264,900
- Delta
- -19.06%
- Verdict
- UNDERPRICED
- Comps
- 20 within 1.0 mi
Show comp detail 12 sales within ~0.75 mi
| Address | Dist | Beds/Ba | Sqft | Sold | Price | $/sf | Match |
|---|---|---|---|---|---|---|---|
| 9925 Irene Ave | 0.12mi | 3/2.5 | 1,750 (-4%) | 0mo | $280,000 | $160 | 85 |
| 21601 Adler | 0.24mi | 3/2.0 | 1,859 (+2%) | 1mo | $360,000 | $194 | 85 |
| 9701 Susan Ave | 0.19mi | 3/2.0 | 1,753 (-4%) | 3mo | $345,000 | $197 | 82 |
| 9840 Margery Ave | 0.23mi | 3/2.0 | 1,625 (-11%) | 2mo | $275,000 | $169 | 70 |
| 9801 Evelyn Ave | 0.30mi | 4/2.0 (+1) | 1,923 (+6%) | 4mo | $325,000 | $169 | 68 |
| 9629 Mendiburu Rd | 0.51mi | 3/2.0 | 1,900 (+4%) | 3mo | $410,000 | $216 | 66 |
| 21851 101st St | 0.39mi | 3/2.0 | 1,960 (+8%) | 4mo | $209,000 | $107 | 66 |
| 9709 Susan Ave | 0.19mi | 4/3.5 (+1) | 1,994 (+9%) | 3mo | $390,000 | $196 | 62 |
| 9418 Karen Ave | 0.46mi | 3/2.0 | 1,626 (-11%) | 3mo | $258,000 | $159 | 58 |
| 10121 Margery Ave | 0.37mi | 4/2.5 (+1) | 2,035 (+12%) | 0mo | $370,000 | $182 | 56 |
| 9644 Raymond Ave | 0.59mi | 4/2.0 (+1) | 1,720 (-6%) | 4mo | $360,000 | $209 | 55 |
| 21631 Sheridan Ct | 0.74mi | 4/2.0 (+1) | 1,792 (-2%) | 4mo | $389,000 | $217 | 54 |
Match score weights: distance 35% · size 25% · config 20% · recency 20%. Top-matched comps best support the ARV.
Projected returns pro-forma
10.0% appreciation · 5.45% rent growth · sell at horizon
- IRR
- 24.9%
- Equity multiple
- 3.01×
- Total profit
- $149,058
- Equity at exit
- $238,643
- IRR
- 22.6%
- Equity multiple
- 7.08×
- Total profit
- $451,198
- Equity at exit
- $514,642
Cash invested: $74,172 (down + closing). Projections, not guarantees.
Landlord ↔ Tenant lean methodology
- Overall (STATE)
- 18 Strongly Tenant-Friendly
- State California
- 18 Strongly Tenant-Friendly · D+13
- County
- — inherits STATE
- City
- — inherits STATE
ZIP-level market 93505
- Home prices YoY
- 13.0%
- Rents YoY
- 5.5%
- Active inventory
- 703
- Price-to-rent
- 10.4×
Monthly cashflow live
- Estimated rent
- $2,116 high interval (Pro) →
- Mortgage (P&I)
- −$1,389
- Tax from tax record
- −$180 /mo · $2,163/yr
- Insurance
- −$110
- HOA
- −$0
- Vacancy / Maint / Mgmt
- −$444
- Net cashflow
- $-8
Break-even live
Sensitivity live
| Price | -10% $142 | -5% $67 | +0% $-8 | +5% $-83 | +10% $-158 |
|---|---|---|---|---|---|
| Rent | -10% $-175 | -5% $-91 | +0% $-8 | +5% $76 | +10% $159 |
| Rate | -1.0pp $126 | -0.5pp $60 | base $-8 | +0.5pp $-76 | +1.0pp $-146 |
UW: 25.0% down · 7.5% · 30yr · 1.5% tax · 5.0% vac · 8.0% maint · 8.0% mgmt
Financing live
Cash to close
- Down payment
- $66,225
- Closing costs
- $7,947
- Reserves months
- —
- Total cash needed
- —
Loan-product check · same deal, 3 products live
Conventional
25% down · 7.5% · 30yr
- Down + closing
- —
- Monthly P&I
- —
- Monthly cashflow
- —
- DSCR
- —
- Eligible?
- —
Personal DTI + credit; lowest rate.
DSCR
20% down · 8.5% · 30yr
- Down + closing
- —
- Monthly P&I
- —
- Monthly cashflow
- —
- DSCR
- —
- Eligible?
- —
No personal income docs; deal must DSCR.
Hard money
10% down · 12.0% · 12mo
- Down + closing
- —
- Monthly P&I
- —
- Monthly cashflow
- —
- DSCR
- —
- Eligible?
- —
Short-term bridge; refi at stabilization.
Rent comps 11 comps
| Address | Beds | Baths | Sqft | Rent | $/sqft | DOM | Units | Dist |
|---|---|---|---|---|---|---|---|---|
| 21319 Conklin Ct California City, CA | 2.0 | 2.0 | 1816 | $2,200 | $1.21 | 44d | 1 | 0.25mi |
| 21235 Windsong St California City, CA | 3.0 | 3.0 | 1780 | $2,100 | $1.18 | 24d | 1 | 0.32mi |
| 21187 Conklin Blvd California City, CA | 3.0 | 2.0 | 1473 | $1,800 | $1.22 | 15d | 1 | 0.40mi |
| 9931 Putter Ct California City, CA | 3.0 | 2.0 | 1445 | $1,675 | $1.16 | 4d | 1 | 0.41mi |
| 10193 Evelyn Ave California City, CA | 3.0 | 2.0 | 1616 | $2,150 | $1.33 | 15d | 1 | 0.53mi |
| 9019 Evelyn Ave California City, CA | 4.0 | 2.0 | 1731 | $2,600 | $1.50 | 4d | 1 | 0.85mi |
| 21231 Corwin St California City, CA | 3.0 | 2.0 | 1632 | $2,500 | $1.53 | 24d | 1 | 0.95mi |
| 21398 Baldwin Ln California City, CA | 4.0 | 2.0 | 1527 | $2,000 | $1.31 | 3d | 1 | 1.07mi |
| 9213 Holly Ave California City, CA | 3.0 | 2.0 | 1339 | $1,900 | $1.42 | 4d | 1 | 1.17mi |
| 8801 S Loop Blvd California City, CA | 3.0 | 2.0 | 1537 | $2,600 | $1.69 | 24d | 1 | 1.41mi |
| 9610 Oleander Ave Unit A California City, CA | 2.0 | 1.0 | 1300 | $1,575 | $1.21 | 24d | 1 | 1.47mi |
Listing history 50 events
-
2026-06-18days on market $264,900 Active 152 DOM
-
2026-06-17pricedays on market $264,900 Active 151 DOM
-
2026-06-16days on market $273,900 Active 150 DOM
-
2026-06-15days on market $273,900 Active 149 DOM
-
2026-06-14days on market $273,900 Active 147 DOM
-
2026-06-13days on market $273,900 Active 146 DOM
-
2026-06-10days on market $273,900 Active 144 DOM
-
2026-06-09days on market $273,900 Active 143 DOM
-
2026-06-08days on market $273,900 Active 142 DOM
-
2026-06-07days on market $273,900 Active 141 DOM
-
2026-06-05days on market $273,900 Active 138 DOM
-
2026-06-03days on market $273,900 Active 137 DOM
-
2026-06-03days on market $273,900 Active 136 DOM
-
2026-06-01days on market $273,900 Active 135 DOM
-
2026-05-31days on market $273,900 Active 134 DOM
-
2026-04-17price $274,000 163-char remark
Show marketing remark (163 chars)
Large an Spacious 3 bedroom/2 baths custom home new appliances, flooring and painting upgrades on a pool sized lot with new appliances, flooring and paint upgrades
-
2026-04-12price $274,000 164-char remark
Show marketing remark (164 chars)
Large an Spacious 3 bedroom/2 baths custom home new appliances, flooring and painting upgrades on a pool sized lot with new appliances, flooring and paint upgrades
-
2026-02-05price $279,000 164-char remark
Show marketing remark (163 chars)
Large an Spacious 3 bedroom/2 baths custom home new appliances, flooring and painting upgrades on a pool sized lot with new appliances, flooring and paint upgrades
-
2026-02-05price $279,000 163-char remark
Show marketing remark (163 chars)
Large an Spacious 3 bedroom/2 baths custom home new appliances, flooring and painting upgrades on a pool sized lot with new appliances, flooring and paint upgrades
-
2026-01-23price $285,000 164-char remark
Show marketing remark (163 chars)
Large an Spacious 3 bedroom/2 baths custom home new appliances, flooring and painting upgrades on a pool sized lot with new appliances, flooring and paint upgrades
-
2026-01-23price $285,000 163-char remark
Show marketing remark (163 chars)
Large an Spacious 3 bedroom/2 baths custom home new appliances, flooring and painting upgrades on a pool sized lot with new appliances, flooring and paint upgrades
-
2026-01-17historical $2,300
-
2026-01-16$295,000 Active 163-char remark
Show marketing remark (164 chars)
Large an Spacious 3 bedroom/2 baths custom home new appliances, flooring and painting upgrades on a pool sized lot with new appliances, flooring and paint upgrades
-
2026-01-16$295,000 Active 164-char remark
Show marketing remark (164 chars)
Large an Spacious 3 bedroom/2 baths custom home new appliances, flooring and painting upgrades on a pool sized lot with new appliances, flooring and paint upgrades
-
2026-01-01$2,300
-
2025-12-21historical $2,300
-
2025-12-17$2,300
-
2025-11-21historical $2,300
-
2025-10-29$2,300
-
2025-09-26Active
-
2025-06-20$268,800 Active
-
2025-06-13price $268,800
-
2025-06-13price
-
2025-05-17price $268,900
-
2025-05-16price
-
2025-04-26price $269,000
-
2025-04-25price
-
2025-04-18price $274,900
-
2025-04-17price
-
2025-04-14price $284,900
-
2025-04-14price
-
2025-02-20price $289,900
-
2025-02-20price
-
2025-01-29Active
-
2024-12-11historical
-
2024-08-08$315,000 Active
-
2019-09-05historical Canceled
-
2019-09-04historical
-
2019-06-27price $175,000
-
2019-05-22$179,900 Active
ⓘ Source: listings_history table (triggers on properties + properties_extension) + one-shot
backfill from property_details.listing_events for pre-trigger history.
Tax reassessment forecast CA · Resets to sale price
- Current annual tax
- $2,163 · $180/mo
- Projected year-2 tax
- $2,163 · $180/mo
- Expected delta
- $0/yr ($0/mo · 0.0%)
ⓘ Screening estimate from a state-policy table — verify with the county assessor before closing.
Climate risk First Street
- Flood 1/10 Low FEMA zone X (unshaded) · 0% chance over 30 yrs
- Wildfire 1/10 Low
- Heat 8/10 Severe 5 d/yr ≥101°F today · 13 d/yr by 30 yrs out
- Wind 1/10 Low
- Air quality 7/10 Severe 13 unhealthy d/yr today · 17 by 30 yrs out
Nearby sold comps map
Loading sold comps map…
Walkable amenities ~0.75 mi
Loading nearby amenities…
Taxation est. · year 1
- Rental income
- $25,397
- − Mortgage interest
- −$14,839
- − Property taxes
- −$2,163
- − Insurance
- −$1,324
- − Repairs & maintenance
- −$2,032
- − Management
- −$2,032
- − Depreciation
- −$7,706
- Taxable loss
- −$4,699
- Est. tax savings @ 24.0%
- +$1,128
- After-tax cash flow
- $1,034/yr
For passive investors: Depreciation is non-cash, so a rental often shows a tax loss while cash-flowing — sheltering income. Rental losses are passive: they offset passive income freely, and up to $25,000/yr can offset ordinary (W-2) income if you actively participate and your MAGI is under $100k (phasing out to $0 by $150k); unused losses carry forward. On sale, claimed depreciation is recaptured at up to 25%, and gains may owe capital-gains tax (a 1031 exchange can defer both). Figures are a year-1 estimate at your 24.0% rate — not tax advice; consult a CPA.
Schools (NCES district)
- District
- Mojave Unified
- NCES district ID
- 0625230
- Math proficiency
- 25% ▲ 11.00%
- Reading proficiency
- 25% ▼ -1.00%
- Median HH income
- $43,017
- Composite
- 21.4/100
- National rank
- #8350
- State rank
- #411 of 517 in CA
Livability — California City
- Score
- 44/100
- State rank
- #1329
- US rank
- #26753
Category grades
Schools grade is shown separately in the Schools card above.
Census & demographics
- Census place
- California City, CA
- County
- Kern County · 710,371 people
- City population
- 14,353
- Metro
- Bakersfield, CA
- Population (ZIP)
- 14,353
- Household income
- $59,827
- Rent vs Own
- Severe rent burden
- 883.0
Population outlook (Kern County) Hauer SSP2
- Today (2025)
- 947,286 people
- By 2030
- 978,984 · +3.3%
- By 2040
- 1,045,018 · +10.3%
- By 2050
- 1,105,232 · +16.7%
- By 2075
- 1,229,538 · +29.8%
- By 2100
- 1,238,059 · +30.7%
Race, ethnicity, and origin ACS 2023
- Neighborhood character
- Highly diverse neighborhood (Simpson 0.70)
- Race & ethnicity
- Hispanic / Latino 40% White 30% Black 22% Two or more races 16% Native American 3% Asian 1%
- Hispanic origin (detail)
- Mexican 29%
- Common ancestry
- Italian 3% Lithuanian 1% Romanian 1%
- Foreign-born
- 13% · Canada, Dominican Republic
- Languages at home
- 68% English-only · Spanish 29%
Political lean MEDSL · Kern
- 2024 margin
- Strong R (+21.1) · D 38.2% · R 59.3% · Other 2.5%
- 2008→2024 swing
- -3.3pp toward R · 2008: -17.8pp · 2024: -21.1pp
- All cycles
- 2024: R+21.1 2020: R+10.2 2016: R+15.0 2012: R+20.9 2008: R+17.8
Not yet ingested
- Civics
- —
Market trends
- HPI YoY
- ▲ 46.32%
- Current HPI
- 402.4192
- Rent YoY
- ▲ 5.45%
- Metro
- Bakersfield, CA
- State GDP YoY
- ▲ 3.21%
- F500 in state
- 116
Industry mix (Fortune 500 HQ in CA)
| Industry | F500 HQs | Revenue |
|---|---|---|
| Technology | 27 | $1,492B |
|
||
| Financial Services | 3 | $174B |
|
||
| Retail | 3 | $44B |
|
||
| Insurance | 3 | $26B |
|
||
| Media / Entertainment | 2 | $115B |
|
||
| Pharmaceuticals / Biotech | 2 | $62B |
|
||
Price history
+112.4% since first listed63 events — show timeline
- 2026-04-17 Price Changed $274,000 TheMLS
- 2026-04-12 Price Changed $274,000 AVMLS
- 2026-02-05 Price Changed $279,000 AVMLS
- 2026-02-05 Price Changed $279,000 TheMLS
- 2026-01-23 Price Changed $285,000 AVMLS
- 2026-01-23 Price Changed $285,000 TheMLS
- 2026-01-17 Rental Removed $2,300 CLAW
- 2026-01-16 Listed $295,000 AVMLS
- 2026-01-16 Listed $295,000 TheMLS
- 2026-01-01 Listed for Rent $2,300 CLAW
- 2025-12-21 Rental Removed $2,300 CLAW
- 2025-12-17 Listed for Rent $2,300 CLAW
- 2025-11-21 Rental Removed $2,300 CLAW
- 2025-10-29 Listed for Rent $2,300 CLAW
- 2025-09-26 Listed — TheMLS
- 2025-06-20 Listed $268,800 SSMLS
- 2025-06-13 Price Changed $268,800 AVMLS
- 2025-06-13 Price Changed — TheMLS
- 2025-05-17 Price Changed $268,900 AVMLS
- 2025-05-16 Price Changed — TheMLS
- 2025-04-26 Price Changed $269,000 AVMLS
- 2025-04-25 Price Changed — TheMLS
- 2025-04-18 Price Changed $274,900 AVMLS
- 2025-04-17 Price Changed — TheMLS
- 2025-04-14 Price Changed $284,900 AVMLS
- 2025-04-14 Price Changed — TheMLS
- 2025-02-20 Price Changed $289,900 AVMLS
- 2025-02-20 Price Changed — TheMLS
- 2025-01-29 Listed — TheMLS
- 2024-12-11 Listing Removed — CRMLS
- 2024-08-08 Listed $315,000 CRMLS
- 2019-09-05 Delisted — TheMLS
- 2019-09-04 Listing Removed — AVMLS
- 2019-06-27 Price Changed $175,000 AVMLS
- 2019-05-22 Listed $179,900 AVMLS
- 2019-05-20 Listed — TheMLS
- 2017-07-27 Sold (Public Records) $150,100 Public Records
- 2017-07-27 Sold (MLS) $150,000 AVMLS
- 2017-07-26 Sold (MLS) $150,000 CRMLS
- 2017-05-16 Pending — CRMLS
- 2017-05-16 Pending — AVMLS
- 2017-04-08 Relisted — CRMLS
- 2017-04-08 Relisted — AVMLS
- 2017-02-09 Pending — CRMLS
- 2017-02-09 Pending — AVMLS
- 2016-08-23 Price Changed $149,500 AVMLS
- 2016-08-23 Price Changed $149,500 CRMLS
- 2016-07-14 Listing Removed — CRMLS
- 2016-07-14 Listed $154,900 CRMLS
- 2016-07-14 Listed $154,900 CRMLS
- 2016-07-14 Listed $154,900 AVMLS
- 2015-08-13 Listing Removed — CRMLS
- 2014-12-12 Listed $155,000 CRMLS
- 2013-12-02 Sold (Public Records) $93,500 Public Records
- 2013-11-30 Sold (MLS) $93,333 TheMLS
- 2013-10-01 Delisted — TheMLS
- 2013-06-07 Listed $99,950 TheMLS
- 2013-02-28 Sold (MLS) $63,000 AVMLS
- 2013-02-28 Sold (MLS) $63,000 CRMLS
- 2013-01-28 Listing Removed — CRMLS
- 2012-06-25 Listed $82,900 AVMLS
- 2012-06-25 Listed $82,900 CRMLS
- 2003-02-27 Sold (Public Records) $129,000 Public Records
Property tax history
+4.4%/yrLatest (2025): $2,163 · -5.0% YoY. Source: county tax records.
Cash-flow waterfall
monthlySold comps — $/sqft
last 12 mo · ≤1 miLoading sold comps…