8751 Richardson Plat Rd · Minocqua, WI
Flood risk 1/10 · Minimal
- FEMA flood zone
- X (unshaded)
- Chance of flooding over 30 yrs
- 0.0%
- Est. flood insurance / yr
- $473 – $860
Fire risk 4/10 · Minor
- Est. fire insurance / yr
- $636 – $1,182
Heat risk 1/10 · Minimal
- Hot days now (above 91°F)
- 7 days/yr
- Hot days in 30 yrs
- 13 days/yr
Wind risk 1/10 · Minimal
- Chance of severe wind over 30 yrs
- —
Air-quality risk 1/10 · Minimal
- Unhealthy air days now
- 0 days/yr
- Unhealthy air days in 30 yrs
- 0 days/yr
Risk factors via First Street. Map © Google.
Why this score? — see what drove the C+ grade
The composite is a weighted blend of 9 inputs, each scored 0–100. Each bar is that input's sub-score; the figure is the points it added to the 100-point composite (weight × sub-score).
- Cash flow +28.1/30.0
- DSCR +10.0/10.0
- ARV discount +7.5/15.0
- 1% rule +6.7/10.0
- Schools +3.9/10.0
- Livability +3.8/5.0
- Rent growth +2.5/5.0
- Condition / age +2.5/5.0
- Appreciation +0.0/10.0
$94,000
🖨 Deal sheet (PDF) 📄 Offer letter ✓ Due diligence
Listing remarks
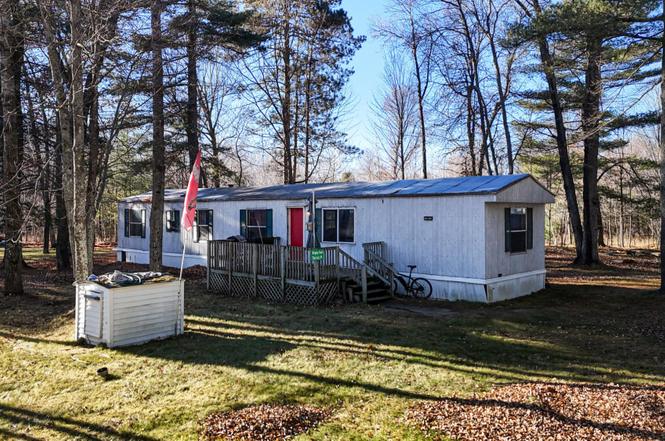
Affordable Northwoods getaway just minutes from everything in Minocqua. This three-bedroom, one-bath manufactured home sits on 0.4 acres of high ground on Richardson Plat Road, quietly tucked behind Walmart for unbeatable convenience to shopping, dining, medical, and the snowmobile trail system. Built in 1996, the home is ready for some TLC and sweat equity. However, the fundamentals are here: a mound septic system, point well, level usable land, and plenty of room for parking trailers, sleds, or toys. Perfect for someone looking for a simple place to land in the Northwoods, a budget-friendly year-round home, or a weekend basecamp for snowmobiling, fishing, and exploring Minocqua’s ou
Key facts
- Mound septic system
- Level usable land
- Point well
Tags
Property features AI
Exterior
- Parking: No garage
- Utilities: Private well water; Electric with circuit breaker panel; Septic tank (mound septic)
- Home design: Mobile home; Residential property
- Construction: Construction details not provided
- Exterior features: Paved road access; Zoned General Business
Interior
- Kitchen: Gas oven; Gas range; Dishwasher; Microwave; Refrigerator
- Bathrooms: 1 full bathroom
- Heating & cooling: Wall/window air conditioning unit(s); Electric heating; Natural gas heating; Wall furnace
- Interior features: Dishwasher; Microwave; Refrigerator; Electric water heater; No fireplace
- Laundry & utility: Washer; Dryer
Neighborhood map
What this means for you Summary
Snapshot
- This is a 3-bed/1.0-bath other listed at $94k.
Deal economics
- At list price, monthly cash flow is $295 ($4k/yr) — positive.
- The deal already cash-flows at list — no discount required.
- Meets the 1% rule at list price ($1k rent vs $94k).
- Recommended offer: $83k (12.0% below list) — sets the bar for market timing.
- Cap rate 10.1% vs local median 1.0% in Minocqua — top-decile yield for the area; either an underpriced asset or a hidden risk that comps aren't pricing in. Stress-test before assuming the spread holds.
Location & tenants
- Location reads 75/100 on livability (#160 in WI, #4,279 nationally) — a middle-class / working-renter tenant base. Strengths: cost of living A+, health & safety A+, crime A-; Watch: employment C-, schools D, commute F.
- Minocqua J1 School District (rural): math 44% / reading 48% proficiency, ranked #92 of 342 in WI (top 27%) — families likely to look elsewhere, expect single-tenant / working-renter base with shorter leases.
- Market conditions: 78 active listings in the ZIP; 307 units permitted in Oneida County in 2024 (0 in 5+ unit buildings).
Forward outlook
- Local home prices are declining (-3.0%/yr); year-one equity from $650 of loan paydown is wiped out by about $3k of value loss. Plan a longer hold.
- Oneida County population projected at -20% by 2050 — secular population decline; favor cash flow + early exit over multi-decade hold.
- At projected returns (-3.0% appreciation + 3.0% rent growth), your $26k cash investment doubles in ~9 years — after that, you're playing with house money.
Negotiation context
- It's been on market 160 days — a 12% lower offer ($83k) is reasonable based on typical stale-listing flexibility.
- 2 sale attempts; this cycle's ask has dropped $5k (5%) from the opening price — seller is motivated, your offer sets the floor, not the list.
- Current owner paid $36k; list at $94k implies a 161% gain — meaningful room to come down on a strong offer.
Questions for the listing agent
- It's been on market 160 days. Have you received any prior offers? Is the seller open to a 12% concession, seller financing, or rate buy-down credit?
- Why hasn't it sold? Are there any deal-killer items the seller is aware of (foundation, flood, title, zoning, code violations)?
- Is there a deadline driving the sale (1031 exchange, divorce, estate, relocation)? That informs how much negotiation room exists.
- Schools are D-rated, which usually means shorter tenancies and higher turnover. Who's the typical renter profile here, and what's been the actual vacancy rate?
- What's the average days-on-market for RENTAL listings here right now (not sales)? A rising rental-DOM trend means longer vacancies and softer asking-rent achievability than the comps imply.
- What's the recent tenant-quality profile in this submarket — average credit score on applications, eviction rate, late-payment / NSF rate, and stable-employment percentage? A property-management company in the area should have these aggregated.
- How much new for-sale + rental construction is in the pipeline within 1–3 miles? Heavy new supply typically softens prices + rents 12–24 months out; constrained supply supports both.
Investment metrics
- 1% rule
- 1.17% ✓
- Cap rate
- 10.06%
- Cash-on-cash
- 13.47%
- DSCR
- 1.60
- GRM
- 7.1
CMA / ARV
No comps found within radius.
Projected returns pro-forma
-3.0% appreciation · 3.0% rent growth · sell at horizon
- IRR
- 3.5%
- Equity multiple
- 1.13×
- Total profit
- $3,549
- Equity at exit
- $14,016
- IRR
- 13.0%
- Equity multiple
- 2.03×
- Total profit
- $27,187
- Equity at exit
- $8,127
Cash invested: $26,320 (down + closing). Projections, not guarantees.
Landlord ↔ Tenant lean methodology
- Overall (STATE)
- 73 Landlord-Friendly
- State Wisconsin
- 73 Landlord-Friendly · R+2
- County
- — inherits STATE
- City
- — inherits STATE
ZIP-level market 54548
- Active inventory
- 78
- Price-to-rent
- 7.1×
Monthly cashflow live
- Estimated rent
- $1,098 medium interval (Pro) →
- Mortgage (P&I)
- −$493
- Tax from tax record
- −$40 /mo · $475/yr
- Insurance
- −$39
- HOA
- −$0
- Vacancy / Maint / Mgmt
- −$230
- Net cashflow
- $295
Break-even live
Sensitivity live
| Price | -10% $349 | -5% $322 | +0% $295 | +5% $269 | +10% $242 |
|---|---|---|---|---|---|
| Rent | -10% $209 | -5% $252 | +0% $295 | +5% $339 | +10% $382 |
| Rate | -1.0pp $343 | -0.5pp $319 | base $295 | +0.5pp $271 | +1.0pp $246 |
UW: 25.0% down · 7.5% · 30yr · 1.5% tax · 5.0% vac · 8.0% maint · 8.0% mgmt
Financing live
Cash to close
- Down payment
- $23,500
- Closing costs
- $2,820
- Reserves months
- —
- Total cash needed
- —
Loan-product check · same deal, 3 products live
Conventional
25% down · 7.5% · 30yr
- Down + closing
- —
- Monthly P&I
- —
- Monthly cashflow
- —
- DSCR
- —
- Eligible?
- —
Personal DTI + credit; lowest rate.
DSCR
20% down · 8.5% · 30yr
- Down + closing
- —
- Monthly P&I
- —
- Monthly cashflow
- —
- DSCR
- —
- Eligible?
- —
No personal income docs; deal must DSCR.
Hard money
10% down · 12.0% · 12mo
- Down + closing
- —
- Monthly P&I
- —
- Monthly cashflow
- —
- DSCR
- —
- Eligible?
- —
Short-term bridge; refi at stabilization.
Listing history 7 events
-
2026-04-28status Pending
-
2026-04-27status Active
-
2026-03-06historical Active Under Contract
-
2026-01-16price $94,000
-
2025-11-14$99,000 Active
-
2004-06-22soldstatus $36,000
-
2000-04-24soldstatus $35,000
ⓘ Source: listings_history table (triggers on properties + properties_extension) + one-shot
backfill from property_details.listing_events for pre-trigger history.
Tax reassessment forecast WI · Partial reset (capped growth)
- Current annual tax
- $475 · $40/mo
- Projected year-2 tax
- $1,107 · $92/mo
- Expected delta
- +$632/yr (+$53/mo · 133.2%)
ⓘ Screening estimate from a state-policy table — verify with the county assessor before closing.
Climate risk First Street
- Flood 1/10 Low FEMA zone X (unshaded) · 0% chance over 30 yrs
- Wildfire 4/10 Moderate
- Heat 1/10 Low 7 d/yr ≥91°F today · 13 d/yr by 30 yrs out
- Wind 1/10 Low
- Air quality 1/10 Low 0 unhealthy d/yr today · 0 by 30 yrs out
Nearby sold comps map
Loading sold comps map…
Walkable amenities ~0.75 mi
Loading nearby amenities…
Taxation est. · year 1
- Rental income
- $13,170
- − Mortgage interest
- −$5,265
- − Property taxes
- −$475
- − Insurance
- −$470
- − Repairs & maintenance
- −$1,054
- − Management
- −$1,054
- − Depreciation
- −$2,735
- Taxable income
- $2,118
- Est. tax owed @ 24.0%
- −$508
- After-tax cash flow
- $3,036/yr
For passive investors: Depreciation is non-cash, so a rental often shows a tax loss while cash-flowing — sheltering income. Rental losses are passive: they offset passive income freely, and up to $25,000/yr can offset ordinary (W-2) income if you actively participate and your MAGI is under $100k (phasing out to $0 by $150k); unused losses carry forward. On sale, claimed depreciation is recaptured at up to 25%, and gains may owe capital-gains tax (a 1031 exchange can defer both). Figures are a year-1 estimate at your 24.0% rate — not tax advice; consult a CPA.
Schools (NCES district)
- District
- Minocqua J1 School District
- NCES district ID
- 5509690
- Math proficiency
- 44% ▲ 1.00%
- Reading proficiency
- 48% ▲ 2.00%
- Median HH income
- $48,753
- Composite
- 39.34/100
- National rank
- #3981
- State rank
- #92 of 342 in WI
Livability — Minocqua
- Score
- 75/100
- State rank
- #160
- US rank
- #4279
Category grades
Schools grade is shown separately in the Schools card above.
Census & demographics
- Population (ZIP)
- 5,703
Population outlook (Oneida County) Hauer SSP2
- Today (2025)
- 34,468 people
- By 2030
- 33,373 · -3.2%
- By 2040
- 30,391 · -11.8%
- By 2050
- 27,438 · -20.4%
- By 2075
- 23,041 · -33.2%
- By 2100
- 18,405 · -46.6%
Race, ethnicity, and origin ACS 2023
- Neighborhood character
- Predominantly White (90%)
- Race & ethnicity
- White 90% Two or more races 6% Native American 4% Hispanic / Latino 2%
- Common ancestry
- Romanian 8% Portuguese 6% Lithuanian 5%
- Foreign-born
- 1% · Canada
- Languages at home
- 98% English-only · Spanish 1% Russian/Polish/Slavic 1%
Political lean MEDSL · Oneida
- 2024 margin
- R (+17.6) · D 40.6% · R 58.2% · Other 1.2%
- 2008→2024 swing
- -28.0pp toward R · 2008: 10.4pp · 2024: -17.6pp
- All cycles
- 2024: R+17.6 2020: R+14.8 2016: R+17.1 2012: R+2.2 2008: D+10.4
Not yet ingested
- Civics
- —
Market trends
- HPI YoY
- ▼ -281.88%
- Current HPI
- 175.2622
- Rent YoY
- —
- Metro
- —
- State GDP YoY
- ▲ 2.10%
- F500 in state
- 20
Industry mix (Fortune 500 HQ in WI)
| Industry | F500 HQs | Revenue |
|---|---|---|
| Industrial Machinery | 4 | $23B |
|
||
| Industrial Technology | 2 | $36B |
|
||
| Insurance | 1 | $36B |
|
||
| Professional Services | 1 | $19B |
|
||
| Utilities | 1 | $9B |
|
||
| Consumer Goods | 1 | $3B |
|
||
Price history
+168.6% since first listed7 events — show timeline
- 2026-04-28 Pending — GNMLS
- 2026-04-27 Relisted — GNMLS
- 2026-03-06 Contingent — GNMLS
- 2026-01-16 Price Changed $94,000 GNMLS
- 2025-11-14 Listed $99,000 GNMLS
- 2004-06-22 Sold (Public Records) $36,000 Public Records
- 2000-04-24 Sold (Public Records) $35,000 Public Records
Property tax history
-0.6%/yrLatest (2025): $475 · +2.8% YoY. Source: county tax records.
Cash-flow waterfall
monthlySold comps — $/sqft
last 12 mo · ≤1 miLoading sold comps…