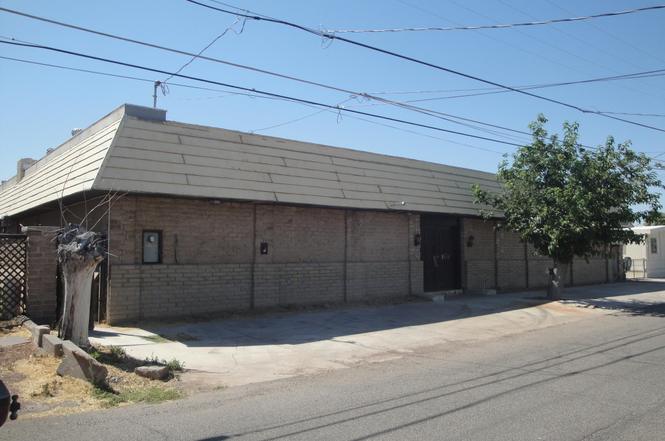
309 N Moonlight Dr · Bluewater, AZ
Flood risk No data
- FEMA flood zone
- —
- Chance of flooding over 30 yrs
- —
- Est. flood insurance / yr
- —
Fire risk No data
- Est. fire insurance / yr
- —
Heat risk No data
- Hot days now (above threshold)
- —
- Hot days in 30 yrs
- —
Wind risk No data
- Chance of severe wind over 30 yrs
- —
Air-quality risk No data
- Unhealthy air days now
- —
- Unhealthy air days in 30 yrs
- —
Risk factors via First Street. Map © Google.
Why this score? — see what drove the B- grade
The composite is a weighted blend of 9 inputs, each scored 0–100. Each bar is that input's sub-score; the figure is the points it added to the 100-point composite (weight × sub-score).
- Cash flow +30.0/30.0
- 1% rule +10.0/10.0
- DSCR +10.0/10.0
- ARV discount +7.5/15.0
- Livability +3.2/5.0
- Rent growth +2.5/5.0
- Condition / age +2.5/5.0
- Schools +1.5/10.0
- Appreciation +0.0/10.0
$53,900
🖨 Deal sheet (PDF) 📄 Offer letter ✓ Due diligence
Listing remarks
This property is now active in an online auction. The online sales event for this property begin on 09/1/2024 and ends on 09/3/2024. All offers must be submitted through the property's listing page on www. auction.com. The sale will be subject to a 5% buyer's premium pursuant to the Auction Terms and Conditions (minimums may apply). All auction bids will be processed subject to seller approval. Live along the river! Enjoy the community amenities such as gated secure entry. .. pool. .. picnic areas. .. launch ramp! Private adobe home features two separate living areas each with a fireplace. .. 3 bedrooms. .. 3 bathrooms! Uniquely styled home wrapped around inner courtyard!
Key facts
- 0.23 acre lot
- Pool
- Built 1972
Neighborhood map
What this means for you Summary
Snapshot
- This is a 3-bed/3.0-bath single-family listed at $54k.
Deal economics
- At list price, monthly cash flow is $1k ($14k/yr) — positive.
- The deal already cash-flows at list — no discount required.
- Meets the 1% rule at list price ($2k rent vs $54k).
- Recommended offer: $52k (3.0% below list) — sets the bar for market timing.
- Cap rate 32.6% vs local median 9.9% in Bluewater — top-decile yield for the area; either an underpriced asset or a hidden risk that comps aren't pricing in. Stress-test before assuming the spread holds.
Location & tenants
- Location reads 65/100 on livability (#81 in AZ) — a middle-class / working-renter tenant base. Strengths: cost of living A+, housing A+, crime A-; Watch: health & safety C-, employment D+, amenities F.
- Parker Unified School District (4510) (town): math 18% / reading 18% proficiency, ranked #200 of 249 in AZ (top 80%) — low school quality limits family demand, transient renter base, plan for 1-2y turnover; 69% free/reduced lunch — lower-income household profile, screen leases tightly.
- Zoned schools: Blake Primary School (354 students, 70% FRL); Wallace Jr High School (math 15% / reading 18%, grade F, #151 of 218 statewide, top 70%, 303 students, 73% FRL); Parker High School (math 8% / reading 12%, grade F, #343 of 381 statewide, top 93%, 507 students, 69% FRL) — zoned schools at 70% FRL track the district average.
- Market conditions: 147 active listings in the ZIP; 92 units permitted in La Paz County in 2024 (0 in 5+ unit buildings).
Forward outlook
- Local home prices are declining (-3.0%/yr); year-one equity from $373 of loan paydown is wiped out by about $2k of value loss. Plan a longer hold.
- La Paz County population projected at -11% by 2050 — secular population decline; favor cash flow + early exit over multi-decade hold.
- At projected returns (-3.0% appreciation + 3.0% rent growth), your $15k cash investment doubles in ~2 years — after that, you're playing with house money.
Negotiation context
- It's been on market 34 days — a 3% lower offer ($52k) is reasonable based on typical stale-listing flexibility.
- 10 sale attempts since 19y ago with the ask held roughly flat each time — persistent listings suggest the price (not the market) is what's stuck; bring a comps-based counter.
Questions for the listing agent
- It's been on market 34 days. Have you received any prior offers? Is the seller open to a 3% concession, seller financing, or rate buy-down credit?
- Built in 1972 — when were the roof, HVAC, electrical panel, plumbing, and water heater last replaced?
- Is there a deadline driving the sale (1031 exchange, divorce, estate, relocation)? That informs how much negotiation room exists.
- Schools are F-rated, which usually means shorter tenancies and higher turnover. Who's the typical renter profile here, and what's been the actual vacancy rate?
- What's the average days-on-market for RENTAL listings here right now (not sales)? A rising rental-DOM trend means longer vacancies and softer asking-rent achievability than the comps imply.
- What's the recent tenant-quality profile in this submarket — average credit score on applications, eviction rate, late-payment / NSF rate, and stable-employment percentage? A property-management company in the area should have these aggregated.
- How much new for-sale + rental construction is in the pipeline within 1–3 miles? Heavy new supply typically softens prices + rents 12–24 months out; constrained supply supports both.
Investment metrics
- 1% rule
- 3.65% ✓
- Cap rate
- 32.64%
- Cash-on-cash
- 94.11%
- DSCR
- 5.19
- GRM
- 2.3
CMA / ARV
No comps found within radius.
Projected returns pro-forma
-3.0% appreciation · 3.0% rent growth · sell at horizon
- IRR
- 95.0%
- Equity multiple
- 5.42×
- Total profit
- $66,675
- Equity at exit
- $8,037
- IRR
- 97.7%
- Equity multiple
- 11.29×
- Total profit
- $155,244
- Equity at exit
- $4,660
Cash invested: $15,092 (down + closing). Projections, not guarantees.
Landlord ↔ Tenant lean methodology
- Overall (STATE)
- 87 Strongly Landlord-Friendly
- State Arizona
- 87 Strongly Landlord-Friendly · R+3
- County
- — inherits STATE
- City
- — inherits STATE
ZIP-level market 85344
- Active inventory
- 147
- Price-to-rent
- 2.3×
Monthly cashflow live
- Estimated rent
- $1,970 medium interval (Pro) →
- Mortgage (P&I)
- −$283
- Tax est. 1.5%
- −$67 /mo · $808/yr
- Insurance
- −$22
- HOA
- −$0
- Vacancy / Maint / Mgmt
- −$414
- Net cashflow
- $1,184
Break-even live
Sensitivity live
| Price | -10% $1,221 | -5% $1,202 | +0% $1,184 | +5% $1,165 | +10% $1,146 |
|---|---|---|---|---|---|
| Rent | -10% $1,028 | -5% $1,106 | +0% $1,184 | +5% $1,261 | +10% $1,339 |
| Rate | -1.0pp $1,211 | -0.5pp $1,197 | base $1,184 | +0.5pp $1,170 | +1.0pp $1,155 |
UW: 25.0% down · 7.5% · 30yr · 1.5% tax · 5.0% vac · 8.0% maint · 8.0% mgmt
Financing live
Cash to close
- Down payment
- $13,475
- Closing costs
- $1,617
- Reserves months
- —
- Total cash needed
- —
Loan-product check · same deal, 3 products live
Conventional
25% down · 7.5% · 30yr
- Down + closing
- —
- Monthly P&I
- —
- Monthly cashflow
- —
- DSCR
- —
- Eligible?
- —
Personal DTI + credit; lowest rate.
DSCR
20% down · 8.5% · 30yr
- Down + closing
- —
- Monthly P&I
- —
- Monthly cashflow
- —
- DSCR
- —
- Eligible?
- —
No personal income docs; deal must DSCR.
Hard money
10% down · 12.0% · 12mo
- Down + closing
- —
- Monthly P&I
- —
- Monthly cashflow
- —
- DSCR
- —
- Eligible?
- —
Short-term bridge; refi at stabilization.
Listing history 23 events
-
2024-09-11status Pending
-
2024-08-08$53,900 Active
-
2024-06-04status Pending
-
2024-04-11$68,500 Active
-
2024-04-11price $68,500
-
2024-04-11status Active
-
2023-10-19status Pending
-
2023-10-19status Pending
-
2023-10-18price $73,500
-
2023-10-18price $73,500
-
2023-09-18price $78,500
-
2023-09-18price $78,500
-
2023-08-20status Active
-
2023-08-20price $84,900
-
2023-08-20price $84,900
-
2023-08-01historical
-
2023-07-19$97,500 Active
-
2023-07-19$97,500 Active
-
2020-07-20$89,900
-
2020-07-20$89,900
-
2013-01-07$179,900
-
2007-10-05historical
-
2007-09-05$223,000
ⓘ Source: listings_history table (triggers on properties + properties_extension) + one-shot
backfill from property_details.listing_events for pre-trigger history.
Nearby sold comps map
Loading sold comps map…
Walkable amenities ~0.75 mi
Loading nearby amenities…
Taxation est. · year 1
- Rental income
- $23,636
- − Mortgage interest
- −$3,019
- − Property taxes
- −$808
- − Insurance
- −$270
- − Repairs & maintenance
- −$1,891
- − Management
- −$1,891
- − Depreciation
- −$1,568
- Taxable income
- $14,189
- Est. tax owed @ 24.0%
- −$3,405
- After-tax cash flow
- $10,797/yr
For passive investors: Depreciation is non-cash, so a rental often shows a tax loss while cash-flowing — sheltering income. Rental losses are passive: they offset passive income freely, and up to $25,000/yr can offset ordinary (W-2) income if you actively participate and your MAGI is under $100k (phasing out to $0 by $150k); unused losses carry forward. On sale, claimed depreciation is recaptured at up to 25%, and gains may owe capital-gains tax (a 1031 exchange can defer both). Figures are a year-1 estimate at your 24.0% rate — not tax advice; consult a CPA.
Schools (NCES district)
- District
- Parker Unified School District (4510)
- NCES district ID
- 0405980
- Math proficiency
- 18% ▼ -10.00%
- Reading proficiency
- 18% ▼ -7.00%
- Median HH income
- $34,354
- Composite
- 14.76/100
- National rank
- #9392
- State rank
- #200 of 249 in AZ
Livability — Bluewater
- Score
- 65/100
- State rank
- #81
- US rank
- #12872
Category grades
Schools grade is shown separately in the Schools card above.
Census & demographics
- Census place
- Bluewater, AZ
- Population (ZIP)
- 9,069
Population outlook (La Paz County) Hauer SSP2
- Today (2025)
- 18,409 people
- By 2030
- 17,592 · -4.4%
- By 2040
- 16,600 · -9.8%
- By 2050
- 16,328 · -11.3%
- By 2075
- 17,075 · -7.2%
- By 2100
- 17,042 · -7.4%
Race, ethnicity, and origin ACS 2023
- Neighborhood character
- Highly diverse neighborhood (Simpson 0.72)
- Race & ethnicity
- White 40% Hispanic / Latino 34% Native American 23% Two or more races 19% Asian 2%
- Hispanic origin (detail)
- Mexican 32%
- Common ancestry
- Slovak 1% Lithuanian 1% Portuguese 1%
- Foreign-born
- 10% · Canada
- Languages at home
- 74% English-only · Spanish 21% Other Indo-European 1% Tagalog/Filipino 1%
Political lean MEDSL · La Paz
- 2024 margin
- Solid R (+44.2) · D 27.6% · R 71.8%
- 2008→2024 swing
- -15.7pp toward R · 2008: -28.5pp · 2024: -44.2pp
- All cycles
- 2024: R+44.2 2020: R+38.8 2016: R+41.8 2012: R+32.2 2008: R+28.5
Not yet ingested
- Civics
- —
Market trends
- HPI YoY
- ▼ -155.38%
- Current HPI
- 198.2271
- Rent YoY
- —
- Metro
- —
- State GDP YoY
- ▲ 4.54%
- F500 in state
- 20
Industry mix (Fortune 500 HQ in AZ)
| Industry | F500 HQs | Revenue |
|---|---|---|
| Technology | 2 | $13B |
|
||
| Mining / Metals | 1 | $23B |
|
||
| Environmental Services | 1 | $16B |
|
||
| Metals / Steel | 1 | $14B |
|
||
| Technology Distribution | 1 | $9B |
|
||
| Homebuilding | 1 | $8B |
|
||
Price history
-75.8% since first listed23 events — show timeline
- 2024-09-11 Pending — LHAR
- 2024-08-08 Listed $53,900 LHAR
- 2024-06-04 Pending — LHAR
- 2024-04-11 Listed $68,500 LHAR
- 2024-04-11 Price Changed $68,500 WARDEX
- 2024-04-11 Relisted — WARDEX
- 2023-10-19 Pending — WARDEX
- 2023-10-19 Pending — LHAR
- 2023-10-18 Price Changed $73,500 WARDEX
- 2023-10-18 Price Changed $73,500 LHAR
- 2023-09-18 Price Changed $78,500 LHAR
- 2023-09-18 Price Changed $78,500 WARDEX
- 2023-08-20 Relisted — WARDEX
- 2023-08-20 Price Changed $84,900 WARDEX
- 2023-08-20 Price Changed $84,900 LHAR
- 2023-08-01 Delisted — WARDEX
- 2023-07-19 Listed $97,500 LHAR
- 2023-07-19 Listed $97,500 WARDEX
- 2020-07-20 Listed $89,900 WARDEX
- 2020-07-20 Listed $89,900 LHAR
- 2013-01-07 Listed $179,900 WARDEX
- 2007-10-05 Listing Removed — ARMLS
- 2007-09-05 Listed $223,000 ARMLS
Cash-flow waterfall
monthlySold comps — $/sqft
last 12 mo · ≤1 miLoading sold comps…