2110 N Forest Rd · University at Buffalo, NY
Flood risk 5/10 · Moderate
- FEMA flood zone
- AE
- Chance of flooding over 30 yrs
- 0.24%
- Est. flood insurance / yr
- $1,737 – $8,500
Fire risk 3/10 · Minor
- Est. fire insurance / yr
- $691 – $1,283
Heat risk 2/10 · Minimal
- Hot days now (above 94°F)
- 7 days/yr
- Hot days in 30 yrs
- 13 days/yr
Wind risk 1/10 · Minimal
- Chance of severe wind over 30 yrs
- —
Air-quality risk 3/10 · Minor
- Unhealthy air days now
- 2 days/yr
- Unhealthy air days in 30 yrs
- 3 days/yr
Risk factors via First Street. Map © Google.
Why this score? — see what drove the D+ grade
The composite is a weighted blend of 9 inputs, each scored 0–100. Each bar is that input's sub-score; the figure is the points it added to the 100-point composite (weight × sub-score).
- Cash flow +15.0/30.0
- ARV discount +7.5/15.0
- Schools +6.3/10.0
- 1% rule +5.0/10.0
- DSCR +5.0/10.0
- Livability +4.4/5.0
- Rent growth +3.8/5.0
- Condition / age +2.5/5.0
- Appreciation +0.0/10.0
$25,000
🖨 Deal sheet (PDF) 📄 Offer letter ✓ Due diligence
Listing remarks MLS
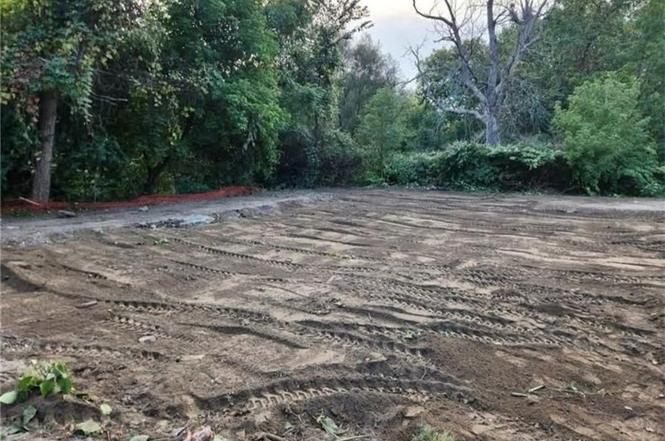
Beautiful lot with flowing creek in rear yard. There are some restrictions and additional approval processed needed due to it being designated both flood zone and in a floodway.
Key facts
- 0.94 acre lot
- Built 1920
- Listed 134 days
Neighborhood map
What this means for you Summary
Snapshot
- This is a 3-bed/1.0-bath land listed at $25k.
Deal economics
- At list price, monthly cash flow is $1k ($15k/yr) — positive.
- The deal already cash-flows at list — no discount required.
- Meets the 1% rule at list price ($2k rent vs $25k).
- Recommended offer: $22k (12.0% below list) — sets the bar for market timing.
- Cap rate 85.1% vs local median 2.8% in University at Buffalo — top-decile yield for the area; either an underpriced asset or a hidden risk that comps aren't pricing in. Stress-test before assuming the spread holds.
Location & tenants
- Location reads 88/100 on livability (#9 in NY, #176 nationally) — a professional / high-income tenant draw. Strengths: schools A+, amenities A+, commute A+; Watch: cost of living D+, employment F.
- Williamsville Central School District (suburban): math 64% / reading 77% proficiency, ranked #114 of 590 in NY (top 19%) — strong family-tenant draw, lease renewals of 3-5y typical; only 10% free/reduced lunch — higher-income household profile.
- Market conditions: Rents rising fast (+5.0%/yr); 329 active listings in the ZIP; 9 comparable units currently listed for rent nearby; rentals leasing fast (median 4d on market — plan ~1-2 weeks tenant-placement turnaround); solid renter incomes; 1,244 units permitted in Erie County in 2024 (563 in 5+ unit buildings).
Forward outlook
- Local home prices are declining (-3.0%/yr); year-one equity from $173 of loan paydown is wiped out by about $750 of value loss. Plan a longer hold.
- At projected returns (-3.0% appreciation + 5.0% rent growth), your $7k cash investment doubles in ~1 year — after that, you're playing with house money.
Negotiation context
- It's been on market 134 days — a 12% lower offer ($22k) is reasonable based on typical stale-listing flexibility.
- 5 sale attempts since 10y ago with the ask held roughly flat each time — persistent listings suggest the price (not the market) is what's stuck; bring a comps-based counter.
- Current owner paid $4k; list at $25k implies a 525% gain — meaningful room to come down on a strong offer.
Risks & watch-outs
- Watch-outs: flood insurance adds $427/mo; built in 1920 — expect roof / HVAC / electrical / plumbing capex.
- Climate carrying-cost: in FEMA flood zone AE (mandatory federal flood insurance) — expect insurance premiums to compound above CPI over the hold.
Questions for the listing agent
- It's been on market 134 days. Have you received any prior offers? Is the seller open to a 12% concession, seller financing, or rate buy-down credit?
- Built in 1920 — when were the roof, HVAC, electrical panel, plumbing, and water heater last replaced?
- What's the actual annual flood-insurance premium (NFIP or private), and is the property in a SFHA with mandatory coverage?
- Why hasn't it sold? Are there any deal-killer items the seller is aware of (foundation, flood, title, zoning, code violations)?
- Is there a deadline driving the sale (1031 exchange, divorce, estate, relocation)? That informs how much negotiation room exists.
- Schools are A-rated — typically a magnet for longer-tenancy family renters. What's the average tenant stay here, and is there a school-zone premium baked into asking?
- The area grade is low — what's the realistic commute time and amenity access for the typical tenant pool here? Any planned neighborhood developments (good or bad) we should know about?
- What's the average days-on-market for RENTAL listings here right now (not sales)? A rising rental-DOM trend means longer vacancies and softer asking-rent achievability than the comps imply.
- What's the recent tenant-quality profile in this submarket — average credit score on applications, eviction rate, late-payment / NSF rate, and stable-employment percentage? A property-management company in the area should have these aggregated.
- How much new for-sale + rental construction is in the pipeline within 1–3 miles? Heavy new supply typically softens prices + rents 12–24 months out; constrained supply supports both.
Investment metrics
- 1% rule
- 9.18% ✓
- Cap rate
- 85.06%
- Cash-on-cash
- 281.30%
- DSCR
- 13.52
- GRM
- 0.9
CMA / ARV
No comps found within radius.
Projected returns pro-forma
-3.0% appreciation · 5.01% rent growth · sell at horizon
- IRR
- —
- Equity multiple
- 12.19×
- Total profit
- $78,327
- Equity at exit
- $3,728
- IRR
- —
- Equity multiple
- 28.04×
- Total profit
- $189,255
- Equity at exit
- $2,162
Cash invested: $7,000 (down + closing). Projections, not guarantees.
Landlord ↔ Tenant lean methodology
- Overall (STATE)
- 15 Strongly Tenant-Friendly
- State New York
- 15 Strongly Tenant-Friendly · D+10
- County
- — inherits STATE
- City
- — inherits STATE
ZIP-level market 14221
- Rents YoY
- 5.0%
- Active inventory
- 329
- Price-to-rent
- 0.9×
Monthly cashflow live
- Estimated rent
- $2,296 high interval (Pro) →
- Mortgage (P&I)
- −$131
- Tax est. 1.5%
- −$31 /mo · $375/yr
- Insurance
- −$10
- Flood insurance flood zone
- −$427 /mo · $5,118/yr
- HOA
- −$0
- Vacancy / Maint / Mgmt
- −$482
- Net cashflow
- $1,214
Break-even live
Sensitivity live
| Price | -10% $1,232 | -5% $1,223 | +0% $1,214 | +5% $1,206 | +10% $1,197 |
|---|---|---|---|---|---|
| Rent | -10% $1,033 | -5% $1,124 | +0% $1,214 | +5% $1,305 | +10% $1,396 |
| Rate | -1.0pp $1,227 | -0.5pp $1,221 | base $1,214 | +0.5pp $1,208 | +1.0pp $1,201 |
UW: 25.0% down · 7.5% · 30yr · 1.5% tax · 5.0% vac · 8.0% maint · 8.0% mgmt
Financing live
Cash to close
- Down payment
- $6,250
- Closing costs
- $750
- Reserves months
- —
- Total cash needed
- —
Loan-product check · same deal, 3 products live
Conventional
25% down · 7.5% · 30yr
- Down + closing
- —
- Monthly P&I
- —
- Monthly cashflow
- —
- DSCR
- —
- Eligible?
- —
Personal DTI + credit; lowest rate.
DSCR
20% down · 8.5% · 30yr
- Down + closing
- —
- Monthly P&I
- —
- Monthly cashflow
- —
- DSCR
- —
- Eligible?
- —
No personal income docs; deal must DSCR.
Hard money
10% down · 12.0% · 12mo
- Down + closing
- —
- Monthly P&I
- —
- Monthly cashflow
- —
- DSCR
- —
- Eligible?
- —
Short-term bridge; refi at stabilization.
Rent comps 9 comps
| Address | Beds | Baths | Sqft | Rent | $/sqft | DOM | Units | Dist |
|---|---|---|---|---|---|---|---|---|
| 2546 N Forest Rd Getzville, NY | 3.0 | 3.0 | 2088 | $750 | $0.36 | 24d | 1 | 0.84mi |
| 2635 N Forest Rd Getzville, NY | 3.0 | 2.0 | 1340 | $2,395 | $1.79 | 11d | 1 | 0.96mi |
| 2635 N Forest Rd Unit Type D Getzville, NY | 3.0 | 2.0 | 1530 | $2,495 | $1.63 | 2d | 1 | 0.96mi |
| 2635 N Forest Rd Unit Type A Getzville, NY | 2.0 | 2.0 | 1140 | $2,199 | $1.93 | 2d | 1 | 0.96mi |
| 2675 Millersport Hwy Getzville, NY | 2.0–3.0 | 2.0 | 1210 | $2,130 | $1.76 | 3d | 9 | 0.96mi |
| 1325 N Forest Rd Buffalo, NY | 1.0–3.0 | 1.0 | 870 | $2,095 | $2.41 | 2d | 9 | 1.09mi |
| 2791 N Forest Rd Getzville, NY | 3.0 | 1.0 | 1160 | $2,400 | $2.07 | 3d | 1 | 1.24mi |
| 1525 Amherst Manor Dr Buffalo, NY | 2.0 | 2.0 | 1080 | $1,495 | $1.38 | 2d | 5 | 1.31mi |
| 990 Hopkins Rd Unit G Buffalo, NY | 2.0 | 2.0 | 1100 | $2,200 | $2.00 | 11d | 1 | 1.39mi |
Listing history 15 events
-
2026-04-16status Pending
-
2025-12-03$25,000 Active
-
2025-11-21historical
-
2025-10-23status Active
-
2025-08-22status Pending
-
2025-06-02price $29,999
-
2025-05-15price $150,000
-
2025-04-21$199,999 Active
-
2025-03-21soldstatus $4,000 Closed 177-char remark
Show marketing remark (177 chars)
Beautiful lot with flowing creek in rear yard. There are some restrictions and additional approval processed needed due to it being designated both flood zone and in a floodway.
-
2025-02-11status Pending 177-char remark
Show marketing remark (177 chars)
Beautiful lot with flowing creek in rear yard. There are some restrictions and additional approval processed needed due to it being designated both flood zone and in a floodway.
-
2025-01-29price $4,900 177-char remark
Show marketing remark (177 chars)
Beautiful lot with flowing creek in rear yard. There are some restrictions and additional approval processed needed due to it being designated both flood zone and in a floodway.
-
2024-11-11$8,400 Active 177-char remark
Show marketing remark (177 chars)
Beautiful lot with flowing creek in rear yard. There are some restrictions and additional approval processed needed due to it being designated both flood zone and in a floodway.
-
2017-02-10historical
-
2016-12-20status Pending Sale
-
2016-10-21$92,900 Active
ⓘ Source: listings_history table (triggers on properties + properties_extension) + one-shot
backfill from property_details.listing_events for pre-trigger history.
Climate risk First Street
- Flood 5/10 Major FEMA zone AE · 24% chance over 30 yrs
- Wildfire 3/10 Moderate
- Heat 2/10 Low 7 d/yr ≥94°F today · 13 d/yr by 30 yrs out
- Wind 1/10 Low
- Air quality 3/10 Moderate 2 unhealthy d/yr today · 3 by 30 yrs out
Nearby sold comps map
Loading sold comps map…
Walkable amenities ~0.75 mi
Loading nearby amenities…
Taxation est. · year 1
- Rental income
- $27,550
- − Mortgage interest
- −$1,400
- − Property taxes
- −$375
- − Insurance
- −$5,244
- − Repairs & maintenance
- −$2,204
- − Management
- −$2,204
- − Depreciation
- −$727
- Taxable income
- $15,396
- Est. tax owed @ 24.0%
- −$3,695
- After-tax cash flow
- $10,878/yr
For passive investors: Depreciation is non-cash, so a rental often shows a tax loss while cash-flowing — sheltering income. Rental losses are passive: they offset passive income freely, and up to $25,000/yr can offset ordinary (W-2) income if you actively participate and your MAGI is under $100k (phasing out to $0 by $150k); unused losses carry forward. On sale, claimed depreciation is recaptured at up to 25%, and gains may owe capital-gains tax (a 1031 exchange can defer both). Figures are a year-1 estimate at your 24.0% rate — not tax advice; consult a CPA.
Schools (NCES district)
- District
- Williamsville Central School District
- NCES district ID
- 3631470
- Math proficiency
- 64% ▼ -14.00%
- Reading proficiency
- 77% ▲ 6.00%
- Median HH income
- $79,907
- Composite
- 62.59/100
- National rank
- #678
- State rank
- #114 of 590 in NY
Livability — University at Buffalo
- Score
- 88/100
- State rank
- #9
- US rank
- #176
Category grades
Schools grade is shown separately in the Schools card above.
Census & demographics
- County
- Erie County · 714,559 people
- City population
- 5,827
- Metro
- Buffalo-Cheektowaga, NY
- Population (ZIP)
- 55,255
- Household income
- $101,615
- Rent vs Own
- Severe rent burden
- 1956.0
Population outlook (Erie County) Hauer SSP2
- Today (2025)
- 933,037 people
- By 2030
- 935,181 · +0.2%
- By 2040
- 928,531 · -0.5%
- By 2050
- 905,725 · -2.9%
- By 2075
- 834,037 · -10.6%
- By 2100
- 708,033 · -24.1%
Race, ethnicity, and origin ACS 2023
- Neighborhood character
- Predominantly White (84%)
- Race & ethnicity
- White 84% Asian 8% Two or more races 4% Hispanic / Latino 3% Black 2%
- Common ancestry
- Romanian 15% Lithuanian 2% Slovak 2%
- Foreign-born
- 10% · Canada, China, South Korea
- Languages at home
- 88% English-only · Other Indo-European 3% Other Asian/Pacific 2% Spanish 2%
Political lean MEDSL · Erie
- 2024 margin
- Lean D (+9.7) · D 54.8% · R 45.2%
- 2008→2024 swing
- -7.9pp toward R · 2008: 17.5pp · 2024: 9.7pp
- All cycles
- 2024: D+9.7 2020: D+14.7 2016: D+4.8 2012: D+15.6 2008: D+17.5
Not yet ingested
- Civics
- —
Market trends
- HPI YoY
- ▼ -301.37%
- Current HPI
- 322.6947
- Rent YoY
- ▲ 5.01%
- Metro
- Buffalo-Cheektowaga, NY
- State GDP YoY
- ▲ 2.60%
- F500 in state
- 92
Industry mix (Fortune 500 HQ in NY)
| Industry | F500 HQs | Revenue |
|---|---|---|
| Financial Services | 10 | $950B |
|
||
| Consumer Goods | 9 | $162B |
|
||
| Insurance | 4 | $225B |
|
||
| Telecommunications | 2 | $144B |
|
||
| Pharmaceuticals | 2 | $112B |
|
||
| Media / Entertainment | 2 | $69B |
|
||
Price history
-73.1% since first listed15 events — show timeline
- 2026-04-16 Pending — WNYREIS
- 2025-12-03 Listed $25,000 WNYREIS
- 2025-11-21 Listing Removed — WNYREIS
- 2025-10-23 Relisted — WNYREIS
- 2025-08-22 Pending — WNYREIS
- 2025-06-02 Price Changed $29,999 WNYREIS
- 2025-05-15 Price Changed $150,000 WNYREIS
- 2025-04-21 Listed $199,999 WNYREIS
- 2025-03-21 Sold (MLS) $4,000 UNYREIS
- 2025-02-11 Pending — UNYREIS
- 2025-01-29 Price Changed $4,900 UNYREIS
- 2024-11-11 Listed $8,400 UNYREIS
- 2017-02-10 Listing Removed — WNYREIS
- 2016-12-20 Pending — WNYREIS
- 2016-10-21 Listed $92,900 WNYREIS
Property tax history
-4.8%/yrLatest (2025): $2,396 · -34.2% YoY. Source: county tax records.
Cash-flow waterfall
monthlySold comps — $/sqft
last 12 mo · ≤1 miLoading sold comps…