200 NW Oregon Ave · Irrigon, OR
Flood risk 1/10 · Minimal
- FEMA flood zone
- X (unshaded)
- Chance of flooding over 30 yrs
- 0.0%
- Est. flood insurance / yr
- $507 – $1,088
Fire risk 5/10 · Moderate
- Est. fire insurance / yr
- $498 – $926
Heat risk 5/10 · Moderate
- Hot days now (above 98°F)
- 6 days/yr
- Hot days in 30 yrs
- 13 days/yr
Wind risk 1/10 · Minimal
- Chance of severe wind over 30 yrs
- —
Air-quality risk 8/10 · Major
- Unhealthy air days now
- 12 days/yr
- Unhealthy air days in 30 yrs
- 14 days/yr
Risk factors via First Street. Map © Google.
Why this score? — see what drove the D grade
The composite is a weighted blend of 9 inputs, each scored 0–100. Each bar is that input's sub-score; the figure is the points it added to the 100-point composite (weight × sub-score).
- Cash flow +10.9/30.0
- ARV discount +7.5/15.0
- Appreciation +6.7/10.0
- DSCR +3.2/10.0
- Livability +3.2/5.0
- Rent growth +2.5/5.0
- Condition / age +2.5/5.0
- Schools +2.3/10.0
- 1% rule +2.0/10.0
$120,000
🖨 Deal sheet 📄 Offer letter ✓ Due diligence
Listing remarks MLS
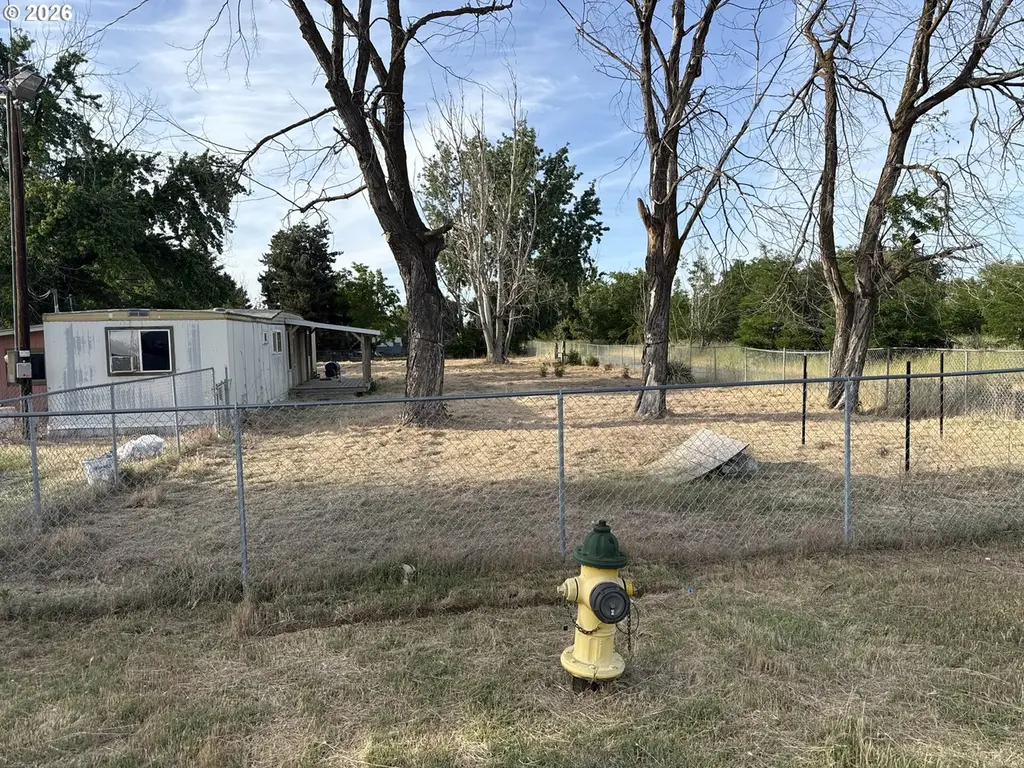
HUGE Lot with room to run and play... Large shade trees... Water rights! This home has new floor coverings within the last year...Fruit trees including apple peach and pear... WOW.. what a deal!
Key facts
- Fully fenced
- Half acre property
- Water rights
Tags
Property features AI
Finance
- HOA & community: Not a senior community; Zoning: R1
Exterior
- Utilities: Public water; Public sewer and septic tank; Electric service
- Home design: Manufactured home on real property; Residential property; Single-story (main living on one level); Built in 1970; No notable view
- Construction: Built in 1970
- Exterior features: Aluminum exterior; Corner lot
Interior
- Kitchen: Free-standing range; Free-standing refrigerator
- Bedrooms: Primary bedroom (main level); Second bedroom (main level)
- Bathrooms: 1 full bathroom (main level)
- Heating & cooling: Forced air heating; Wall unit cooling; Electric hot water
- Interior features: Family room; Great room; Dining room; Living room
Neighborhood map
What this means for you Summary
Snapshot
- This is a 2-bed/1.0-bath manufactured listed at $120k.
Deal economics
- At list price, monthly cash flow is $-52 ($-623/yr) — negative.
- To cash-flow at today's rent, offer at most $111k (7.6% below list).
- To meet the 1% rule (rent ≥ 1% of price), the offer needs to be $84k (29.6% below list).
- Recommended offer: $84k (29.6% below list) — sets the bar for 1% rule.
Location & tenants
- Location reads 63/100 on livability (#232 in OR) — a middle-class / working-renter tenant base. Strengths: cost of living A+, housing A+, crime A-; Watch: employment D, amenities F, commute F.
- Morrow SD 1 (town): math 15% / reading 39% proficiency, ranked #49 of 58 in OR (top 84%) — low school quality limits family demand, transient renter base, plan for 1-2y turnover; 60% free/reduced lunch — lower-income household profile, screen leases tightly.
- Zoned schools: A C Houghton Elementary School (reading 17%, 223 students, 67% FRL); Irrigon Elementary School (math 22% / reading 52%, grade F, #50 of 128 statewide, top 41%, 196 students, 69% FRL); Irrigon Junior/Senior High School (math 8% / reading 37%, grade F, #129 of 143 statewide, top 90%, 366 students, 68% FRL).
- Market conditions: 32 active listings in the ZIP; 57 units permitted in Morrow County in 2024 (0 in 5+ unit buildings).
Forward outlook
- In year one you build about $5k of equity ($830 loan paydown + $4k appreciation (3.3% local appreciation)).
- At projected returns (3.3% appreciation + 3.0% rent growth), your $34k cash investment doubles in ~7 years — after that, you're playing with house money.
- By year 7, paydown + projected appreciation supports a ~$30k cash-out refi (75% LTV) — recoverable capital for the next deal without selling this one.
Negotiation context
- Only 5 days on market — expect competitive offers; lowballing is unlikely to land.
- 2 sale attempts since 18y ago with the ask held roughly flat each time — persistent listings suggest the price (not the market) is what's stuck; bring a comps-based counter.
Risks & watch-outs
- Climate carrying-cost: moderate wildfire risk; extreme-heat days projected 6→13/yr by 2055 (HVAC capex compounding) — expect insurance premiums to compound above CPI over the hold.
Questions for the listing agent
- What do current leases actually rent for vs. the listed asking? Can we see a recent rent roll and the last 12 months of T-12 income?
- Built in 1970 — when were the roof, HVAC, electrical panel, plumbing, and water heater last replaced?
- Is there a deadline driving the sale (1031 exchange, divorce, estate, relocation)? That informs how much negotiation room exists.
- Schools are F-rated, which usually means shorter tenancies and higher turnover. Who's the typical renter profile here, and what's been the actual vacancy rate?
- The area grade is low — what's the realistic commute time and amenity access for the typical tenant pool here? Any planned neighborhood developments (good or bad) we should know about?
- What's the average days-on-market for RENTAL listings here right now (not sales)? A rising rental-DOM trend means longer vacancies and softer asking-rent achievability than the comps imply.
- What's the recent tenant-quality profile in this submarket — average credit score on applications, eviction rate, late-payment / NSF rate, and stable-employment percentage? A property-management company in the area should have these aggregated.
- How much new for-sale + rental construction is in the pipeline within 1–3 miles? Heavy new supply typically softens prices + rents 12–24 months out; constrained supply supports both.
Investment metrics
- 1% rule
- 0.70% ✗
- Cap rate
- 5.77%
- Cash-on-cash
- -1.85%
- DSCR
- 0.92
- GRM
- 11.8
CMA / ARV
No comps found within radius.
Projected returns pro-forma
3.32% appreciation · 3.0% rent growth · sell at horizon
- IRR
- 6.7%
- Equity multiple
- 1.39×
- Total profit
- $13,154
- Equity at exit
- $56,149
- IRR
- 9.3%
- Equity multiple
- 2.45×
- Total profit
- $48,884
- Equity at exit
- $88,276
Cash invested: $33,600 (down + closing). Projections, not guarantees.
Landlord ↔ Tenant lean methodology
- Overall (STATE)
- 28 Tenant-Leaning
- State Oregon
- 28 Tenant-Leaning · D+6
- County
- — inherits STATE
- City
- — inherits STATE
ZIP-level market 97844
- Home prices YoY
- 1.3%
- Active inventory
- 32
- Price-to-rent
- 11.8×
Monthly cashflow live
- Estimated rent
- $845 medium interval (Pro) →
- Mortgage (P&I)
- −$629
- Tax from tax record
- −$40 /mo · $478/yr
- Insurance
- −$50
- HOA
- −$0
- Vacancy / Maint / Mgmt
- −$177
- Net cashflow
- $-52
Break-even live
UW: 25.0% down · 7.5% · 30yr · 1.5% tax · 5.0% vac · 8.0% maint · 8.0% mgmt
Financing live
Cash to close
- Down payment
- $30,000
- Closing costs
- $3,600
- Reserves months
- —
- Total cash needed
- —
Loan-product check · same deal, 3 products live
Conventional
25% down · 7.5% · 30yr
- Down + closing
- —
- Monthly P&I
- —
- Monthly cashflow
- —
- DSCR
- —
- Eligible?
- —
Personal DTI + credit; lowest rate.
DSCR
20% down · 8.5% · 30yr
- Down + closing
- —
- Monthly P&I
- —
- Monthly cashflow
- —
- DSCR
- —
- Eligible?
- —
No personal income docs; deal must DSCR.
Hard money
10% down · 12.0% · 12mo
- Down + closing
- —
- Monthly P&I
- —
- Monthly cashflow
- —
- DSCR
- —
- Eligible?
- —
Short-term bridge; refi at stabilization.
Listing history 9 events
-
2026-05-31status $120,000 Pending 5 DOM
-
2026-05-30days on market $120,000 Active 5 DOM
-
2026-05-25$120,000 Active
-
2021-10-08soldstatus $105,000
-
2021-09-24soldstatus $80,000
-
2016-05-09soldstatus $50,950
-
2009-05-01soldstatus $27,500 195-char remark
Show marketing remark (195 chars)
HUGE Lot with room to run and play... Large shade trees... Water rights! This home has new floor coverings within the last year...Fruit trees including apple peach and pear... WOW.. what a deal!
-
2009-04-13historical 195-char remark
Show marketing remark (195 chars)
HUGE Lot with room to run and play... Large shade trees... Water rights! This home has new floor coverings within the last year...Fruit trees including apple peach and pear... WOW.. what a deal!
-
2008-09-09$35,000 195-char remark
Show marketing remark (195 chars)
HUGE Lot with room to run and play... Large shade trees... Water rights! This home has new floor coverings within the last year...Fruit trees including apple peach and pear... WOW.. what a deal!
ⓘ Source: listings_history table (triggers on properties + properties_extension) + one-shot
backfill from property_details.listing_events for pre-trigger history.
Tax reassessment forecast OR · Resets to sale price
- Current annual tax
- $478 · $40/mo
- Projected year-2 tax
- $1,164 · $97/mo
- Expected delta
- +$686/yr (+$57/mo · 143.6%)
ⓘ Screening estimate from a state-policy table — verify with the county assessor before closing.
Climate risk First Street
- Flood 1/10 Low FEMA zone X (unshaded) · 0% chance over 30 yrs
- Wildfire 5/10 Major
- Heat 5/10 Major 6 d/yr ≥98°F today · 13 d/yr by 30 yrs out
- Wind 1/10 Low
- Air quality 8/10 Severe 12 unhealthy d/yr today · 14 by 30 yrs out
Nearby sold comps map
Loading sold comps map…
Walkable amenities ~0.75 mi
Loading nearby amenities…
Taxation est. · year 1
- Rental income
- $10,134
- − Mortgage interest
- −$6,722
- − Property taxes
- −$478
- − Insurance
- −$600
- − Repairs & maintenance
- −$811
- − Management
- −$811
- − Depreciation
- −$3,491
- Taxable loss
- −$2,778
- Est. tax savings @ 24.0%
- +$667
- After-tax cash flow
- $44/yr
For passive investors: Depreciation is non-cash, so a rental often shows a tax loss while cash-flowing — sheltering income. Rental losses are passive: they offset passive income freely, and up to $25,000/yr can offset ordinary (W-2) income if you actively participate and your MAGI is under $100k (phasing out to $0 by $150k); unused losses carry forward. On sale, claimed depreciation is recaptured at up to 25%, and gains may owe capital-gains tax (a 1031 exchange can defer both). Figures are a year-1 estimate at your 24.0% rate — not tax advice; consult a CPA.
Schools (NCES district)
- District
- Morrow SD 1
- NCES district ID
- 4108520
- Math proficiency
- 15% ▼ -13.00%
- Reading proficiency
- 39% ▼ -3.00%
- Median HH income
- $48,315
- Composite
- 23.46/100
- National rank
- #7881
- State rank
- #49 of 58 in OR
Livability — Irrigon
- Score
- 63/100
- State rank
- #232
- US rank
- #15676
Category grades
Schools grade is shown separately in the Schools card above.
Census & demographics
- Census place
- Irrigon, OR
- Population (ZIP)
- 3,569
Population outlook (Morrow County) Hauer SSP2
- Today (2025)
- 11,011 people
- By 2030
- 10,944 · -0.6%
- By 2040
- 10,946 · -0.6%
- By 2050
- 11,054 · +0.4%
- By 2075
- 11,568 · +5.1%
- By 2100
- 11,688 · +6.1%
Race, ethnicity, and origin ACS 2023
- Neighborhood character
- Predominantly White (65%)
- Race & ethnicity
- White 65% Hispanic / Latino 31% Two or more races 13% Black 1%
- Hispanic origin (detail)
- Mexican 30%
- Common ancestry
- Slovak 3% Iranian 2% Scottish 1%
- Foreign-born
- 10% · Canada
- Languages at home
- 76% English-only · Spanish 24%
Political lean MEDSL · Morrow
- 2024 margin
- Solid R (+48.4) · D 24.1% · R 72.5% · Other 3.4%
- 2008→2024 swing
- -21.3pp toward R · 2008: -27.1pp · 2024: -48.4pp
- All cycles
- 2024: R+48.4 2020: R+43.3 2016: R+42.5 2012: R+34.8 2008: R+27.1
Not yet ingested
- Civics
- —
Market trends
- HPI YoY
- ▲ 3.32%
- Current HPI
- 257.1817
- Rent YoY
- —
- Metro
- —
- State GDP YoY
- ▲ 2.05%
- F500 in state
- 2
Industry mix (Fortune 500 HQ in OR)
| Industry | F500 HQs | Revenue |
|---|---|---|
| Consumer Goods | 1 | $51B |
|
||
Price history
+242.9% since first listed7 events — show timeline
- 2026-05-25 Listed $120,000 RMLS
- 2021-10-08 Sold (Public Records) $105,000 Public Records
- 2021-09-24 Sold (Public Records) $80,000 Public Records
- 2016-05-09 Sold (Public Records) $50,950 Public Records
- 2009-05-01 Sold (MLS) $27,500 RMLS
- 2009-04-13 Delisted — RMLS
- 2008-09-09 Listed $35,000 RMLS
Property tax history
+3.0%/yrLatest (2025): $478 · +18.8% YoY. Source: county tax records.
Cash-flow waterfall
monthlySold comps — $/sqft
last 12 mo · ≤1 miLoading sold comps…