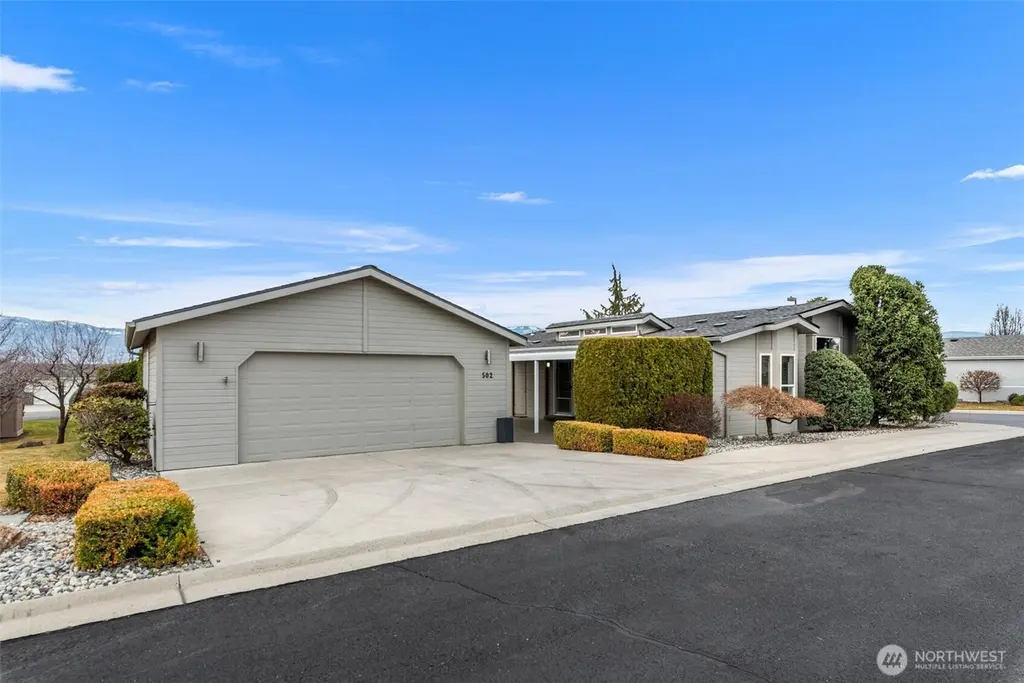
502 Songbrook Dr · East Wenatchee, WA
Flood risk 1/10 · Minimal
- FEMA flood zone
- X (shaded)
- Chance of flooding over 30 yrs
- 0.0%
- Est. flood insurance / yr
- $507 – $1,088
Fire risk 6/10 · Moderate
- Est. fire insurance / yr
- $604 – $1,122
Heat risk 4/10 · Minor
- Hot days now (above 96°F)
- 7 days/yr
- Hot days in 30 yrs
- 14 days/yr
Wind risk 1/10 · Minimal
- Chance of severe wind over 30 yrs
- —
Air-quality risk 10/10 · Severe
- Unhealthy air days now
- 21 days/yr
- Unhealthy air days in 30 yrs
- 22 days/yr
Risk factors via First Street. Map © Google.
Why this score? — see what drove the D+ grade
The composite is a weighted blend of 9 inputs, each scored 0–100. Each bar is that input's sub-score; the figure is the points it added to the 100-point composite (weight × sub-score).
- Cash flow +16.0/30.0
- ARV discount +8.9/15.0
- DSCR +4.9/10.0
- Schools +4.7/10.0
- Livability +4.2/5.0
- 1% rule +3.7/10.0
- Rent growth +2.9/5.0
- Condition / age +2.5/5.0
- Appreciation +0.0/10.0
$315,000
🖨 Deal sheet 📄 Offer letter ✓ Due diligence
Listing remarks
Welcome to this beautifully maintained 1,896 sq ft home located in a peaceful, gated community. The functional and easy layout is designed for comfortable living, featuring 3 spacious bedrooms and 2 bathrooms. Throughout the common areas, an abundance of windows invites natural light to fill the space, highlighting the newer flooring and fresh paint found throughout the interior. Significant recent updates provide long-term peace of mind, including a brand-new roof and new railings on both the front and back of the house. The outdoor space is equally inviting, with patio carpet replaced just last year and a wireless fence already in place for your dog. This residence offers the perfect blen
Key facts
- Gated community
- Wireless fence
- Patio carpet
Tags
Neighborhood map
What this means for you Summary
Snapshot
- This is a 3-bed/2.0-bath manufactured listed at $315k.
Deal economics
- At list price, monthly cash flow is $153 ($2k/yr) — positive.
- The deal already cash-flows at list — no discount required.
- To meet the 1% rule (rent ≥ 1% of price), the offer needs to be $273k (13.4% below list).
- Recommended offer: $273k (13.4% below list) — sets the bar for 1% rule.
- Cap rate 6.9% vs local median 2.9% in East Wenatchee — top-decile yield for the area; either an underpriced asset or a hidden risk that comps aren't pricing in. Stress-test before assuming the spread holds.
Location & tenants
- Location reads 83/100 on livability (#54 in WA, #972 nationally) — a professional / high-income tenant draw. Strengths: commute A+, housing A+, health & safety A+.
- Eastmont School District (suburban): math 45% / reading 60% proficiency, ranked #118 of 291 in WA (top 40%) — acceptable for families but not a draw, mixed tenant base, ~2y average lease.
- Market conditions: Rents rising (+1.5%/yr); 324 active listings in the ZIP; 4 comparable units currently listed for rent nearby; rentals lingering (median 44d on market — plan ~5-8 weeks vacancy on turnover, expect pricing pressure); 100% of comp listings sitting > 30 days — soft ceiling on asking rent; solid renter incomes; 263 units permitted in Douglas County in 2024 (0 in 5+ unit buildings).
- This rent runs 37% of the median local income ($88k/yr) — at the standard rent-burdened threshold; future hikes will face affordability resistance.
Forward outlook
- Local home prices are declining (-3.0%/yr); year-one equity from $2k of loan paydown is wiped out by about $9k of value loss. Plan a longer hold.
- Douglas County population projected at +22% by 2050 — long-run rental-demand tailwind backs the buy-and-hold thesis.
Negotiation context
- It's been on market 75 days — a 6% lower offer ($296k) is reasonable based on typical stale-listing flexibility.
- 3 sale attempts since 6y ago with the ask held roughly flat each time — persistent listings suggest the price (not the market) is what's stuck; bring a comps-based counter.
- Current owner paid $255k; 24% above their basis — modest negotiation headroom, anchor on the comps not their cost.
Risks & watch-outs
- Climate carrying-cost: major wildfire risk — expect insurance premiums to compound above CPI over the hold.
Questions for the listing agent
- It's been on market 75 days. Have you received any prior offers? Is the seller open to a 13% concession, seller financing, or rate buy-down credit?
- Why hasn't it sold? Are there any deal-killer items the seller is aware of (foundation, flood, title, zoning, code violations)?
- Is there a deadline driving the sale (1031 exchange, divorce, estate, relocation)? That informs how much negotiation room exists.
- The area grade is low — what's the realistic commute time and amenity access for the typical tenant pool here? Any planned neighborhood developments (good or bad) we should know about?
- What's the average days-on-market for RENTAL listings here right now (not sales)? A rising rental-DOM trend means longer vacancies and softer asking-rent achievability than the comps imply.
- What's the recent tenant-quality profile in this submarket — average credit score on applications, eviction rate, late-payment / NSF rate, and stable-employment percentage? A property-management company in the area should have these aggregated.
- How much new for-sale + rental construction is in the pipeline within 1–3 miles? Heavy new supply typically softens prices + rents 12–24 months out; constrained supply supports both.
Investment metrics
- 1% rule
- 0.87% ✗
- Cap rate
- 6.88%
- Cash-on-cash
- 2.08%
- DSCR
- 1.09
- GRM
- 9.6
CMA / ARV
- ARV (median comp)
- $325,000
- List price
- $315,000
- Delta
- -3.08%
- Verdict
- FAIR
- Comps
- 11 within 1.0 mi
Show comp detail 12 sales within ~0.75 mi
| Address | Dist | Beds/Ba | Sqft | Sold | Price | $/sf | Match |
|---|---|---|---|---|---|---|---|
| 528 Sunday Dr | 0.01mi | 3/2.0 | 1,920 (+1%) | 16mo | $315,000 | $164 | 84 |
| 513 Monterey Dr | 0.15mi | 3/2.0 | 1,842 (-3%) | 10mo | $272,000 | $148 | 79 |
| 576 Canyon Dr | 0.17mi | 3/2.0 | 2,008 (+6%) | 11mo | $345,000 | $172 | 73 |
| 508 Nahalee Dr | 0.19mi | 3/2.0 | 1,968 (+4%) | 14mo | $300,000 | $152 | 73 |
| 578 Canyon Dr | 0.18mi | 3/2.0 | 1,726 (-9%) | 8mo | $360,000 | $209 | 70 |
| 575 Canyon Dr #83 | 0.15mi | 3/2.0 | 1,611 (-15%) | 0mo | $292,500 | $182 | 68 |
| 580 Canyon Dr | 0.19mi | 2/2.0 (-1) | 2,016 (+6%) | 10mo | $336,500 | $167 | 68 |
| 562 Canyon Dr #58 | 0.15mi | 2/2.0 (-1) | 2,056 (+8%) | 10mo | $360,000 | $175 | 66 |
| 584 Canyon Dr | 0.21mi | 3/2.5 | 2,156 (+14%) | 1mo | $325,000 | $151 | 65 |
| 518 Country Ln | 0.13mi | 3/2.0 | 2,149 (+13%) | 12mo | $340,000 | $158 | 61 |
| 507 Nahalee Dr | 0.18mi | 2/2.0 (-1) | 1,680 (-11%) | 12mo | $225,000 | $134 | 58 |
| 523 Newport Plz | 0.38mi | 4/3.0 (+1) | 1,762 (-7%) | 20mo | $388,000 | $220 | 45 |
Match score weights: distance 35% · size 25% · config 20% · recency 20%. Top-matched comps best support the ARV.
Projected returns pro-forma
-3.0% appreciation · 1.47% rent growth · sell at horizon
- IRR
- -14.6%
- Equity multiple
- 0.48×
- Total profit
- $-45,512
- Equity at exit
- $46,968
- IRR
- -8.5%
- Equity multiple
- 0.50×
- Total profit
- $-43,824
- Equity at exit
- $27,235
Cash invested: $88,200 (down + closing). Projections, not guarantees.
Landlord ↔ Tenant lean methodology
- Overall (STATE)
- 28 Tenant-Leaning
- State Washington
- 28 Tenant-Leaning · D+8
- County
- — inherits STATE
- City
- — inherits STATE
ZIP-level market 98802
- Rents YoY
- 1.5%
- Active inventory
- 324
- Price-to-rent
- 9.6×
Monthly cashflow live
- Estimated rent
- $2,728 medium interval (Pro) →
- Mortgage (P&I)
- −$1,652
- Tax from tax record
- −$219 /mo · $2,628/yr
- Insurance
- −$131
- HOA
- −$0
- Vacancy / Maint / Mgmt
- −$573
- Net cashflow
- $153
Break-even live
UW: 25.0% down · 7.5% · 30yr · 1.5% tax · 5.0% vac · 8.0% maint · 8.0% mgmt
Financing live
Cash to close
- Down payment
- $78,750
- Closing costs
- $9,450
- Reserves months
- —
- Total cash needed
- —
Loan-product check · same deal, 3 products live
Conventional
25% down · 7.5% · 30yr
- Down + closing
- —
- Monthly P&I
- —
- Monthly cashflow
- —
- DSCR
- —
- Eligible?
- —
Personal DTI + credit; lowest rate.
DSCR
20% down · 8.5% · 30yr
- Down + closing
- —
- Monthly P&I
- —
- Monthly cashflow
- —
- DSCR
- —
- Eligible?
- —
No personal income docs; deal must DSCR.
Hard money
10% down · 12.0% · 12mo
- Down + closing
- —
- Monthly P&I
- —
- Monthly cashflow
- —
- DSCR
- —
- Eligible?
- —
Short-term bridge; refi at stabilization.
Rent comps 4 comps
| Address | Beds | Baths | Sqft | Rent | $/sqft | DOM | Units | Dist |
|---|---|---|---|---|---|---|---|---|
| 2525 NE Noble Loop East Wenatchee, WA | 3.0 | 2.0 | 1350 | $2,795 | $2.07 | 43d | 1 | 0.49mi |
| 2272 S Nevada Ave East Wenatchee, WA | 2.0–3.0 | 2.0 | 1175 | $2,300 | $1.96 | 43d | 3 | 0.62mi |
| 1763 Grant Rd East Wenatchee, WA | 3.0 | 2.5 | 1500 | $2,795 | $1.86 | 43d | 1 | 0.74mi |
| 286 N Iowa Ave East Wenatchee, WA | 3.0 | 1.0 | 1264 | $2,600 | $2.06 | 43d | 1 | 1.14mi |
Listing history 8 events
-
2026-05-06price $315,000
-
2026-03-06$325,000 Active
-
2021-03-26soldstatus $255,000 Sold
-
2021-01-07status Pending
-
2020-11-18status Active
-
2020-10-09status Pending
-
2020-07-10$269,000 Active
-
2002-07-10soldstatus $151,000
ⓘ Source: listings_history table (triggers on properties + properties_extension) + one-shot
backfill from property_details.listing_events for pre-trigger history.
Tax reassessment forecast WA · Resets to sale price
- Current annual tax
- $2,628 · $219/mo
- Projected year-2 tax
- $3,087 · $257/mo
- Expected delta
- +$459/yr (+$38/mo · 17.5%)
ⓘ Screening estimate from a state-policy table — verify with the county assessor before closing.
Climate risk First Street
- Flood 1/10 Low FEMA zone X (shaded) · 0% chance over 30 yrs
- Wildfire 6/10 Major
- Heat 4/10 Moderate 7 d/yr ≥96°F today · 14 d/yr by 30 yrs out
- Wind 1/10 Low
- Air quality 10/10 Extreme 21 unhealthy d/yr today · 22 by 30 yrs out
Nearby sold comps map
Loading sold comps map…
Walkable amenities ~0.75 mi
Loading nearby amenities…
Taxation est. · year 1
- Rental income
- $32,734
- − Mortgage interest
- −$17,645
- − Property taxes
- −$2,628
- − Insurance
- −$1,575
- − Repairs & maintenance
- −$2,619
- − Management
- −$2,619
- − Depreciation
- −$9,164
- Taxable loss
- −$3,515
- Est. tax savings @ 24.0%
- +$844
- After-tax cash flow
- $2,678/yr
For passive investors: Depreciation is non-cash, so a rental often shows a tax loss while cash-flowing — sheltering income. Rental losses are passive: they offset passive income freely, and up to $25,000/yr can offset ordinary (W-2) income if you actively participate and your MAGI is under $100k (phasing out to $0 by $150k); unused losses carry forward. On sale, claimed depreciation is recaptured at up to 25%, and gains may owe capital-gains tax (a 1031 exchange can defer both). Figures are a year-1 estimate at your 24.0% rate — not tax advice; consult a CPA.
Schools (NCES district)
- District
- Eastmont School District
- NCES district ID
- 5302310
- Math proficiency
- 45% ▬ 0.00%
- Reading proficiency
- 60% ▲ 1.00%
- Median HH income
- $56,015
- Composite
- 47.31/100
- National rank
- #5047
- State rank
- #118 of 291 in WA
Livability — East Wenatchee
- Score
- 83/100
- State rank
- #54
- US rank
- #972
Category grades
Schools grade is shown separately in the Schools card above.
Census & demographics
- County
- Douglas County · 33,539 people
- City population
- 33,539
- Metro
- Wenatchee, WA
- Population (ZIP)
- 33,539
- Household income
- $87,744
- Rent vs Own
- Severe rent burden
- 741.0
Population outlook (Douglas County) Hauer SSP2
- Today (2025)
- 45,264 people
- By 2030
- 47,398 · +4.7%
- By 2040
- 51,407 · +13.6%
- By 2050
- 55,020 · +21.6%
- By 2075
- 63,862 · +41.1%
- By 2100
- 69,870 · +54.4%
Race, ethnicity, and origin ACS 2023
- Neighborhood character
- Majority White (63%)
- Race & ethnicity
- White 63% Hispanic / Latino 30% Two or more races 10% Asian 1%
- Hispanic origin (detail)
- Mexican 29%
- Common ancestry
- Lithuanian 3% Portuguese 3% Slovak 2%
- Foreign-born
- 14% · Canada
- Languages at home
- 76% English-only · Spanish 23% Other Indo-European 1%
Political lean MEDSL · Douglas
- 2024 margin
- Strong R (+27.0) · D 35.2% · R 62.1% · Other 2.7%
- 2008→2024 swing
- -5.6pp toward R · 2008: -21.4pp · 2024: -27.0pp
- All cycles
- 2024: R+27.0 2020: R+24.1 2016: R+31.5 2012: R+28.9 2008: R+21.4
Not yet ingested
- Civics
- —
Market trends
- HPI YoY
- ▼ -570.14%
- Current HPI
- 305.0094
- Rent YoY
- ▲ 1.47%
- Metro
- Wenatchee, WA
- State GDP YoY
- ▲ 4.65%
- F500 in state
- 22
Industry mix (Fortune 500 HQ in WA)
| Industry | F500 HQs | Revenue |
|---|---|---|
| Retail | 2 | $269B |
|
||
| Technology / Retail | 1 | $638B |
|
||
| Technology | 1 | $245B |
|
||
| Telecommunications | 1 | $38B |
|
||
| Food / Beverage | 1 | $36B |
|
||
| Automotive / Trucks | 1 | $34B |
|
||
Price history
+108.6% since first listed8 events — show timeline
- 2026-05-06 Price Changed $315,000 NWMLS as Distributed by MLS Grid
- 2026-03-06 Listed $325,000 NWMLS as Distributed by MLS Grid
- 2021-03-26 Sold (MLS) $255,000 NWMLS as Distributed by MLS Grid
- 2021-01-07 Pending — NWMLS as Distributed by MLS Grid
- 2020-11-18 Relisted — NWMLS as Distributed by MLS Grid
- 2020-10-09 Pending — NWMLS as Distributed by MLS Grid
- 2020-07-10 Listed $269,000 NWMLS as Distributed by MLS Grid
- 2002-07-10 Sold (Public Records) $151,000 Public Records
Property tax history
+4.6%/yrLatest (2026): $2,628 · +5.7% YoY. Source: county tax records.
Cash-flow waterfall
monthlySold comps — $/sqft
last 12 mo · ≤1 miLoading sold comps…