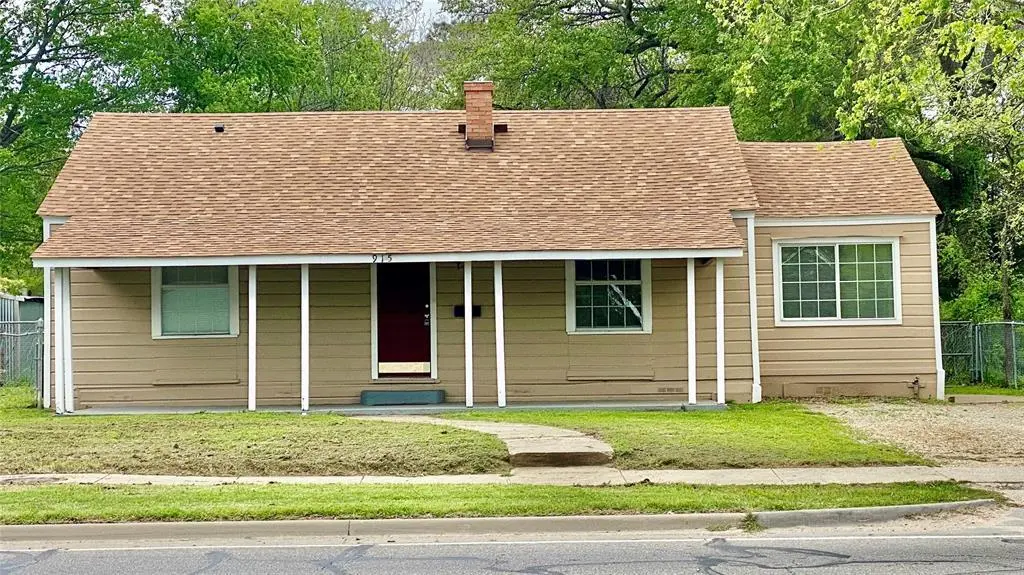
915 N Virginia St · Terrell, TX
Flood risk 1/10 · Minimal
- FEMA flood zone
- X (unshaded)
- Chance of flooding over 30 yrs
- 0.0%
- Est. flood insurance / yr
- $507 – $1,088
Fire risk 6/10 · Moderate
- Est. fire insurance / yr
- $1,222 – $2,270
Heat risk 7/10 · Major
- Hot days now (above 109°F)
- 7 days/yr
- Hot days in 30 yrs
- 22 days/yr
Wind risk 6/10 · Moderate
- Chance of severe wind over 30 yrs
- 27.0%
Air-quality risk 2/10 · Minimal
- Unhealthy air days now
- 1 days/yr
- Unhealthy air days in 30 yrs
- 1 days/yr
Risk factors via First Street. Map © Google.
Why this score? — see what drove the D grade
The composite is a weighted blend of 9 inputs, each scored 0–100. Each bar is that input's sub-score; the figure is the points it added to the 100-point composite (weight × sub-score).
- Cash flow +11.8/30.0
- ARV discount +9.6/15.0
- 1% rule +4.8/10.0
- DSCR +3.5/10.0
- Livability +3.4/5.0
- Rent growth +2.5/5.0
- Condition / age +2.5/5.0
- Schools +2.4/10.0
- Appreciation +0.0/10.0
$217,900
🖨 Deal sheet 📄 Offer letter ✓ Due diligence
Listing remarks MLS
Small town living. Great investment on a tree-lined street in Terrell near schools, churches and shopping. Very nice full length covered porch on the front and huge back yard. Hardwoods throughout and under existing carpet in some rooms. Woodburning fireplace. Knotty pine walls. This home has lots of character and good bones
Key facts
- Huge walk-in closets
- Beautiful kitchen
- White cabinets
Tags
Property features AI
Finance
- Financial info: Listing accepts Cash, Conventional and FHA financing
- HOA & community: No association
Exterior
- Parking: Two-car carport; Asphalt parking; RV access/parking; No enclosed garage
- Security: Smoke detector(s)
- Utilities: City water; City sewer; Concrete (utility or driveway indicated); Not in a municipal utility district
- Home design: Single family residence (attached); One story; Built in 1961
- Construction: Wood construction; Composition roof; Pillar/post/pier foundation
- Exterior features: Covered porch(es); Chain link fencing; Few trees; Landscaped yard; Large backyard with grass; Interior lot within a subdivision
Interior
- Kitchen: Corian or Corian-type countertops; Eat-in kitchen with pantry; Dishwasher; Electric cooktop; Electric oven
- Bedrooms: Four bedrooms (all on the main level); Primary bedroom with built-in cabinets, separate shower and sitting area; Additional bedrooms include split-bedroom layouts and walk-in closet(s)
- Flooring: Carpet; Luxury vinyl plank; Tile
- Bathrooms: Two full bathrooms
- Heating & cooling: Central heating; Central air conditioning
- Interior features: Built-in features; Cable TV available; Decorative lighting; Eat-in kitchen; Walk-in closets; Two living areas; One dining area; Nine total rooms; One level; Decorative fireplace
- Laundry & utility: Separate utility room with built-in cabinets
Neighborhood map
What this means for you Summary
Snapshot
- This is a 4-bed/1.0-bath single-family listed at $218k.
Deal economics
- At list price, monthly cash flow is $-60 ($-725/yr) — negative.
- To cash-flow at today's rent, offer at most $207k (4.9% below list).
- To meet the 1% rule (rent ≥ 1% of price), the offer needs to be $213k (2.0% below list).
- Recommended offer: $207k (4.9% below list) — sets the bar for cash-flow.
- Cap rate 6.0% vs local median 3.8% in Terrell — top-decile yield for the area; either an underpriced asset or a hidden risk that comps aren't pricing in. Stress-test before assuming the spread holds.
Location & tenants
- Location reads 67/100 on livability (#520 in TX) — a middle-class / working-renter tenant base. Strengths: cost of living A+, housing A+; Watch: amenities C-, employment D, commute F.
- Terrell ISD (town): math 25% / reading 30% proficiency, ranked #677 of 826 in TX (top 82%) — low school quality limits family demand, transient renter base, plan for 1-2y turnover; 68% free/reduced lunch — lower-income household profile, screen leases tightly.
- Zoned schools: J W Long El (math 16% / reading 23%, grade F, #3,583 of 4,322 statewide, top 86%, 672 students, 66% FRL) — zoned schools at 66% FRL track the district average.
- Market conditions: 372 active listings in the ZIP; 12 comparable units currently listed for rent nearby; rentals lingering (median 44d on market — plan ~5-8 weeks vacancy on turnover, expect pricing pressure); 50% of comp listings sitting > 30 days — soft ceiling on asking rent; 1,747 units permitted in Kaufman County in 2024 (180 in 5+ unit buildings).
- This rent runs 36% of the median local income ($72k/yr) — at the standard rent-burdened threshold; future hikes will face affordability resistance.
Forward outlook
- Local home prices are declining (-3.0%/yr); year-one equity from $2k of loan paydown is wiped out by about $7k of value loss. Plan a longer hold.
- Kaufman County population projected at +43% by 2050 — long-run rental-demand tailwind backs the buy-and-hold thesis.
Negotiation context
- It's been on market 34 days — a 3% lower offer ($211k) is reasonable based on typical stale-listing flexibility.
- 6 sale attempts since 12y ago; this cycle's ask has dropped $16k (7%) from the opening price — seller is motivated, your offer sets the floor, not the list.
Risks & watch-outs
- Watch-outs: property tax is 2.8% of price.
- Climate carrying-cost: major wind risk, 27% chance of damaging wind over 30y; major wildfire risk; extreme-heat days projected 7→22/yr by 2055 (HVAC capex compounding) — expect insurance premiums to compound above CPI over the hold.
Questions for the listing agent
- What do current leases actually rent for vs. the listed asking? Can we see a recent rent roll and the last 12 months of T-12 income?
- It's been on market 34 days. Have you received any prior offers? Is the seller open to a 5% concession, seller financing, or rate buy-down credit?
- Built in 1961 — when were the roof, HVAC, electrical panel, plumbing, and water heater last replaced?
- Property tax is high relative to price — has the assessment been appealed recently, and will the sale trigger a re-assessment?
- Is there a deadline driving the sale (1031 exchange, divorce, estate, relocation)? That informs how much negotiation room exists.
- Schools are F-rated, which usually means shorter tenancies and higher turnover. Who's the typical renter profile here, and what's been the actual vacancy rate?
- The area grade is low — what's the realistic commute time and amenity access for the typical tenant pool here? Any planned neighborhood developments (good or bad) we should know about?
- What's the average days-on-market for RENTAL listings here right now (not sales)? A rising rental-DOM trend means longer vacancies and softer asking-rent achievability than the comps imply.
- What's the recent tenant-quality profile in this submarket — average credit score on applications, eviction rate, late-payment / NSF rate, and stable-employment percentage? A property-management company in the area should have these aggregated.
- How much new for-sale + rental construction is in the pipeline within 1–3 miles? Heavy new supply typically softens prices + rents 12–24 months out; constrained supply supports both.
Investment metrics
- 1% rule
- 0.98% ✗
- Cap rate
- 5.96%
- Cash-on-cash
- -1.19%
- DSCR
- 0.95
- GRM
- 8.5
CMA / ARV
- ARV (median comp)
- $228,602
- List price
- $217,900
- Delta
- -4.68%
- Verdict
- FAIR
- Comps
- 20 within 1.0 mi
Show comp detail 12 sales within ~0.75 mi
| Address | Dist | Beds/Ba | Sqft | Sold | Price | $/sf | Match |
|---|---|---|---|---|---|---|---|
| 215 Willow Creek Ln | 0.34mi | 3/2.0 (-1) | 1,580 (+3%) | 3mo | $259,000 | $164 | 68 |
| 106 Jones St | 0.64mi | 3/2.0 (-1) | 1,537 (+0%) | 1mo | $289,900 | $189 | 61 |
| 1110 N Catherine St | 0.09mi | 3/2.0 (-1) | 1,312 (-15%) | 4mo | $199,000 | $152 | 59 |
| 201 North Island Dr | 0.54mi | 3/2.0 (-1) | 1,603 (+4%) | 4mo | $309,900 | $193 | 56 |
| 202 North Island Dr | 0.57mi | 3/2.0 (-1) | 1,603 (+4%) | 5mo | $302,900 | $189 | 53 |
| 205 North Island Dr | 0.54mi | 3/2.0 (-1) | 1,425 (-7%) | 2mo | $294,900 | $207 | 52 |
| 200 North Island Dr | 0.57mi | 3/2.0 (-1) | 1,425 (-7%) | 2mo | $301,900 | $212 | 51 |
| 207 North Island Dr | 0.54mi | 4/2.0 | 1,752 (+14%) | 1mo | $330,900 | $189 | 47 |
| 101 Shady Creek Ln | 0.50mi | 3/2.0 (-1) | 1,349 (-12%) | 3mo | $240,000 | $178 | 45 |
| 238 Willow Creek Ln | 0.43mi | 3/2.0 (-1) | 1,306 (-15%) | 1mo | $245,000 | $188 | 45 |
| 206 North Island Dr | 0.57mi | 3/2.0 (-1) | 1,316 (-14%) | 0mo | $287,900 | $219 | 40 |
| 109 Southgate Dr | 0.63mi | 3/2.0 (-1) | 1,316 (-14%) | 1mo | $287,900 | $219 | 36 |
Match score weights: distance 35% · size 25% · config 20% · recency 20%. Top-matched comps best support the ARV.
Projected returns pro-forma
-3.0% appreciation · 3.0% rent growth · sell at horizon
- IRR
- -18.1%
- Equity multiple
- 0.36×
- Total profit
- $-38,978
- Equity at exit
- $32,490
- IRR
- -10.2%
- Equity multiple
- 0.37×
- Total profit
- $-38,165
- Equity at exit
- $18,840
Cash invested: $61,012 (down + closing). Projections, not guarantees.
Landlord ↔ Tenant lean methodology
- Overall (STATE)
- 87 Strongly Landlord-Friendly
- State Texas
- 87 Strongly Landlord-Friendly · R+5
- County
- — inherits STATE
- City
- — inherits STATE
ZIP-level market 75160
- Home prices YoY
- -13.2%
- Active inventory
- 372
- Price-to-rent
- 8.5×
Monthly cashflow live
- Estimated rent
- $2,135 high interval (Pro) →
- Mortgage (P&I)
- −$1,143
- Tax from tax record
- −$513 /mo · $6,161/yr
- Insurance
- −$91
- HOA
- −$0
- Vacancy / Maint / Mgmt
- −$448
- Net cashflow
- $-60
Break-even live
UW: 25.0% down · 7.5% · 30yr · 1.5% tax · 5.0% vac · 8.0% maint · 8.0% mgmt
Financing live
Cash to close
- Down payment
- $54,475
- Closing costs
- $6,537
- Reserves months
- —
- Total cash needed
- —
Loan-product check · same deal, 3 products live
Conventional
25% down · 7.5% · 30yr
- Down + closing
- —
- Monthly P&I
- —
- Monthly cashflow
- —
- DSCR
- —
- Eligible?
- —
Personal DTI + credit; lowest rate.
DSCR
20% down · 8.5% · 30yr
- Down + closing
- —
- Monthly P&I
- —
- Monthly cashflow
- —
- DSCR
- —
- Eligible?
- —
No personal income docs; deal must DSCR.
Hard money
10% down · 12.0% · 12mo
- Down + closing
- —
- Monthly P&I
- —
- Monthly cashflow
- —
- DSCR
- —
- Eligible?
- —
Short-term bridge; refi at stabilization.
Rent comps 12 comps
| Address | Beds | Baths | Sqft | Rent | $/sqft | DOM | Units | Dist |
|---|---|---|---|---|---|---|---|---|
| 215 Willow Creek Ln Terrell, TX | 3.0 | 2.0 | 1580 | $1,850 | $1.17 | 43d | 1 | 0.33mi |
| 102 Rock Creek Ln Terrell, TX | 3.0 | 2.0 | 1262 | $1,850 | $1.47 | 24d | 1 | 0.38mi |
| 233 Willow Creek Ln Terrell, TX | 3.0 | 2.0 | 1801 | $1,995 | $1.11 | 43d | 1 | 0.42mi |
| 116 N Island Dr Terrell, TX | 3.0–5.0 | 2.0–2.5 | 1909 | $2,435 | $1.28 | 1d | 1 | 0.48mi |
| 114 Brushy Creek Ln Terrell, TX | 3.0 | 2.0 | 1357 | $1,695 | $1.25 | 7d | 1 | 0.49mi |
| 209 Southgate Dr Terrell, TX | 4.0 | 2.5 | 2054 | $2,535 | $1.23 | 43d | 1 | 0.65mi |
| 303 N Delphine St Terrell, TX | 3.0 | 2.0 | 1526 | $1,950 | $1.28 | 43d | 1 | 0.74mi |
| 408 Town North Dr Terrell, TX | 4.0 | 3.0 | 2224 | $2,199 | $0.99 | 7d | 1 | 0.90mi |
| 104 Freeman St Terrell, TX | 4.0 | 2.5 | 1500 | $2,000 | $1.33 | 43d | 1 | 1.31mi |
| 507 Campbell St Terrell, TX | 3.0 | 2.0 | 1268 | $1,950 | $1.54 | 44d | 1 | 1.42mi |
| 102 Paloma Cir Terrell, TX | 4.0 | 2.0 | 1644 | $2,350 | $1.43 | 24d | 1 | 1.47mi |
| 102 Paloma Cir Terrell, TX | 4.0 | 2.0 | 1644 | $2,350 | $1.43 | 20d | 1 | 1.47mi |
Listing history 31 events
-
2026-06-18days on market $217,900 Active 34 DOM
-
2026-06-17days on market $217,900 Active 33 DOM
-
2026-06-16days on market $217,900 Active 32 DOM
-
2026-06-15remarks 699-char remark
-
2026-06-15pricedays on market $217,900 Active 31 DOM
-
2026-06-13days on market $229,700 Active 29 DOM
-
2026-06-13days on market $229,700 Active 28 DOM
-
2026-06-09days on market $229,700 Active 25 DOM
-
2026-06-08days on market $229,700 Active 24 DOM
-
2026-06-07pricedays on market $229,700 Active 23 DOM
-
2026-06-04days on market $233,700 Active 20 DOM
-
2026-06-03days on market $233,700 Active 19 DOM
-
2026-06-02days on market $233,700 Active 18 DOM
-
2026-06-01days on market $233,700 Active 17 DOM
-
2026-05-31days on market $233,700 Active 16 DOM
-
2026-05-15$233,700 Active 1078-char remark
-
2023-08-11price $236,000
-
2023-08-05price $247,900
-
2023-08-01status Active
-
2023-07-29historical Active Option Contract
-
2023-07-15price $252,500
-
2023-07-15status Active
-
2023-06-16price $264,500
-
2023-06-05$274,500 Active
-
2014-05-15soldstatus Closed
Show marketing remark (326 chars)
Small town living. Great investment on a tree-lined street in Terrell near schools, churches and shopping. Very nice full length covered porch on the front and huge back yard. Hardwoods throughout and under existing carpet in some rooms. Woodburning fireplace. Knotty pine walls. This home has lots of character and good bones
-
2014-04-15status Pending
Show marketing remark (326 chars)
Small town living. Great investment on a tree-lined street in Terrell near schools, churches and shopping. Very nice full length covered porch on the front and huge back yard. Hardwoods throughout and under existing carpet in some rooms. Woodburning fireplace. Knotty pine walls. This home has lots of character and good bones
-
2014-04-12status Active
Show marketing remark (326 chars)
Small town living. Great investment on a tree-lined street in Terrell near schools, churches and shopping. Very nice full length covered porch on the front and huge back yard. Hardwoods throughout and under existing carpet in some rooms. Woodburning fireplace. Knotty pine walls. This home has lots of character and good bones
-
2014-04-07status Pending
Show marketing remark (326 chars)
Small town living. Great investment on a tree-lined street in Terrell near schools, churches and shopping. Very nice full length covered porch on the front and huge back yard. Hardwoods throughout and under existing carpet in some rooms. Woodburning fireplace. Knotty pine walls. This home has lots of character and good bones
-
2014-04-02$30,000 Active
Show marketing remark (326 chars)
Small town living. Great investment on a tree-lined street in Terrell near schools, churches and shopping. Very nice full length covered porch on the front and huge back yard. Hardwoods throughout and under existing carpet in some rooms. Woodburning fireplace. Knotty pine walls. This home has lots of character and good bones
-
2006-07-05soldstatus
-
2002-03-12soldstatus
ⓘ Source: listings_history table (triggers on properties + properties_extension) + one-shot
backfill from property_details.listing_events for pre-trigger history.
Tax reassessment forecast TX · Resets to sale price
- Current annual tax
- $6,161 · $513/mo
- Projected year-2 tax
- $6,161 · $513/mo
- Expected delta
- $0/yr ($0/mo · 0.0%)
ⓘ Screening estimate from a state-policy table — verify with the county assessor before closing.
Climate risk First Street
- Flood 1/10 Low FEMA zone X (unshaded) · 0% chance over 30 yrs
- Wildfire 6/10 Major
- Heat 7/10 Severe 7 d/yr ≥109°F today · 22 d/yr by 30 yrs out
- Wind 6/10 Major 27% chance of damaging wind over 30 yrs
- Air quality 2/10 Low 1 unhealthy d/yr today · 1 by 30 yrs out
Nearby sold comps map
Loading sold comps map…
Walkable amenities ~0.75 mi
Loading nearby amenities…
Taxation est. · year 1
- Rental income
- $25,618
- − Mortgage interest
- −$12,206
- − Property taxes
- −$6,161
- − Insurance
- −$1,090
- − Repairs & maintenance
- −$2,049
- − Management
- −$2,049
- − Depreciation
- −$6,339
- Taxable loss
- −$4,277
- Est. tax savings @ 24.0%
- +$1,026
- After-tax cash flow
- $301/yr
For passive investors: Depreciation is non-cash, so a rental often shows a tax loss while cash-flowing — sheltering income. Rental losses are passive: they offset passive income freely, and up to $25,000/yr can offset ordinary (W-2) income if you actively participate and your MAGI is under $100k (phasing out to $0 by $150k); unused losses carry forward. On sale, claimed depreciation is recaptured at up to 25%, and gains may owe capital-gains tax (a 1031 exchange can defer both). Figures are a year-1 estimate at your 24.0% rate — not tax advice; consult a CPA.
Schools (NCES district)
- District
- Terrell ISD
- NCES district ID
- 4842450
- Math proficiency
- 25% ▼ -14.00%
- Reading proficiency
- 30% ▼ -5.00%
- Median HH income
- $44,265
- Composite
- 23.57/100
- National rank
- #7855
- State rank
- #677 of 826 in TX
Livability — Terrell
- Score
- 67/100
- State rank
- #520
- US rank
- #10213
Category grades
Schools grade is shown separately in the Schools card above.
Census & demographics
- Census place
- Terrell, TX
- County
- Kaufman County · 122,338 people
- City population
- 28,206
- Metro
- Dallas-Fort Worth-Arlington, TX
- Population (ZIP)
- 28,206
- Household income
- $71,801
- Rent vs Own
- Severe rent burden
- 845.0
Population outlook (Kaufman County) Hauer SSP2
- Today (2025)
- 138,716 people
- By 2030
- 150,815 · +8.7%
- By 2040
- 174,877 · +26.1%
- By 2050
- 198,020 · +42.8%
- By 2075
- 251,908 · +81.6%
- By 2100
- 285,325 · +105.7%
Race, ethnicity, and origin ACS 2023
- Neighborhood character
- Diverse neighborhood (Simpson 0.64)
- Race & ethnicity
- White 46% Hispanic / Latino 33% Two or more races 19% Black 18%
- Hispanic origin (detail)
- Mexican 30%
- Common ancestry
- Lithuanian 2% Slovak 1% Portuguese 1%
- Foreign-born
- 11% · Canada
- Languages at home
- 75% English-only · Spanish 24% Russian/Polish/Slavic 1%
Political lean MEDSL · Kaufman
- 2024 margin
- Strong R (+27.9) · D 35.6% · R 63.5%
- 2008→2024 swing
- +7.9pp toward D · 2008: -35.8pp · 2024: -27.9pp
- All cycles
- 2024: R+27.9 2020: R+33.9 2016: R+47.0 2012: R+44.4 2008: R+35.8
Not yet ingested
- Civics
- —
Market trends
- HPI YoY
- ▼ -42.39%
- Current HPI
- 278.507
- Rent YoY
- —
- Metro
- Dallas-Fort Worth-Arlington, TX
- State GDP YoY
- ▲ 3.95%
- F500 in state
- 110
Industry mix (Fortune 500 HQ in TX)
| Industry | F500 HQs | Revenue |
|---|---|---|
| Energy | 16 | $1,198B |
|
||
| Technology | 5 | $198B |
|
||
| Engineering / Construction | 4 | $72B |
|
||
| Energy Services | 3 | $60B |
|
||
| Utilities | 3 | $41B |
|
||
| Healthcare | 2 | $330B |
|
||
Price history
+626.3% since first listed18 events — show timeline
- 2026-06-15 Price Changed $217,900 NTREIS
- 2026-06-04 Price Changed $229,700 NTREIS
- 2026-05-15 Listed $233,700 NTREIS
- 2023-08-11 Price Changed $236,000 NTREIS
- 2023-08-05 Price Changed $247,900 NTREIS
- 2023-08-01 Relisted — NTREIS
- 2023-07-29 Contingent — NTREIS
- 2023-07-15 Price Changed $252,500 NTREIS
- 2023-07-15 Relisted — NTREIS
- 2023-06-16 Price Changed $264,500 NTREIS
- 2023-06-05 Listed $274,500 NTREIS
- 2014-05-15 Sold (MLS) — NTREIS
- 2014-04-15 Pending — NTREIS
- 2014-04-12 Relisted — NTREIS
- 2014-04-07 Pending — NTREIS
- 2014-04-02 Listed $30,000 NTREIS
- 2006-07-05 Sold (Public Records) — Public Records
- 2002-03-12 Sold (Public Records) — Public Records
Property tax history
+8.8%/yrLatest (2025): $6,161 · +5.2% YoY. Source: county tax records.
Cash-flow waterfall
monthlySold comps — $/sqft
last 12 mo · ≤1 miLoading sold comps…