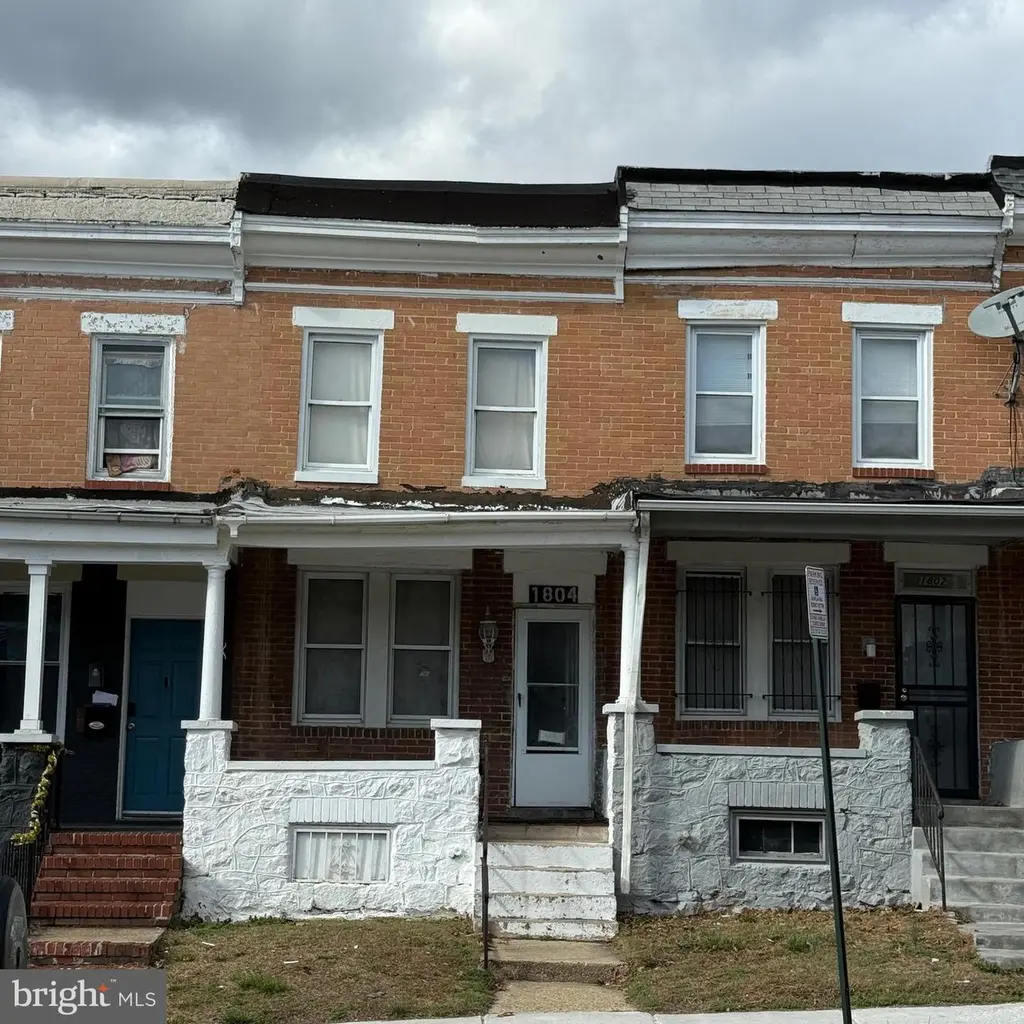
1804 Presstman St · Baltimore, MD
Flood risk 1/10 · Minimal
- FEMA flood zone
- X (unshaded)
- Chance of flooding over 30 yrs
- 0.0%
- Est. flood insurance / yr
- $473 – $860
Fire risk 1/10 · Minimal
- Est. fire insurance / yr
- $755 – $1,403
Heat risk 7/10 · Major
- Hot days now (above 103°F)
- 7 days/yr
- Hot days in 30 yrs
- 15 days/yr
Wind risk 6/10 · Moderate
- Chance of severe wind over 30 yrs
- 27.0%
Air-quality risk 4/10 · Minor
- Unhealthy air days now
- 6 days/yr
- Unhealthy air days in 30 yrs
- 7 days/yr
Risk factors via First Street. Map © Google.
Why this score? — see what drove the B+ grade
The composite is a weighted blend of 9 inputs, each scored 0–100. Each bar is that input's sub-score; the figure is the points it added to the 100-point composite (weight × sub-score).
- Cash flow +30.0/30.0
- ARV discount +15.0/15.0
- 1% rule +10.0/10.0
- DSCR +10.0/10.0
- Rent growth +4.2/5.0
- Livability +3.8/5.0
- Condition / age +2.5/5.0
- Schools +1.0/10.0
- Appreciation +0.0/10.0
$80,000
🖨 Deal sheet 📄 Offer letter ✓ Due diligence
Listing remarks MLS
Traditional Row home ready for you to finish updating. Wood floors on both first and second levels. Full unfinished basement. Water Heater 2019. As is clause required. Great investment opportunity for rental or resale. Three bedrooms upstairs with one full bath. Back porch looks out to city park where concerts and picnics take place. Great central location!
Key facts
- Wood floors
- City park
- Back porch
Tags
Neighborhood map
What this means for you Summary
Snapshot
- This is a 3-bed/1.0-bath townhouse listed at $80k.
Deal economics
- At list price, monthly cash flow is $944 ($11k/yr) — positive.
- The deal already cash-flows at list — no discount required.
- Meets the 1% rule at list price ($2k rent vs $80k).
- Recommended offer: $75k (6.0% below list) — sets the bar for market timing.
- Cap rate 20.5% vs local median 6.0% in Baltimore — top-decile yield for the area; either an underpriced asset or a hidden risk that comps aren't pricing in. Stress-test before assuming the spread holds.
Location & tenants
- Location reads 76/100 on livability (#90 in MD, #3,396 nationally) — a middle-class / working-renter tenant base. Strengths: amenities A+, commute A+, housing A+; Watch: schools D, crime F.
- Baltimore City Public Schools (urban): math 7% / reading 16% proficiency, ranked #24 of 24 in MD (top 100%) — low school quality limits family demand, transient renter base, plan for 1-2y turnover; 79% free/reduced lunch — lower-income household profile, screen leases tightly.
- Market conditions: Rents rising fast (+6.6%/yr); 331 active listings in the ZIP; 40 comparable units currently listed for rent nearby; rentals at typical pace (median 24d on market — plan ~3-4 weeks tenant-placement turnaround); lower-income renter base — watch delinquency; 1,273 units permitted in Baltimore city in 2024 (1,104 in 5+ unit buildings).
- At $1,811/mo this rent would consume 57% of the median local household income ($38k/yr) (locally 2921% of renters already pay >50% of income on rent) — very limited rent-growth headroom before tenants either downsize or default.
Forward outlook
- Local home prices are declining (-3.0%/yr); year-one equity from $553 of loan paydown is wiped out by about $2k of value loss. Plan a longer hold.
- Baltimore County population projected to shrink 4% by 2050 — rents likely to lag national; underwrite the cash flow, not the appreciation.
- At projected returns (-3.0% appreciation + 6.6% rent growth), your $22k cash investment doubles in ~3 years — after that, you're playing with house money.
Negotiation context
- It's been on market 85 days — a 6% lower offer ($75k) is reasonable based on typical stale-listing flexibility.
- Current owner paid $28k; list at $80k implies a 187% gain — meaningful room to come down on a strong offer.
Risks & watch-outs
- Watch-outs: built in 1930 — expect roof / HVAC / electrical / plumbing capex.
- Climate carrying-cost: major wind risk, 27% chance of damaging wind over 30y; extreme-heat days projected 7→15/yr by 2055 (HVAC capex compounding) — expect insurance premiums to compound above CPI over the hold.
Questions for the listing agent
- It's been on market 85 days. Have you received any prior offers? Is the seller open to a 6% concession, seller financing, or rate buy-down credit?
- Built in 1930 — when were the roof, HVAC, electrical panel, plumbing, and water heater last replaced?
- Why hasn't it sold? Are there any deal-killer items the seller is aware of (foundation, flood, title, zoning, code violations)?
- Is there a deadline driving the sale (1031 exchange, divorce, estate, relocation)? That informs how much negotiation room exists.
- Schools are D-rated, which usually means shorter tenancies and higher turnover. Who's the typical renter profile here, and what's been the actual vacancy rate?
- Crime grade is F in this area — have there been break-ins, vandalism, or insurance claims at this property in the last 3 years? What carrier currently insures it and at what premium?
- What's the average days-on-market for RENTAL listings here right now (not sales)? A rising rental-DOM trend means longer vacancies and softer asking-rent achievability than the comps imply.
- What's the recent tenant-quality profile in this submarket — average credit score on applications, eviction rate, late-payment / NSF rate, and stable-employment percentage? A property-management company in the area should have these aggregated.
- How much new for-sale + rental construction is in the pipeline within 1–3 miles? Heavy new supply typically softens prices + rents 12–24 months out; constrained supply supports both.
Investment metrics
- 1% rule
- 2.26% ✓
- Cap rate
- 20.46%
- Cash-on-cash
- 50.59%
- DSCR
- 3.25
- GRM
- 3.7
CMA / ARV
- ARV (median comp)
- $148,429
- List price
- $80,000
- Delta
- -46.10%
- Verdict
- UNDERPRICED
- Comps
- 20 within 1.0 mi
Show comp detail 12 sales within ~0.75 mi
| Address | Dist | Beds/Ba | Sqft | Sold | Price | $/sf | Match |
|---|---|---|---|---|---|---|---|
| 608 Cumberland St | 0.34mi | 3/2.0 | 1,700 (-5%) | 2mo | $90,000 | $53 | 70 |
| 1520 Appleton St | 0.12mi | 3/3.5 | 1,920 (+7%) | 4mo | $215,000 | $112 | 69 |
| 536 Laurens St | 0.66mi | 3/3.0 | 1,768 (-1%) | 0mo | $250,000 | $141 | 59 |
| 1601 Ruxton Ave | 0.43mi | 3/1.0 | 1,568 (-12%) | 1mo | $90,000 | $57 | 58 |
| 2117 N Smallwood St | 0.56mi | 3/2.5 | 1,680 (-6%) | 1mo | $192,000 | $114 | 57 |
| 2429 W Lafayette Ave | 0.71mi | 4/1.5 (+1) | 1,850 (+3%) | 4mo | $109,000 | $59 | 51 |
| 1920 N Bentalou St | 0.54mi | 4/3.5 (+1) | 1,928 (+8%) | 1mo | $255,000 | $132 | 46 |
| 2009 Ruxton Ave | 0.57mi | 4/2.0 (+1) | 1,600 (-11%) | 1mo | $234,000 | $146 | 46 |
| 2105 Whittier Ave | 0.69mi | 3/1.5 | 1,587 (-11%) | 1mo | $80,000 | $50 | 46 |
| 2318 W Lanvale St | 0.69mi | 4/2.5 (+1) | 1,884 (+5%) | 2mo | $180,000 | $96 | 46 |
| 2400 W Lafayette Ave | 0.64mi | 4/2.0 (+1) | 1,584 (-12%) | 2mo | $263,000 | $166 | 40 |
| 2514 W Lafayette Ave | 0.72mi | 3/2.0 | 1,560 (-13%) | 2mo | $232,000 | $149 | 39 |
Match score weights: distance 35% · size 25% · config 20% · recency 20%. Top-matched comps best support the ARV.
Projected returns pro-forma
-3.0% appreciation · 6.63% rent growth · sell at horizon
- IRR
- 52.2%
- Equity multiple
- 3.41×
- Total profit
- $54,023
- Equity at exit
- $11,928
- IRR
- 58.9%
- Equity multiple
- 7.91×
- Total profit
- $154,745
- Equity at exit
- $6,917
Cash invested: $22,400 (down + closing). Projections, not guarantees.
Landlord ↔ Tenant lean methodology
- Overall (CITY)
- 12 Strongly Tenant-Friendly
- State Maryland
- 27 Tenant-Leaning · D+14
- County
- — inherits STATE
- City Baltimore
- 12 Strongly Tenant-Friendly · D+58
ZIP-level market 21217
- Rents YoY
- 6.6%
- Active inventory
- 331
- Price-to-rent
- 3.7×
Monthly cashflow live
- Estimated rent
- $1,811 high interval (Pro) →
- Mortgage (P&I)
- −$420
- Tax from tax record
- −$33 /mo · $400/yr
- Insurance
- −$33
- HOA
- −$0
- Vacancy / Maint / Mgmt
- −$380
- Net cashflow
- $944
Break-even live
UW: 25.0% down · 7.5% · 30yr · 1.5% tax · 5.0% vac · 8.0% maint · 8.0% mgmt
Financing live
Cash to close
- Down payment
- $20,000
- Closing costs
- $2,400
- Reserves months
- —
- Total cash needed
- —
Loan-product check · same deal, 3 products live
Conventional
25% down · 7.5% · 30yr
- Down + closing
- —
- Monthly P&I
- —
- Monthly cashflow
- —
- DSCR
- —
- Eligible?
- —
Personal DTI + credit; lowest rate.
DSCR
20% down · 8.5% · 30yr
- Down + closing
- —
- Monthly P&I
- —
- Monthly cashflow
- —
- DSCR
- —
- Eligible?
- —
No personal income docs; deal must DSCR.
Hard money
10% down · 12.0% · 12mo
- Down + closing
- —
- Monthly P&I
- —
- Monthly cashflow
- —
- DSCR
- —
- Eligible?
- —
Short-term bridge; refi at stabilization.
Rent comps 40 comps
| Address | Beds | Baths | Sqft | Rent | $/sqft | DOM | Units | Dist |
|---|---|---|---|---|---|---|---|---|
| 1516 N Mount St Baltimore, MD | 3.0 | 1.5 | 1830 | $1,750 | $0.96 | 14d | 1 | 0.13mi |
| 1501 N Payson St Baltimore, MD | 3.0 | 1.0 | 1400 | $1,550 | $1.11 | 43d | 1 | 0.13mi |
| 1616 N Fulton Ave Baltimore, MD | 3.0 | 2.0 | 1620 | $1,795 | $1.11 | 4d | 1 | 0.14mi |
| 1613 Riggs Ave Baltimore, MD | 3.0 | 2.5 | 1800 | $1,800 | $1.00 | 23d | 1 | 0.33mi |
| 1315 Presstman St Baltimore, MD | 4.0 | 2.0 | 1700 | $2,000 | $1.18 | 43d | 1 | 0.38mi |
| 2614 Pennsylvania Ave Baltimore, MD | 1.0–3.0 | 1.0–2.0 | 982 | $1,141 | $1.16 | 4d | 4 | 0.46mi |
| 519 Sanford Pl Baltimore, MD | 3.0 | 1.0 | 1300 | $1,650 | $1.27 | 16d | 1 | 0.46mi |
| 1816 N Bentalou St Baltimore, MD | 3.0 | 2.0 | 1350 | $1,700 | $1.26 | 10d | 1 | 0.48mi |
| 1816 N Bentalou St Baltimore, MD | 3.0 | 2.0 | 1350 | $1,700 | $1.26 | 23d | 1 | 0.48mi |
| 1617-A Moreland Ave Unit 2nd Flr Baltimore, MD | 2.0 | 1.0 | 1500 | $1,400 | $0.93 | 43d | 1 | 0.51mi |
| 918 N Bentalou St Baltimore, MD | 3.0 | 1.5 | 1485 | $1,750 | $1.18 | 43d | 1 | 0.55mi |
| 2505 Woodbrook Ave Baltimore, MD | 4.0 | 2.0 | 1256 | $1,745 | $1.39 | 2d | 1 | 0.55mi |
| 2405 W North Ave Baltimore, MD | 4.0 | 3.0 | 1826 | $1,900 | $1.04 | 4d | 1 | 0.57mi |
| 2409 Francis St Baltimore, MD | 3.0 | 1.0 | 1298 | $1,500 | $1.16 | 43d | 1 | 0.58mi |
| 2128 N Pulaski St Baltimore, MD | 4.0 | 3.0 | 2166 | $2,200 | $1.02 | 43d | 1 | 0.59mi |
| 2204 Clifton Ave Baltimore, MD | 3.0 | 1.0 | 1400 | $1,450 | $1.04 | 4d | 1 | 0.59mi |
| 2028 Druid Hill Ave Baltimore, MD | 3.0 | 2.5 | 1437 | $1,799 | $1.25 | 10d | 1 | 0.62mi |
| 2028 Druid Hill Ave Unit 1 Baltimore, MD | 3.0 | 2.5 | 1437 | $1,750 | $1.22 | 2d | 1 | 0.62mi |
| 1205 Clendenin St Baltimore, MD | 3.0 | 1.5 | 1560 | $800 | $0.51 | 23d | 1 | 0.62mi |
| 2303 Calverton Heights Ave Baltimore, MD | 4.0 | 2.0 | 1314 | $2,250 | $1.71 | 23d | 1 | 0.63mi |
| 2020 McCulloh St Unit 1 Baltimore, MD | 2.0 | 2.0 | 2440 | $1,650 | $0.68 | 43d | 1 | 0.67mi |
| 2020 McCulloh St Unit 2 Baltimore, MD | 2.0 | 2.0 | 2440 | $1,950 | $0.80 | 43d | 1 | 0.67mi |
| 1625 Edmondson Ave Unit 1 Baltimore, MD | 4.0 | 3.0 | 1500 | $2,175 | $1.45 | 4d | 1 | 0.70mi |
| 1625 Edmondson Ave Unit 2 Baltimore, MD | 4.0 | 3.0 | 1500 | $1,895 | $1.26 | 12d | 1 | 0.70mi |
| 1509 Edmondson Ave #1 Baltimore, MD | 3.0 | 2.0 | 1600 | $2,275 | $1.42 | 23d | 1 | 0.73mi |
| 2201 Whittier Ave Baltimore, MD | 4.0 | 2.0 | 1750 | $1,700 | $0.97 | 43d | 1 | 0.74mi |
| 2201 Whittier Ave Baltimore, MD | 4.0 | 2.0 | 1750 | $1,700 | $0.97 | 17d | 1 | 0.74mi |
| 1725 Druid Hill Ave Baltimore, MD | 4.0 | 3.0 | 2195 | $2,100 | $0.96 | 23d | 1 | 0.76mi |
| 2339 Eutaw Pl Ste 1 Baltimore, MD | 2.0 | 1.0 | 1300 | $1,275 | $0.98 | 43d | 1 | 0.80mi |
| 1012 W Lanvale St Baltimore, MD | 2.0 | 2.0 | 2008 | $1,925 | $0.96 | 23d | 1 | 0.82mi |
| 1628 McCulloh St Unit 2 Baltimore, MD | 4.0 | 2.5 | 2000 | $2,000 | $1.00 | 4d | 1 | 0.82mi |
| 549 Mosher St Baltimore, MD | 3.0 | 1.0 | 2200 | $1,350 | $0.61 | 43d | 1 | 0.83mi |
| 2728 Winchester St Baltimore, MD | 3.0 | 1.5 | 1260 | $1,800 | $1.43 | 3d | 1 | 0.87mi |
| 1829 Eutaw Pl Unit B Baltimore, MD | 2.0 | 2.0 | 1278 | $2,100 | $1.64 | 4d | 1 | 0.87mi |
| 1846 W Saratoga St Unit 1 Baltimore, MD | 2.0 | 1.0 | 1250 | $1,300 | $1.04 | 43d | 1 | 0.89mi |
| 1702 Eutaw Pl Baltimore, MD | 2.0 | 2.0 | 2000 | $1,550 | $0.78 | 17d | 1 | 0.90mi |
| 2012 W Saratoga St Baltimore, MD | 3.0 | 1.0 | 1300 | $1,700 | $1.31 | 23d | 1 | 0.90mi |
| 2800 Presstman St Baltimore, MD | 3.0 | 2.5 | 1460 | $1,799 | $1.23 | 23d | 1 | 0.91mi |
| 1814 Penrose Ave Baltimore, MD | 3.0 | 1.0 | 1624 | $1,700 | $1.05 | 17d | 1 | 0.93mi |
| 2744 W Mosher St Baltimore, MD | 4.0 | 2.0 | 1412 | $2,100 | $1.49 | 23d | 1 | 0.94mi |
Listing history 16 events
-
2026-06-18days on market $80,000 Active 85 DOM
-
2026-06-17days on market $80,000 Active 84 DOM
-
2026-06-16days on market $80,000 Active 83 DOM
-
2026-06-15days on market $80,000 Active 82 DOM
-
2026-06-13days on market $80,000 Active 80 DOM
-
2026-06-09days on market $80,000 Active 76 DOM
-
2026-06-08days on market $80,000 Active 75 DOM
-
2026-06-07days on market $80,000 Active 74 DOM
-
2026-06-04days on market $80,000 Active 71 DOM
-
2026-06-03days on market $80,000 Active 70 DOM
-
2026-06-02days on market $80,000 Active 69 DOM
-
2026-06-01days on market $80,000 Active 68 DOM
-
2026-05-31days on market $80,000 Active 67 DOM
-
2026-03-25$80,000 Active 360-char remark
Show marketing remark (360 chars)
Traditional Row home ready for you to finish updating. Wood floors on both first and second levels. Full unfinished basement. Water Heater 2019. As is clause required. Great investment opportunity for rental or resale. Three bedrooms upstairs with one full bath. Back porch looks out to city park where concerts and picnics take place. Great central location!
-
1995-08-31soldstatus $27,900
-
1985-01-28soldstatus $14,000
ⓘ Source: listings_history table (triggers on properties + properties_extension) + one-shot
backfill from property_details.listing_events for pre-trigger history.
Tax reassessment forecast MD · Partial reset (capped growth)
- Current annual tax
- $400 · $33/mo
- Projected year-2 tax
- $636 · $53/mo
- Expected delta
- +$236/yr (+$20/mo · 59.0%)
ⓘ Screening estimate from a state-policy table — verify with the county assessor before closing.
Climate risk First Street
- Flood 1/10 Low FEMA zone X (unshaded) · 0% chance over 30 yrs
- Wildfire 1/10 Low
- Heat 7/10 Severe 7 d/yr ≥103°F today · 15 d/yr by 30 yrs out
- Wind 6/10 Major 27% chance of damaging wind over 30 yrs
- Air quality 4/10 Moderate 6 unhealthy d/yr today · 7 by 30 yrs out
Nearby sold comps map
Loading sold comps map…
Walkable amenities ~0.75 mi
Loading nearby amenities…
Taxation est. · year 1
- Rental income
- $21,730
- − Mortgage interest
- −$4,481
- − Property taxes
- −$400
- − Insurance
- −$400
- − Repairs & maintenance
- −$1,738
- − Management
- −$1,738
- − Depreciation
- −$2,327
- Taxable income
- $10,644
- Est. tax owed @ 24.0%
- −$2,555
- After-tax cash flow
- $8,777/yr
For passive investors: Depreciation is non-cash, so a rental often shows a tax loss while cash-flowing — sheltering income. Rental losses are passive: they offset passive income freely, and up to $25,000/yr can offset ordinary (W-2) income if you actively participate and your MAGI is under $100k (phasing out to $0 by $150k); unused losses carry forward. On sale, claimed depreciation is recaptured at up to 25%, and gains may owe capital-gains tax (a 1031 exchange can defer both). Figures are a year-1 estimate at your 24.0% rate — not tax advice; consult a CPA.
Schools (NCES district)
- District
- Baltimore City Public Schools
- NCES district ID
- 2400090
- Math proficiency
- 7% ▼ -9.00%
- Reading proficiency
- 16% ▼ -5.00%
- Median HH income
- $42,108
- Composite
- 10.08/100
- National rank
- #9805
- State rank
- #24 of 24 in MD
Livability — Baltimore
- Score
- 76/100
- State rank
- #90
- US rank
- #3396
Category grades
Schools grade is shown separately in the Schools card above.
Census & demographics
- Census place
- Baltimore, MD
- County
- Baltimore City · 558,601 people
- City population
- 588,727
- Metro
- Baltimore-Columbia-Towson, MD
- Population (ZIP)
- 30,792
- Household income
- $38,409
- Rent vs Own
- Severe rent burden
- 2921.0
Population outlook (Baltimore County) Hauer SSP2
- Today (2025)
- 624,249 people
- By 2030
- 621,541 · -0.4%
- By 2040
- 609,756 · -2.3%
- By 2050
- 597,249 · -4.3%
- By 2075
- 552,236 · -11.5%
- By 2100
- 513,934 · -17.7%
Race, ethnicity, and origin ACS 2023
- Neighborhood character
- Predominantly Black (81%)
- Race & ethnicity
- Black 81% White 12% Two or more races 4% Hispanic / Latino 2% Asian 2%
- Common ancestry
- Romanian 1% Hispanic 1% Italian 1%
- Foreign-born
- 5% · Canada, China, South Korea
- Languages at home
- 94% English-only · Spanish 2% French/Haitian/Cajun 1% Chinese 1%
Political lean MEDSL · Baltimore
- 2024 margin
- Solid D (+73.0) · D 85.2% · R 12.2% · Other 2.6%
- 2008→2024 swing
- -2.5pp toward R · 2008: 75.5pp · 2024: 73.0pp
- All cycles
- 2024: D+73.0 2020: D+76.6 2016: D+74.6 2012: D+76.4 2008: D+75.5
Not yet ingested
- Civics
- —
Market trends
- HPI YoY
- ▼ -187.20%
- Current HPI
- 104.2102
- Rent YoY
- ▲ 6.63%
- Metro
- Baltimore-Columbia-Towson, MD
- State GDP YoY
- ▲ 2.97%
- F500 in state
- 12
Industry mix (Fortune 500 HQ in MD)
| Industry | F500 HQs | Revenue |
|---|---|---|
| Aerospace / Defense | 1 | $71B |
|
||
| Utilities | 1 | $25B |
|
||
| Hotels | 1 | $24B |
|
||
| Consumer Goods | 1 | $7B |
|
||
| Real Estate | 1 | $6B |
|
||
| Chemicals | 1 | $2B |
|
||
Price history
+471.4% since first listed3 events — show timeline
- 2026-03-25 Listed $80,000 BRIGHT MLS
- 1995-08-31 Sold (Public Records) $27,900 Public Records
- 1985-01-28 Sold (Public Records) $14,000 Public Records
Property tax history
-2.6%/yrLatest (2025): $400 · +5.4% YoY. Source: county tax records.
Cash-flow waterfall
monthlySold comps — $/sqft
last 12 mo · ≤1 miLoading sold comps…