 🏷️ Likely Rental
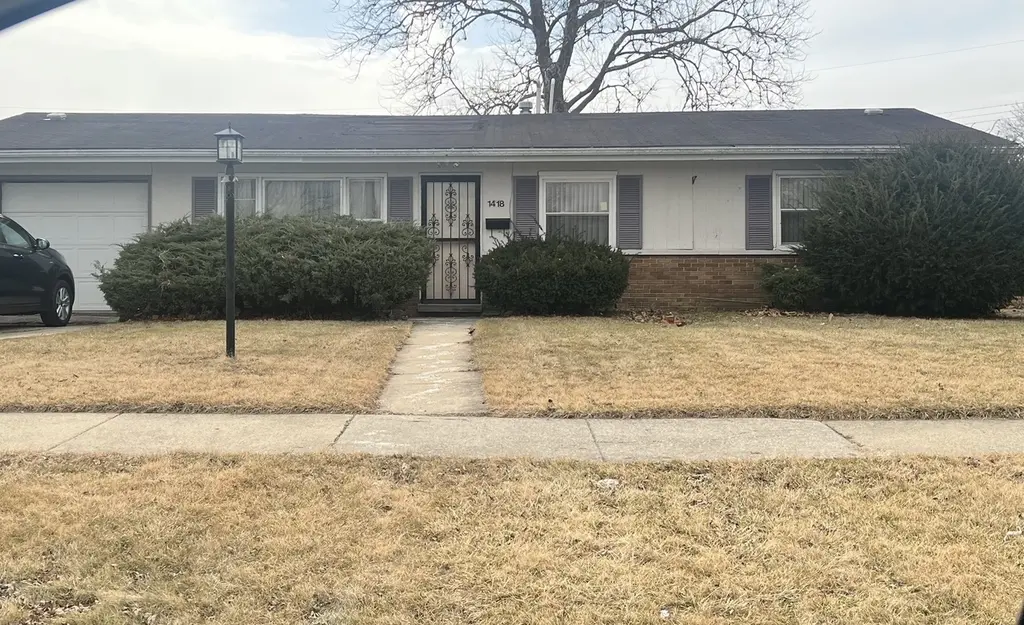
1418 E 13th Pl · Ford Heights, IL
Flood risk 1/10 · Minimal
- FEMA flood zone
- X (unshaded)
- Chance of flooding over 30 yrs
- 0.0%
- Est. flood insurance / yr
- $473 – $860
Fire risk 1/10 · Minimal
- Est. fire insurance / yr
- $804 – $1,492
Heat risk 3/10 · Minor
- Hot days now (above 101°F)
- 7 days/yr
- Hot days in 30 yrs
- 15 days/yr
Wind risk 2/10 · Minimal
- Chance of severe wind over 30 yrs
- 0.0%
Air-quality risk 2/10 · Minimal
- Unhealthy air days now
- 2 days/yr
- Unhealthy air days in 30 yrs
- 2 days/yr
Risk factors via First Street. Map © Google.
Why this score? — see what drove the B+ grade
The composite is a weighted blend of 9 inputs, each scored 0–100. Each bar is that input's sub-score; the figure is the points it added to the 100-point composite (weight × sub-score).
- Cash flow +30.0/30.0
- ARV discount +15.0/15.0
- 1% rule +10.0/10.0
- DSCR +10.0/10.0
- Rent growth +4.1/5.0
- Livability +3.2/5.0
- Condition / age +2.5/5.0
- Schools +0.7/10.0
- Appreciation +0.0/10.0
$103,000
🖨 Deal sheet 📄 Offer letter ✓ Due diligence
Listing remarks
This 3-bedroom, 1.5 bath home with an attached garage is a fantastic addition to any investment portfolio. The property is currently tenant-occupied by a long-term renter, providing immediate rental income. The home was updated in 2020, including improvements to the kitchen and bathrooms, offering modern touches while maintaing comfortable living spaces. With solid bones and steady occupancy, this property presents a great opportunity for investors looking for a turnkey rental with reliable cash flow. Don't miss the chance to secure a property with built-in income potential. Property qualifies for special financing program.
Key facts
- Updated in 2020
- Garage
- Built 1960
Tags
Property features AI
Finance
- Other: Property currently being leased; Rehab completed in 2020; Parcel number available
- HOA & community: No master association fee required
Exterior
- Parking: Attached garage (1-car)
- Utilities: Public water; Public sewer
- Home design: Detached single-family home; One-story; Fee simple ownership; Property was rehabbed in 2020; Built before 1978 (estimated age 61–70 years)
- Construction: Vinyl siding and brick exterior
- Exterior features: Lot size less than 0.25 acre; Lot dimensions: 8005
Interior
- Kitchen: Kitchen on main level (approx. 17 x 12)
- Bedrooms: Master bedroom on main level (approx. 14 x 12); Bedroom on main level (approx. 12 x 10); Bedroom on main level (approx. 11 x 10)
- Bathrooms: One full bathroom; One half bathroom
- Heating & cooling: Natural gas heating; Central air conditioning
- Interior features: Six total rooms; Commuter bus and interstate access nearby
- Laundry & utility: Main-level laundry room (approx. 5 x 3) with gas dryer hookup
Neighborhood map
What this means for you Summary
Snapshot
- This is a 3-bed/1.0-bath single-family listed at $103k.
Deal economics
- At list price, monthly cash flow is $519 ($6k/yr) — positive.
- The deal already cash-flows at list — no discount required.
- Meets the 1% rule at list price ($2k rent vs $103k).
- Recommended offer: $97k (6.0% below list) — sets the bar for market timing.
Location & tenants
- Location reads 64/100 on livability (#685 in IL) — a middle-class / working-renter tenant base. Strengths: commute A+, cost of living A+, crime A-; Watch: schools F, amenities F, employment F.
- Bloom Twp Hsd 206 (suburban): math 8% / reading 9% proficiency, ranked #591 of 620 in IL (top 95%) — low school quality limits family demand, transient renter base, plan for 1-2y turnover.
- Market conditions: Rents rising fast (+6.5%/yr); 222 active listings in the ZIP; 3 comparable units currently listed for rent nearby; rentals leasing fast (median 2d on market — plan ~1-2 weeks tenant-placement turnaround); 6,272 units permitted in Cook County in 2024 (4,658 in 5+ unit buildings).
- This rent runs 33% of the median local income ($62k/yr) — at the standard rent-burdened threshold; future hikes will face affordability resistance.
Forward outlook
- Local home prices are declining (-3.0%/yr); year-one equity from $712 of loan paydown is wiped out by about $3k of value loss. Plan a longer hold.
- At projected returns (-3.0% appreciation + 6.5% rent growth), your $29k cash investment doubles in ~5 years — after that, you're playing with house money.
Negotiation context
- It's been on market 86 days — a 6% lower offer ($97k) is reasonable based on typical stale-listing flexibility.
Risks & watch-outs
- Watch-outs: property tax is 3.1% of price.
Questions for the listing agent
- It's been on market 86 days. Have you received any prior offers? Is the seller open to a 6% concession, seller financing, or rate buy-down credit?
- Built in 1960 — when were the roof, HVAC, electrical panel, plumbing, and water heater last replaced?
- Property tax is high relative to price — has the assessment been appealed recently, and will the sale trigger a re-assessment?
- Why hasn't it sold? Are there any deal-killer items the seller is aware of (foundation, flood, title, zoning, code violations)?
- Is there a deadline driving the sale (1031 exchange, divorce, estate, relocation)? That informs how much negotiation room exists.
- Schools are F-rated, which usually means shorter tenancies and higher turnover. Who's the typical renter profile here, and what's been the actual vacancy rate?
- What's the average days-on-market for RENTAL listings here right now (not sales)? A rising rental-DOM trend means longer vacancies and softer asking-rent achievability than the comps imply.
- What's the recent tenant-quality profile in this submarket — average credit score on applications, eviction rate, late-payment / NSF rate, and stable-employment percentage? A property-management company in the area should have these aggregated.
- How much new for-sale + rental construction is in the pipeline within 1–3 miles? Heavy new supply typically softens prices + rents 12–24 months out; constrained supply supports both.
Investment metrics
- 1% rule
- 1.68% ✓
- Cap rate
- 12.34%
- Cash-on-cash
- 21.58%
- DSCR
- 1.96
- GRM
- 5.0
CMA / ARV
- ARV (on-the-fly)
- $140,360
- Comps found
- 10
Show comp detail 10 sales within ~0.75 mi
| Address | Dist | Beds/Ba | Sqft | Sold | Price | $/sf | Match |
|---|---|---|---|---|---|---|---|
| 1403 15th St | 0.21mi | 3/2.0 | 1,144 (-1%) | 6mo | $138,000 | $121 | 78 |
| 1449 Park Ln | 0.20mi | 4/1.5 (+1) | 1,150 (-1%) | 11mo | $172,000 | $150 | 73 |
| 1444 Park Ln | 0.22mi | 4/1.5 (+1) | 1,100 (-5%) | 11mo | $155,000 | $141 | 65 |
| 1124 Seeley Ave | 0.53mi | 2/1.0 (-1) | 1,146 (-1%) | 7mo | $35,000 | $31 | 63 |
| 1415 E 15th Pl | 0.26mi | 3/2.0 | 1,267 (+9%) | 10mo | $95,000 | $75 | 60 |
| 1023 Cottage Grove Ave | 0.68mi | 3/1.0 | 1,113 (-4%) | 12mo | $110,000 | $99 | 52 |
| 1126 Seeley Ave | 0.54mi | 3/1.0 | 1,202 (+4%) | 24mo | $95,000 | $79 | 49 |
| 1407 E 15th St | 0.26mi | 2/1.5 (-1) | 1,036 (-11%) | 18mo | $70,000 | $68 | 48 |
| 1529 Ambassador Ln | 0.34mi | 4/2.0 (+1) | 1,000 (-14%) | 10mo | $152,000 | $152 | 44 |
| 20436 Langston St | 0.61mi | 4/1.0 (+1) | 1,260 (+9%) | 13mo | $325,000 | $258 | 42 |
Match score weights: distance 35% · size 25% · config 20% · recency 20%. Top-matched comps best support the ARV.
Projected returns pro-forma
-3.0% appreciation · 6.48% rent growth · sell at horizon
- IRR
- 18.5%
- Equity multiple
- 1.79×
- Total profit
- $22,706
- Equity at exit
- $15,358
- IRR
- 29.5%
- Equity multiple
- 4.13×
- Total profit
- $90,319
- Equity at exit
- $8,906
Cash invested: $28,840 (down + closing). Projections, not guarantees.
Landlord ↔ Tenant lean methodology
- Overall (STATE)
- 43 Moderately Tenant-Leaning
- State Illinois
- 43 Moderately Tenant-Leaning · D+7
- County
- — inherits STATE
- City
- — inherits STATE
ZIP-level market 60411
- Home prices YoY
- -33.9%
- Rents YoY
- 6.5%
- Active inventory
- 222
- Price-to-rent
- 5.0×
Monthly cashflow live
- Estimated rent
- $1,726 medium interval (Pro) →
- Mortgage (P&I)
- −$540
- Tax from tax record
- −$262 /mo · $3,142/yr
- Insurance
- −$43
- HOA
- −$0
- Vacancy / Maint / Mgmt
- −$362
- Net cashflow
- $519
Break-even live
UW: 25.0% down · 7.5% · 30yr · 1.5% tax · 5.0% vac · 8.0% maint · 8.0% mgmt
Financing live
Cash to close
- Down payment
- $25,750
- Closing costs
- $3,090
- Reserves months
- —
- Total cash needed
- —
Loan-product check · same deal, 3 products live
Conventional
25% down · 7.5% · 30yr
- Down + closing
- —
- Monthly P&I
- —
- Monthly cashflow
- —
- DSCR
- —
- Eligible?
- —
Personal DTI + credit; lowest rate.
DSCR
20% down · 8.5% · 30yr
- Down + closing
- —
- Monthly P&I
- —
- Monthly cashflow
- —
- DSCR
- —
- Eligible?
- —
No personal income docs; deal must DSCR.
Hard money
10% down · 12.0% · 12mo
- Down + closing
- —
- Monthly P&I
- —
- Monthly cashflow
- —
- DSCR
- —
- Eligible?
- —
Short-term bridge; refi at stabilization.
Rent comps 3 comps
| Address | Beds | Baths | Sqft | Rent | $/sqft | DOM | Units | Dist |
|---|---|---|---|---|---|---|---|---|
| 21538 Gailine Ave Chicago Heights, IL | 3.0 | 1.0 | 1031 | $1,600 | $1.55 | 3d | 1 | 1.09mi |
| 2241 Astor St Unit Labs Sauk Village, IL | 2.0 | 2.0 | 1000 | $1,650 | $1.65 | 1d | 1 | 1.11mi |
| 1154 Barry Ln Sauk Village, IL | 2.0 | 2.0 | 960 | $1,550 | $1.61 | 1d | 1 | 1.19mi |
Listing history 17 events
-
2026-06-18days on market $103,000 Active 86 DOM
-
2026-06-17days on market $103,000 Active 85 DOM
-
2026-06-16days on market $103,000 Active 84 DOM
-
2026-06-15days on market $103,000 Active 83 DOM
-
2026-06-13days on market $103,000 Active 81 DOM
-
2026-06-13remarks 631-char remark
-
2026-06-13days on market $103,000 Active 80 DOM
-
2026-06-09days on market $103,000 Active 77 DOM
-
2026-06-08days on market $103,000 Active 76 DOM
-
2026-06-07days on market $103,000 Active 75 DOM
-
2026-06-04days on market $103,000 Active 72 DOM
-
2026-06-03days on market $103,000 Active 71 DOM
-
2026-06-02days on market $103,000 Active 70 DOM
-
2026-06-01days on market $103,000 Active 69 DOM
-
2026-05-31days on market $103,000 Active 68 DOM
-
2026-05-05price $103,000
-
2026-03-24$115,000 Active
ⓘ Source: listings_history table (triggers on properties + properties_extension) + one-shot
backfill from property_details.listing_events for pre-trigger history.
Tax reassessment forecast IL · Partial reset (capped growth)
- Current annual tax
- $3,142 · $262/mo
- Projected year-2 tax
- $3,142 · $262/mo
- Expected delta
- $0/yr ($0/mo · 0.0%)
ⓘ Screening estimate from a state-policy table — verify with the county assessor before closing.
Climate risk First Street
- Flood 1/10 Low FEMA zone X (unshaded) · 0% chance over 30 yrs
- Wildfire 1/10 Low
- Heat 3/10 Moderate 7 d/yr ≥101°F today · 15 d/yr by 30 yrs out
- Wind 2/10 Low 0% chance of damaging wind over 30 yrs
- Air quality 2/10 Low 2 unhealthy d/yr today · 2 by 30 yrs out
Nearby sold comps map
Loading sold comps map…
Walkable amenities ~0.75 mi
Loading nearby amenities…
Taxation est. · year 1
- Rental income
- $20,713
- − Mortgage interest
- −$5,770
- − Property taxes
- −$3,142
- − Insurance
- −$515
- − Repairs & maintenance
- −$1,657
- − Management
- −$1,657
- − Depreciation
- −$2,996
- Taxable income
- $4,975
- Est. tax owed @ 24.0%
- −$1,194
- After-tax cash flow
- $5,030/yr
For passive investors: Depreciation is non-cash, so a rental often shows a tax loss while cash-flowing — sheltering income. Rental losses are passive: they offset passive income freely, and up to $25,000/yr can offset ordinary (W-2) income if you actively participate and your MAGI is under $100k (phasing out to $0 by $150k); unused losses carry forward. On sale, claimed depreciation is recaptured at up to 25%, and gains may owe capital-gains tax (a 1031 exchange can defer both). Figures are a year-1 estimate at your 24.0% rate — not tax advice; consult a CPA.
Schools (NCES district)
- District
- Bloom Twp Hsd 206
- NCES district ID
- 1706420
- Math proficiency
- 8% ▼ -3.00%
- Reading proficiency
- 9% ▼ -8.00%
- Median HH income
- $39,795
- Composite
- 7.4/100
- National rank
- #9952
- State rank
- #591 of 620 in IL
Livability — Ford Heights
- Score
- 64/100
- State rank
- #685
- US rank
- #13999
Category grades
Schools grade is shown separately in the Schools card above.
Census & demographics
- Census place
- Ford Heights, IL
- County
- Cook County · 4,486,803 people
- Metro
- Chicago-Naperville-Elgin, IL-IN-WI
- Population (ZIP)
- 52,175
- Household income
- $62,073
- Rent vs Own
- Severe rent burden
- 1714.0
Population outlook (Cook County) Hauer SSP2
- Today (2025)
- 5,347,519 people
- By 2030
- 5,357,703 · +0.2%
- By 2040
- 5,324,924 · -0.4%
- By 2050
- 5,230,762 · -2.2%
- By 2075
- 4,785,735 · -10.5%
- By 2100
- 4,188,836 · -21.7%
Race, ethnicity, and origin ACS 2023
- Neighborhood character
- Diverse neighborhood (Simpson 0.66)
- Race & ethnicity
- Black 49% Hispanic / Latino 26% White 19% Two or more races 11%
- Hispanic origin (detail)
- Mexican 22% Puerto Rican 2%
- Common ancestry
- Romanian 4% Portuguese 1% Lithuanian 1%
- Foreign-born
- 12% · Canada
- Languages at home
- 76% English-only · Spanish 21% Russian/Polish/Slavic 1% Other Indo-European 1%
Political lean MEDSL · Cook
- 2024 margin
- Solid D (+42.0) · D 70.4% · R 28.4% · Other 1.2%
- 2008→2024 swing
- -11.4pp toward R · 2008: 53.4pp · 2024: 42.0pp
- All cycles
- 2024: D+42.0 2020: D+50.3 2016: D+53.0 2012: D+49.4 2008: D+53.4
Not yet ingested
- Civics
- —
Market trends
- HPI YoY
- ▼ -108.75%
- Current HPI
- 212.4058
- Rent YoY
- ▲ 6.48%
- Metro
- Chicago-Naperville-Elgin, IL-IN-WI
- State GDP YoY
- ▲ 1.59%
- F500 in state
- 60
Industry mix (Fortune 500 HQ in IL)
| Industry | F500 HQs | Revenue |
|---|---|---|
| Insurance | 4 | $201B |
|
||
| Consumer Goods | 4 | $87B |
|
||
| Industrial Machinery | 3 | $64B |
|
||
| Healthcare | 2 | $55B |
|
||
| Retail / Pharmacy | 1 | $148B |
|
||
| Agriculture / Food | 1 | $86B |
|
||
Price history
-10.4% since first listed2 events — show timeline
- 2026-05-05 Price Changed $103,000 MRED as Distributed by MLS Grid
- 2026-03-24 Listed $115,000 MRED as Distributed by MLS Grid
Property tax history
+2.2%/yrLatest (2023): $3,142 · +38.3% YoY. Source: county tax records.
Cash-flow waterfall
monthlySold comps — $/sqft
last 12 mo · ≤1 miLoading sold comps…